


Written by on CSS Wizardry.
Independent writing is brought to you via my wonderful Supporters.
A large part of my performance consultancy work is auditing and subsequently governing third-party scripts, dependencies, and their providers. Uncovering these third-parties isn’t always so straightforward, and discussing them with the internal teams responsible (more often than not, the Marketing Department) is usually quite sensitive and often uncomfortable: after all, approaching a third-party vendors, or your marketing team, and telling them that their entire day job is detrimental to performance is never going to be well-received.
In order to help me have these awkward discussions—and it’s often my job as a consultant to be the one having them—I lean on a number of tools to help make the topic as objective and straightforward as possible. I want to share them with you.
The single most useful tool I make use of when it comes to simply identifying third parties is Simon Hearne’s indispensable Request Map. The workflow around this tool is pretty straightforward:
Once that’s done, you’ll be presented with what my clients and I have lovingly dubbed the jellyfish:
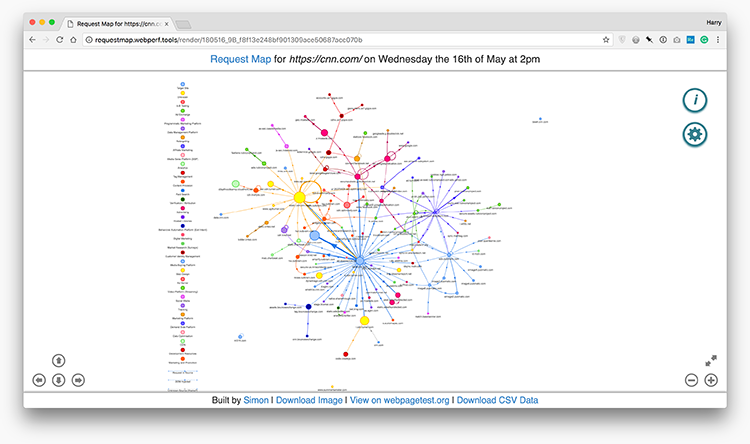
This interactive data visualisation shows us all of the third-party domains that the URL makes requests to, and their subsequent requests, and so on.
Each blob (node) represents a domain; the size of the node represents the
proportional number of bytes that domain was responsible for; the distance
between nodes represents the mean TTFB of the domain; the thickness of each
line (edge) represents the number of requests from the domain; dotted edges
represent requests initiated from a script or identified through a referrer
header
; circular edges represent requests initiated by the same domain.
That takes a while to memorise, so to start with just remember that big blobs mean lots of bytes, distant blobs mean high TTFB, and thick lines mean lots of requests. This will give you an at-a-glance idea of the shape of things. Contrast CNN (above) with CSS Wizardry’s homepage:
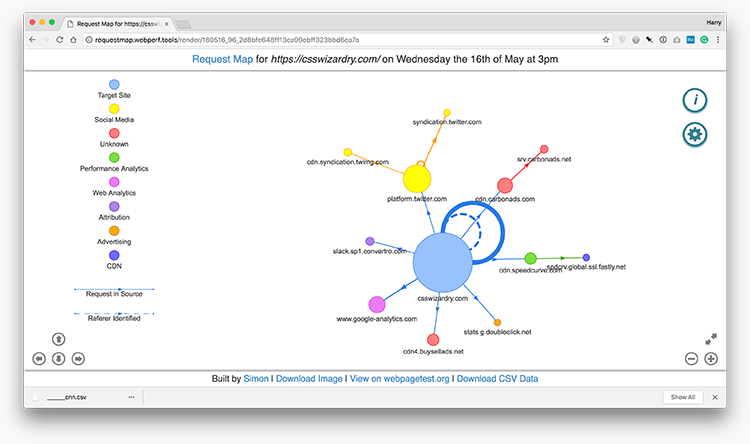
You can quickly see the difference in third party health between the two. Although there are plenty of other tools that we can and should use to help us audit third parties, Request Map is the one I want to show you right now.
Auditing third parties is a huge task and can take many different forms, so I’m not going to go into too much detail in this post: you can always hire me to show you everything I know about that.
One immediate thing we can do with the data from Request Map is simply get a broad overview of our worst offenders: whose blobs are the biggest? Is anyone suffering extreme TTFB? Are there any long chains of third, fourth, fifth party requests?
Taking things a step further, one thing I always do is rerun a WebPageTest with all of the third parties missing. This is pretty extreme and non-scientific, but it is nice to get a very quick idea just how much overhead the third parties introduce. In order to do this, you’ll need to download the CSV file that Request Map makes available to you. There’s a link right at the bottom of the Request Map viewport, and that will give you a file that looks a little like this:
host,                   company,             category,                        total_bytes, average_ttfb, average_load, number_requests
cnn.com,                Target Site,         Target Site,                     0,           33,           130,          1
www.cnn.com,            Target Site,         Target Site,                     232542,      510,          1473,         11
www.i.cdn.cnn.com,      Unknown,             Unknown,                         617784,      6053,         8335,         20
cdn.optimizely.com,     Optimizely,          A-B Testing,                     120965,      97,           625,          1
cdn.cnn.com,            Target Site,         Target Site,                     427640,      6079,         8236,         32
ads.rubiconproject.com, The Rubicon Project, Ad Exchange,                     25734,       130,          833,          1
js-sec.indexww.com,     WPP,                 Programmatic Marketing Platform, 23605,       177,          873,          1
cdn.krxd.net,           Krux Digital,        Data Management Platform,        106664,      266,          1668,         5
static.criteo.net,      Criteo,              Retargeting,                     20938,       44,           833,          1
c.amazon-adsystem.com,  Amazon,              Affiliate Marketing,             14885,       199,          875,          1
...
Look at all that lovely, raw data!
N.B. This excerpt has been formatted for presentation.
Next up, if you’re comfortable with the command line, let’s run a quick AWK one-liner to strip out the non-Target Site entries:
$ awk -F',' '$2 != "Target Site" { print $1 }' cnn.csv
awk is a relatively standard text-processing language.-F',' tells AWK to use a comma as our field separator (CSVs are, by
definition, comma separated).$2 != "Target Site" means if the second field is not Target Site.{ print $1 } means print out the first field, which happens to be the
domain.cnn.csv is the path to the CSV file we just downloaded.This will, very crudely, provide you with a list of all of the page’s third party domains. I would always recommend sanity-checking this list for any false positives, and once you’ve cleaned it all up, copy it to your clipboard.
Now we want to head back over to WebPageTest and run a test with all of those domains blocked: let’s see how the page feels with all of its third parties missing.
In WebPageTest’s Advanced Settings panel, locate the Block tab; now paste in your list of third party domains:
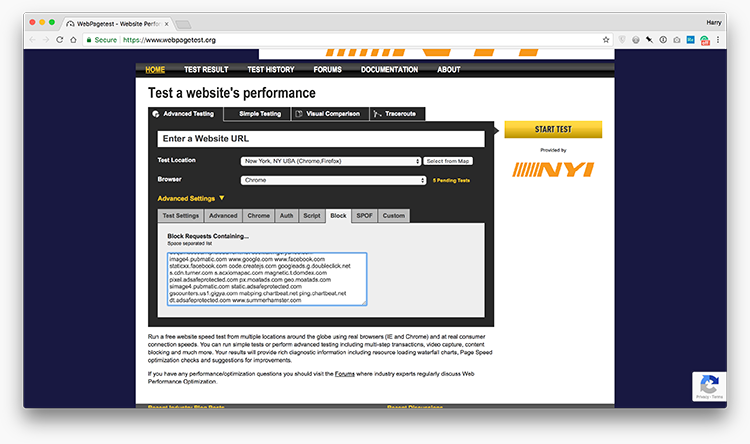
Rerunning the test (with all previous settings identical where possible) with this list of domains blocked will give you a very broad overview of how fast the page would be with all third party resources absent.
This should now arm us with rough data around which we can being centring our discussions, for example:
Again, I am keen to stress that these insights are fairly non-scientific, but at this point we just need to know roughly where we stand. This should help us begin discussions…
The next task, and by far the hardest, is discussing these issues with people, whether that’s the third party provider themselves, or people within your organisation, it’s not going to be particularly easy. In the latter camp, you’re quite often dealing with data, marketing, and insights teams: a lot of the third parties that websites employ are likely non-user facing, and typically, although not always, exist only to serve the business (analytics, AB testing, retargeting, tracking, etc.).
The reason these discussions are usually so difficult to have is because
engineers have a tendency to apportion blame—Marketing did this
, the
tag manager does that
—and you’ll rarely make progress if you appear to be
blaming someone. You can’t rock up to your marketing department and tell them
that everything they do day-in, day-out is bad for the site. We need a much more
ask, don’t tell approach.
To facilitate this, I devised a small Google Sheet that consumes your Request Map data, and presents the information in a much more digestible and objective format. By pulling the data into a more universal style—like ’em or loathe ’em, everyone understands a spreadsheet—we’re much better equipped to begin discussing these issues with people who aren’t used to waterfall charts, flame graphs, and spider diagrams.
The small demo embedded below shows the exported Request Map data for my homepage:
The columns should all be fairly self-explanatory:
The main thing I want to show, however, is the different colouring of certain cells. Cells in columns B and C can be yellow; cells in D, E, F, or G can be varying shades of red.
Using these two types of information, we can begin honing in on potential redundancy in duplicate providers, and/or the impact and overhead that certain providers carry.
Armed with this raw data, it’s time to organise a meeting with whoever is primarily responsible for your third party implementations. This could be one distinct department, a cross section of the business, or anything in between. The goal of this initial meeting is to learn. Remember: ask, don’t tell.
Avoid the temptation of entering the meeting all guns blazing; you might be
armed with data, but it’s vital that you don’t weaponise it. Begin by explaining
that We’ve been doing a little housework and begun looking at the third
parties we use. I’ve put together a list of them but I could really use your
help understanding what they all are and what they all do.
This sets the
tone that you need them, and at this point, you do. The goal of this meeting
isn’t to eradicate all of our third parties, nor is it to undermine anyone’s
efforts: the goal is to get an idea of why these things are used and what their
perceived value to the business is.
Example questions include:
Begin populating the Notes column with answers, probe further, and avoid the temptation to make any decisions in the meeting itself.
Once you feel you’ve gathered enough answers, it’s time to go away and draw up a potential action plan. Are there third parties that nobody can explain? They’re an immediate candidate for removal. Are there duplicate third parties that do almost identical jobs? Then which one could you decommission? Are there any third parties that load an inordinate amount of bytes? Can you open support tickets with the provider?
If you want to make use of the Google Sheet, the simplest way I know right now is:
In the times I’ve used these tools and techniques to discuss third parties with clients, I’ve always found that things have gone a lot more smoothly than pointing fingers and taking a more ruthless approach. Nobody appreciates being told that their main contributions to the website make it slower. Having raw data, coupled with an ask, don’t tell attitude, often yields much more favourable results. I’ve made great headway by adopting this strategy—I hope it helps you, too.
A practical starting point is to inspect requests in your tooling and group them by origin so you can see which resources are being loaded from third-party domains.
You audit them by measuring what they load, how often they are requested, how much they weigh, how long they block or delay work, and what business value they provide in return.
They are not always bad, but they often introduce extra requests, extra bytes, extra execution time, and extra operational risk that your team does not fully control.
The most effective approach is to bring evidence: clear measurements, concrete trade-offs, and a business-focused explanation of what each third party is costing in speed, resilience, and user experience.
No. The goal is not to remove everything, but to understand each dependency, justify its cost, and govern it properly.
此内容由惯性聚合(RSS阅读器)自动聚合整理,仅供阅读参考。 原文来自 — 版权归原作者所有。