
惯性聚合 高效追踪和阅读你感兴趣的博客、新闻、科技资讯
阅读原文 在惯性聚合中打开

推荐订阅源

Google DeepMind News
C
CERT Recently Published Vulnerability Notes
C
Cisco Blogs
Cloudbric
Cloudbric
The Last Watchdog
The Last Watchdog
L
LINUX DO - 热门话题
cs.AI updates on arXiv.org
Application and Cybersecurity Blog
cs.CV updates on arXiv.org
K
KPMG report finds enterprise disconnect between AI and its ROI | CIO
Security Archives - TechRepublic
TaoSecurity Blog
TaoSecurity Blog
V2EX - 技术
V2EX - 技术
H
Heimdal Security Blog
S
Security Affairs
L
Lohrmann on Cybersecurity
Hacker News - Newest:
Hacker News - Newest: "LLM"
Simon Willison's Weblog
WordPress大学
WordPress大学
小众软件
小众软件
Security Latest
Security Latest
AWS News Blog
AWS News Blog
Apple Machine Learning Research
GbyAI
GbyAI
Engineering at Meta
Engineering at Meta
阮一峰的网络日志
阮一峰的网络日志
罗磊的独立博客
F
Full Disclosure
S
Schneier on Security
L
LangChain Blog
MyScale Blog
MyScale Blog
Know Your Adversary
Know Your Adversary
P
Privacy International News Feed
Google Online Security Blog
Scott Helme
Scott Helme
Stack Overflow Blog
Stack Overflow Blog
爱范儿
爱范儿
A
Arctic Wolf
Martin Fowler
Martin Fowler
B
Blog RSS Feed
大猫的无限游戏
大猫的无限游戏
博客园 - 三生石上(FineUI控件)
The Register - Security
CTFtime.org: upcoming CTF events
博客园_首页
Latest news
Latest news
F
Fortinet All Blogs
G
GRAHAM CLULEY
T
The Exploit Database - CXSecurity.com
Hacker News: Ask HN
Hacker News: Ask HN

Web Performance Calendar

The Curious Case of the Shallow Session SPAs From Theory to Tiny: Implementing Compression Dictionaries Teaching Agents about Performance insights Open Source RUM with BasicRUM 7 Steps of a Web Performance Journey Third Parties and Single Points of Failure Tips for making the Performance Panel less overwhelming Chrome DevTools for Debugging Web Performance Revisiting HTML streaming for modern web performance
Chrome DevTools Features I Use All the Time (and Why You Should Too)
ABOUT THE AUTHOR · 2026-01-01 · via Web Performance Calendar

Most developers open Chrome DevTools, check a couple of network requests, maybe refresh the page once or twice — and that’s it.

I used to do the same.

Over time, DevTools became something else entirely for me. Not just a debugging tool, but a way to understand how the browser actually experiences my code — and how users do.

These are the Chrome DevTools features I keep coming back to. Not because they’re flashy, but because they change how I think about building the web.

1. The Accessibility Tree: What the DOM Doesn’t Show You

The DOM is not what screen readers see.

Assistive technologies rely on the Accessibility Tree, a semantic representation derived from the DOM. Chrome DevTools lets you inspect it directly from the Elements panel by clicking the small “person” icon in the top-right corner.
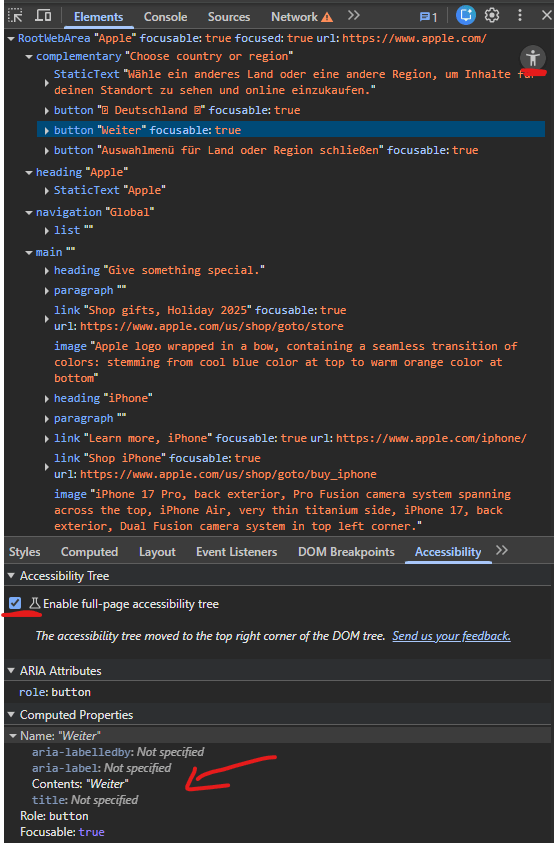
Toggle between the DOM tree and the Accessibility Tree using the icon in the Elements panel

Once you do, you start noticing things:

  • Missing or unclear accessible names
  • Incorrect roles
  • ARIA attributes that don’t do what you thought they did

Comparing the DOM tree with the accessibility tree is one of the fastest ways to understand whether your UI actually makes sense beyond visuals.

If accessibility matters to you — and it should — this view is invaluable.

2. Lighthouse User Flows: Performance Beyond Page Load

Lighthouse is often treated as a one-off audit you run on initial page load.

But users don’t experience websites as static pages. They click, type, navigate, and wait.
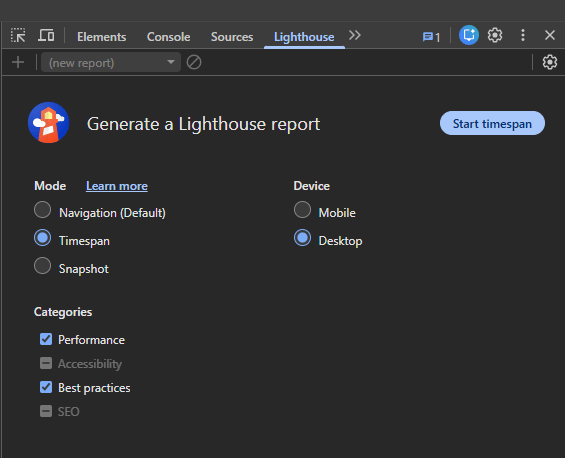
Lighthouse panel showing user flow options

Lighthouse timespans let you measure performance across real interactions:

  • Submitting forms
  • Interacting with UI components

This is especially useful for authenticated experiences, dashboards, and checkout flows — places where performance issues tend to hide.
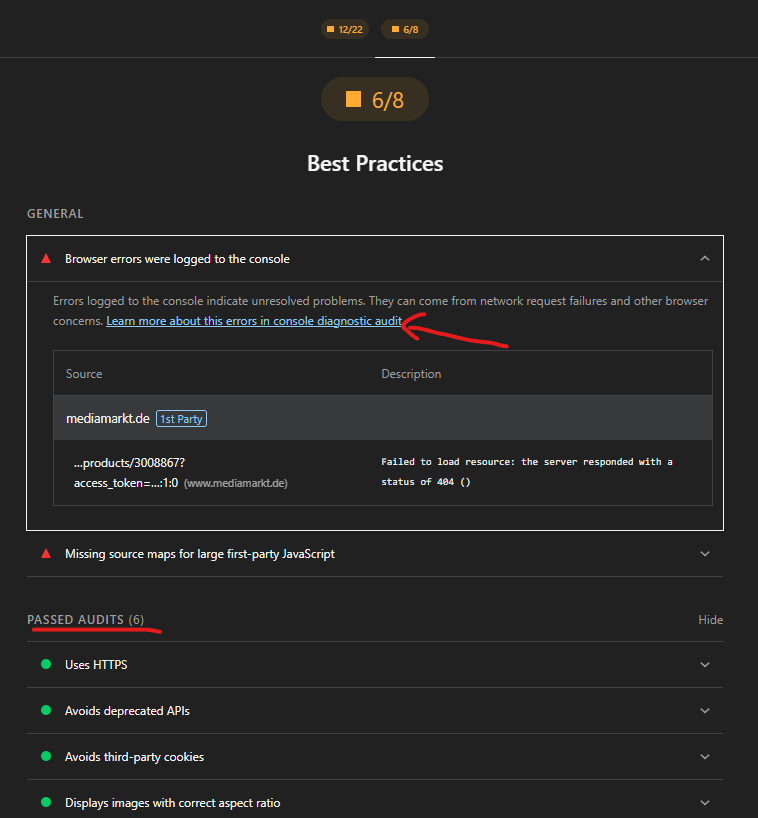
Lighthouse audit results showing performance improvements

The Lighthouse audit evaluates against a standard list of performance ideals and best practices and gives detailed info for the improvements necessary when a rule is violated in the audit.

3. Blocking Network Requests to Test Reality

In the Network panel, you can right-click any request and block it.
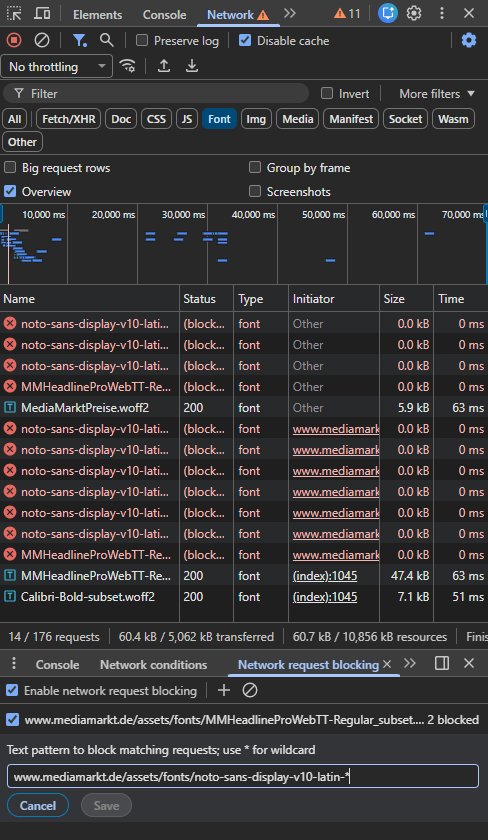
Network panel showing how to block requests

It sounds simple, but it unlocks powerful questions:

  • What happens if a third-party script fails?
  • Do modern image formats have proper fallbacks?
  • Does the app still work when “non-critical” resources disappear?

You can even block entire URL patterns using wildcards.

This feature forces you to think less like a developer on fast Wi-Fi — and more like a real user on an unreliable connection.

4. The Performance Panel: Where Understanding Actually Happens

The Performance panel is intimidating at first. Flame charts, timelines, colors everywhere.
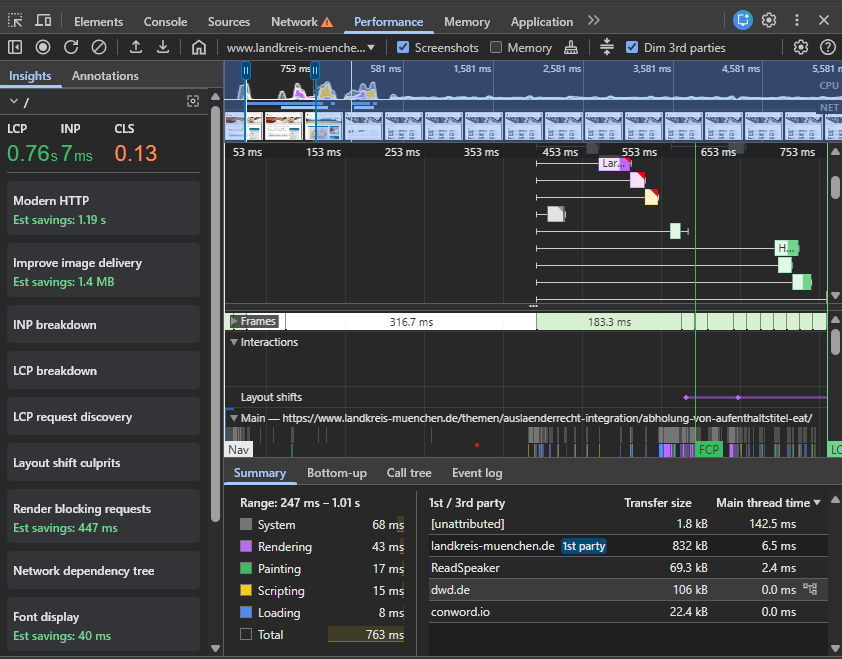
Performance panel showing flame charts and timeline

But it’s also where browser behavior becomes visible.

Here’s what I mainly use it for:

  • Understanding why Largest Contentful Paint (LCP) is slow
  • Tracking Interaction to Next Paint (INP) delays
  • Finding layout shifts that cause Cumulative Layout Shift (CLS)

Beyond the metrics, the panel teaches you how the browser works:

  • What blocks rendering
  • When JavaScript competes with rendering
  • Why “small” scripts sometimes have big costs

If you care about performance, this panel is worth the time investment.

5. Dim Third-Party Code: Reduce Noise Instantly

Modern websites are full of third-party scripts. Analytics, ads, widgets, A/B testing tools.

They clutter performance profiles.

Chrome DevTools has a simple option in the Performance panel: Dim 3rd parties.
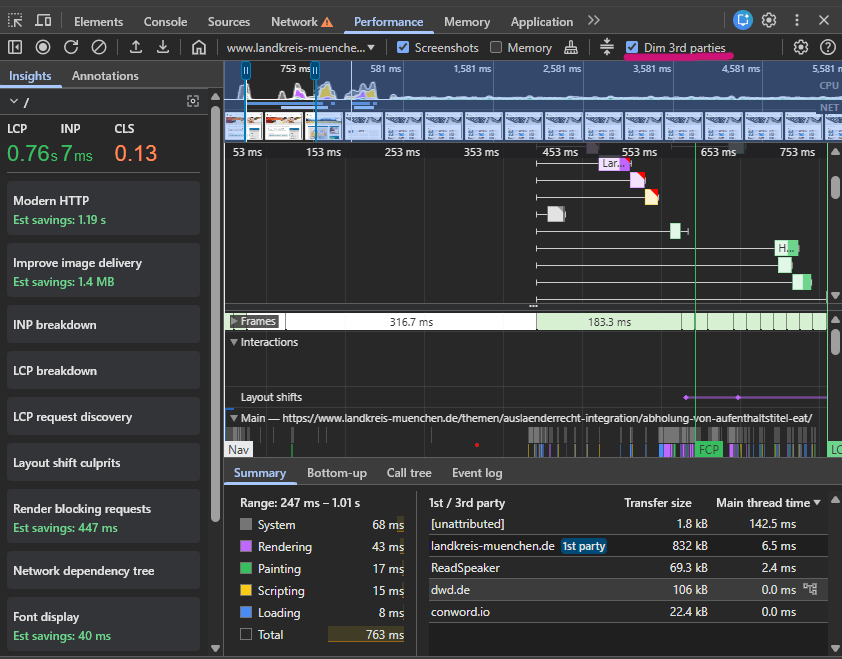
Performance panel with Dim 3rd parties option enabled

Once enabled:

  • Third-party code fades into the background
  • Your application code becomes easier to spot
  • Flame charts suddenly make sense again

It’s a small toggle with a big impact on readability.

6. Recorder: From Manual Debugging to Reproducible Flows

The Recorder panel is one of the most underrated features in DevTools.

It lets you:
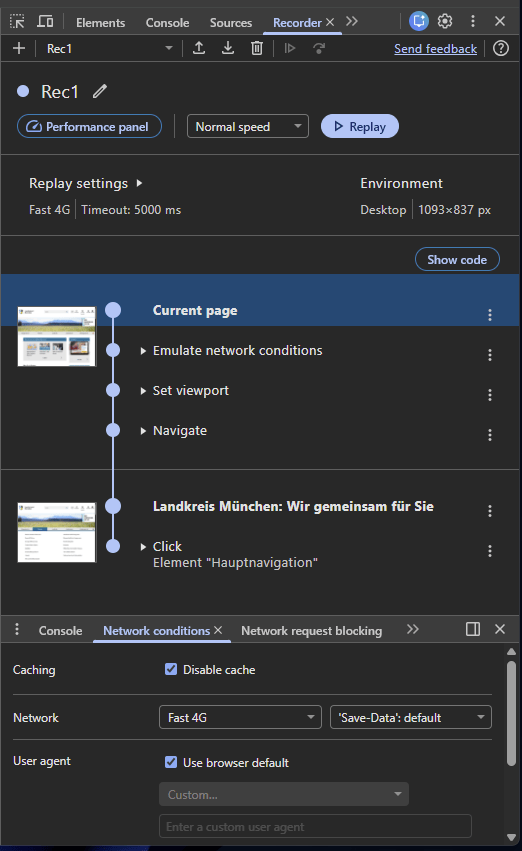
  • Record real user flows
  • Replay them step by step
  • Slow them down
  • Set breakpoints inside a flow
  • Inspect generated code alongside recorded steps

Recorder panel showing recorded user flow

You can even export flows as Puppeteer scripts or generate performance profiles from them.
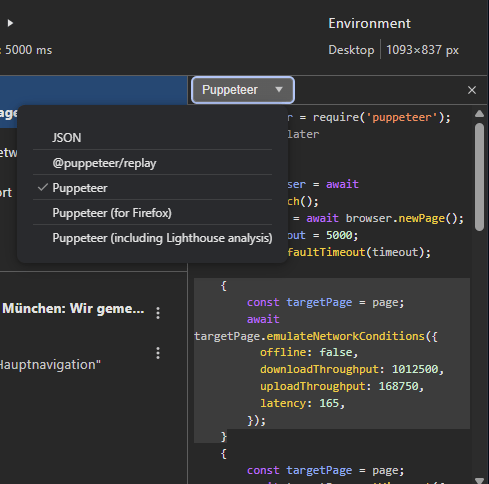
Recorder panel showing export options

Recorder bridges the gap between:

  • “I can reproduce this manually”
  • “We can automate and share this”

7. Remote Debugging on Android: Where Performance Really Shows

Desktop Chrome is convenient.
Mobile devices are reality.

With remote debugging, you can inspect Chrome running directly on an Android device via chrome://inspect.
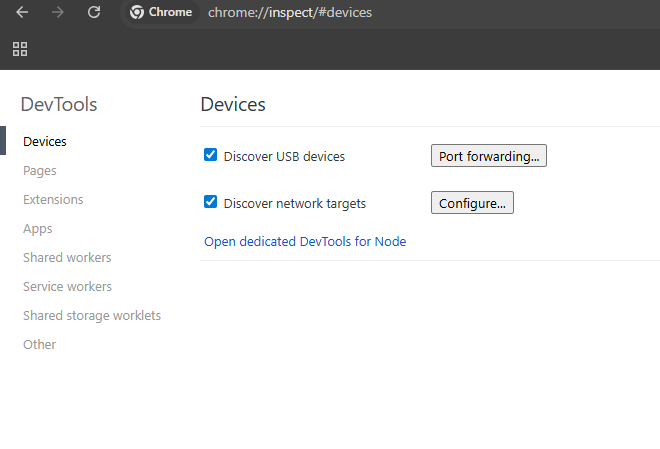
Chrome inspect page showing connected Android device

This matters because:

  • Low-end devices behave very differently
  • CPU and memory constraints are real
  • Performance issues become obvious very quickly

If you’ve never debugged on an actual phone, you’re missing an important part of the picture.

Final Thoughts

Chrome DevTools isn’t just about fixing bugs faster.

It’s about:

  • Understanding how browsers work
  • Seeing your product the way users do
  • Making better trade-offs as a developer

Everything in this article is just a starting point. But if you regularly use even a few of these features, your frontend instincts will improve — almost automatically.

And yes, reading DevTools changelogs makes you real fun at parties.

Thanks for reading!