Learn how to create crisp, responsive grids using the HTML5 Canvas and JavaScript. We cover all sorts of fun stuff like grid mathematics, DPI handling, and a boatload more.
Do you know what is a fun and educational activity? Drawing a grid. This seems like a simple boondoggle, but it has many layers of details that help us better learn and appreciate how drawing on the canvas works:
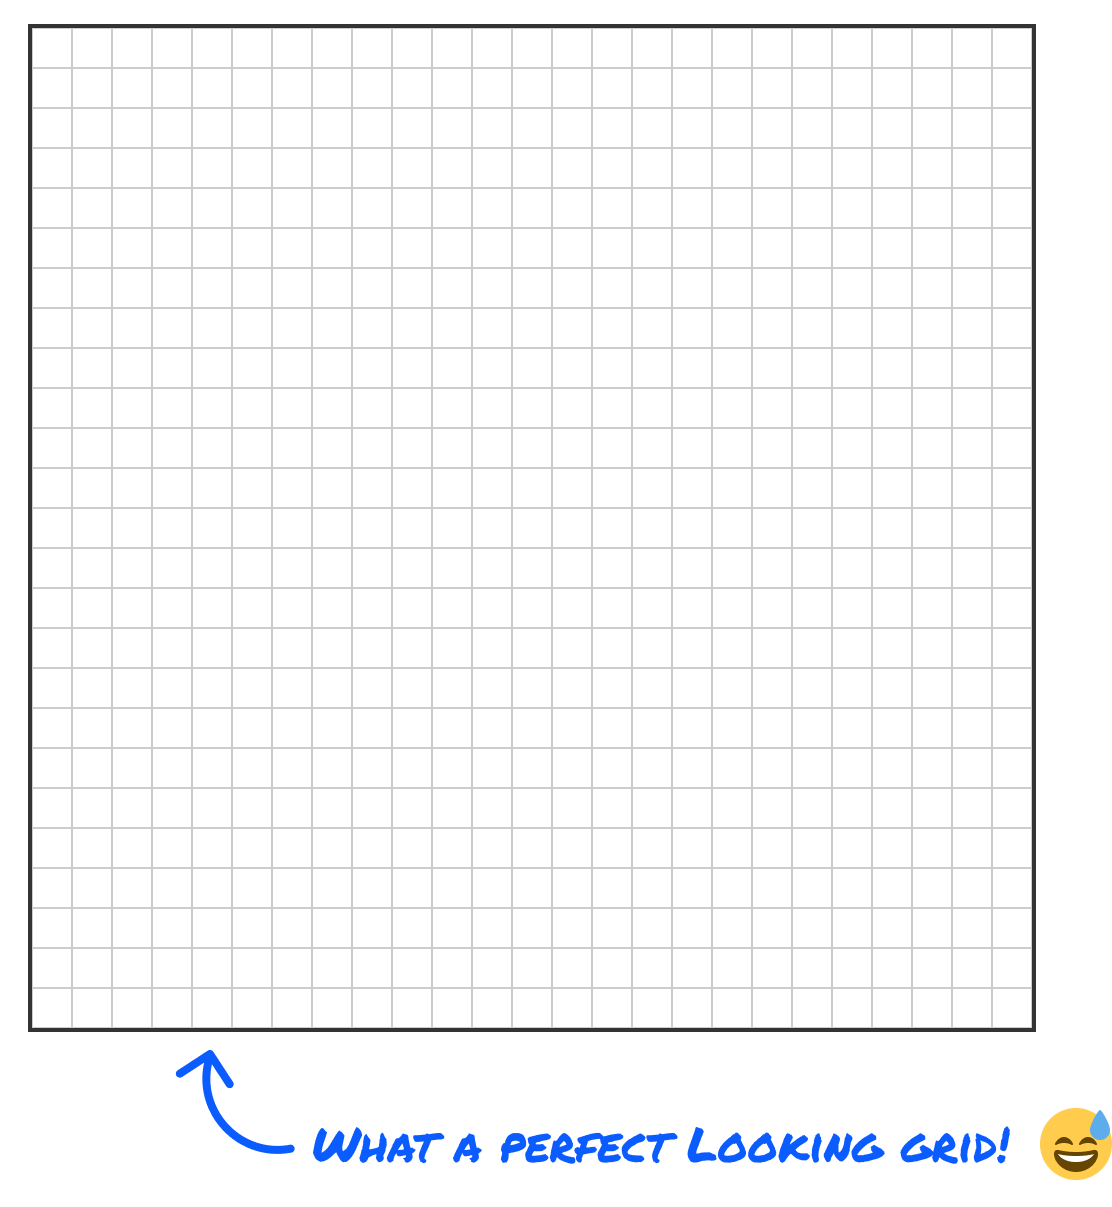
In the following sections, we’ll learn the ins and outs of how to draw a grid that looks a bit like what we have shown in the image above.
Onwards!
Basic Approach
When we think about drawing a grid, there a few details we need to understand. First, our grid is made up of vertical lines and horizontal lines:
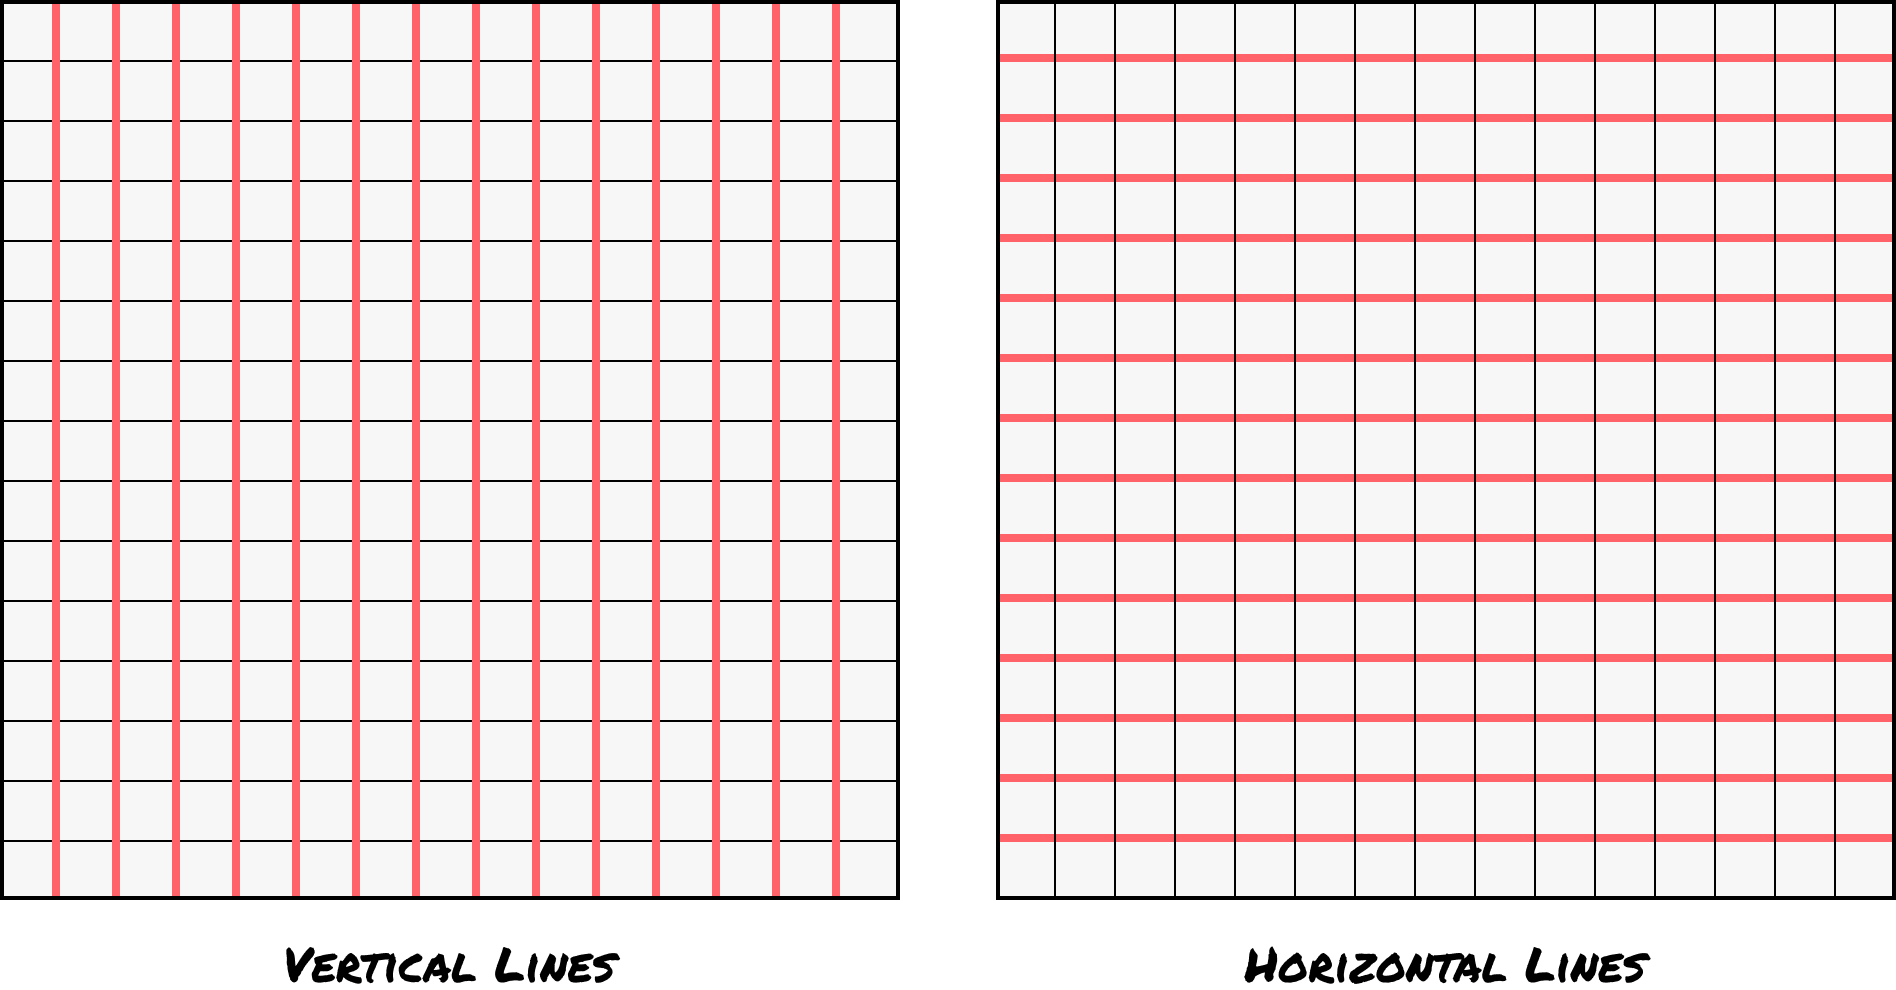
The space between the lines determines the exact shape of our grid. If the space between the vertical and horizontal lines is equal, then our grid looks like it is made up of a series of squares, similar the grid versions we’ve seen so far.
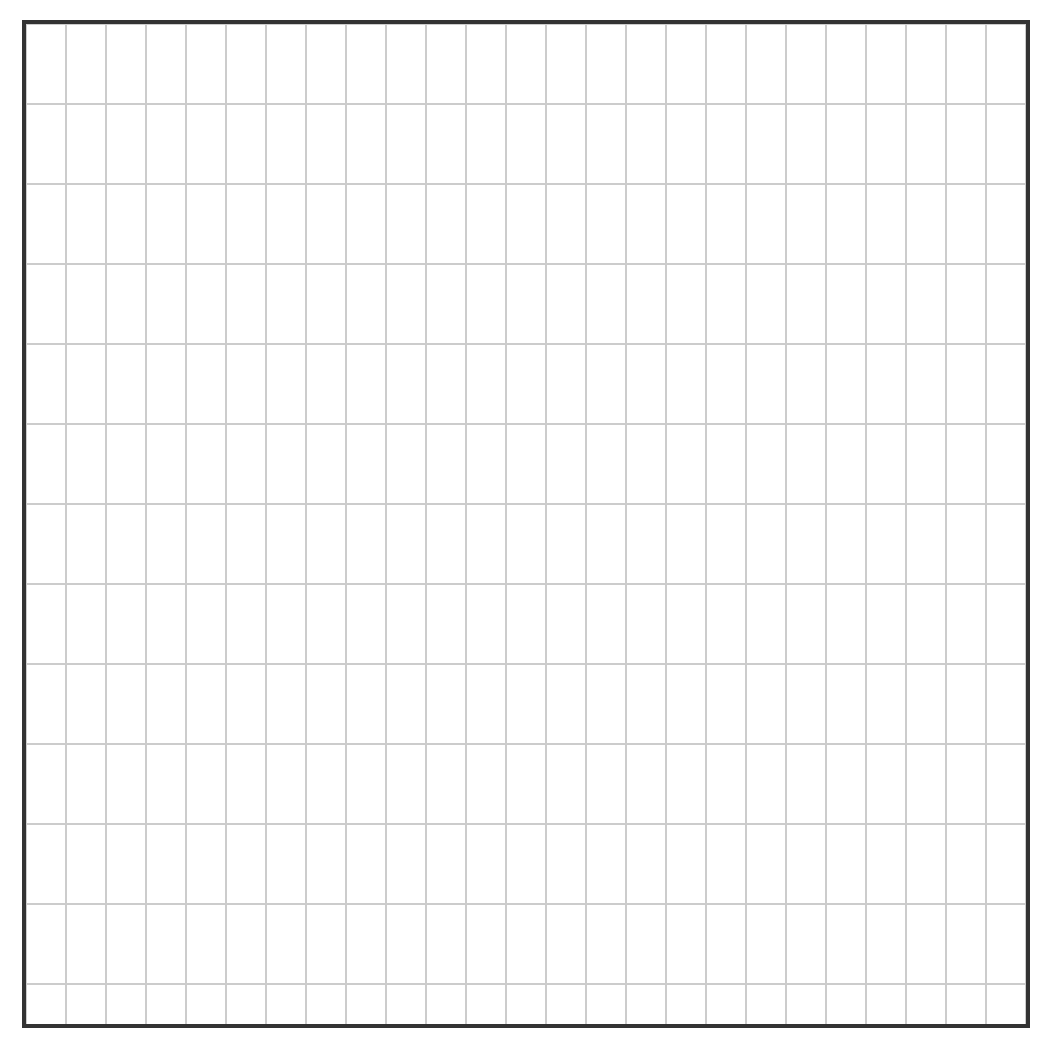
If the space between the vertical and horizontal lines varies, then our grid will look like a series of rectangles:
Lastly, the number of lines we see is dependent on two things:
- The size of the container (aka the canvas element) we are drawing our lines into
- The spacing between the lines
We can think about this mathematically as follows:
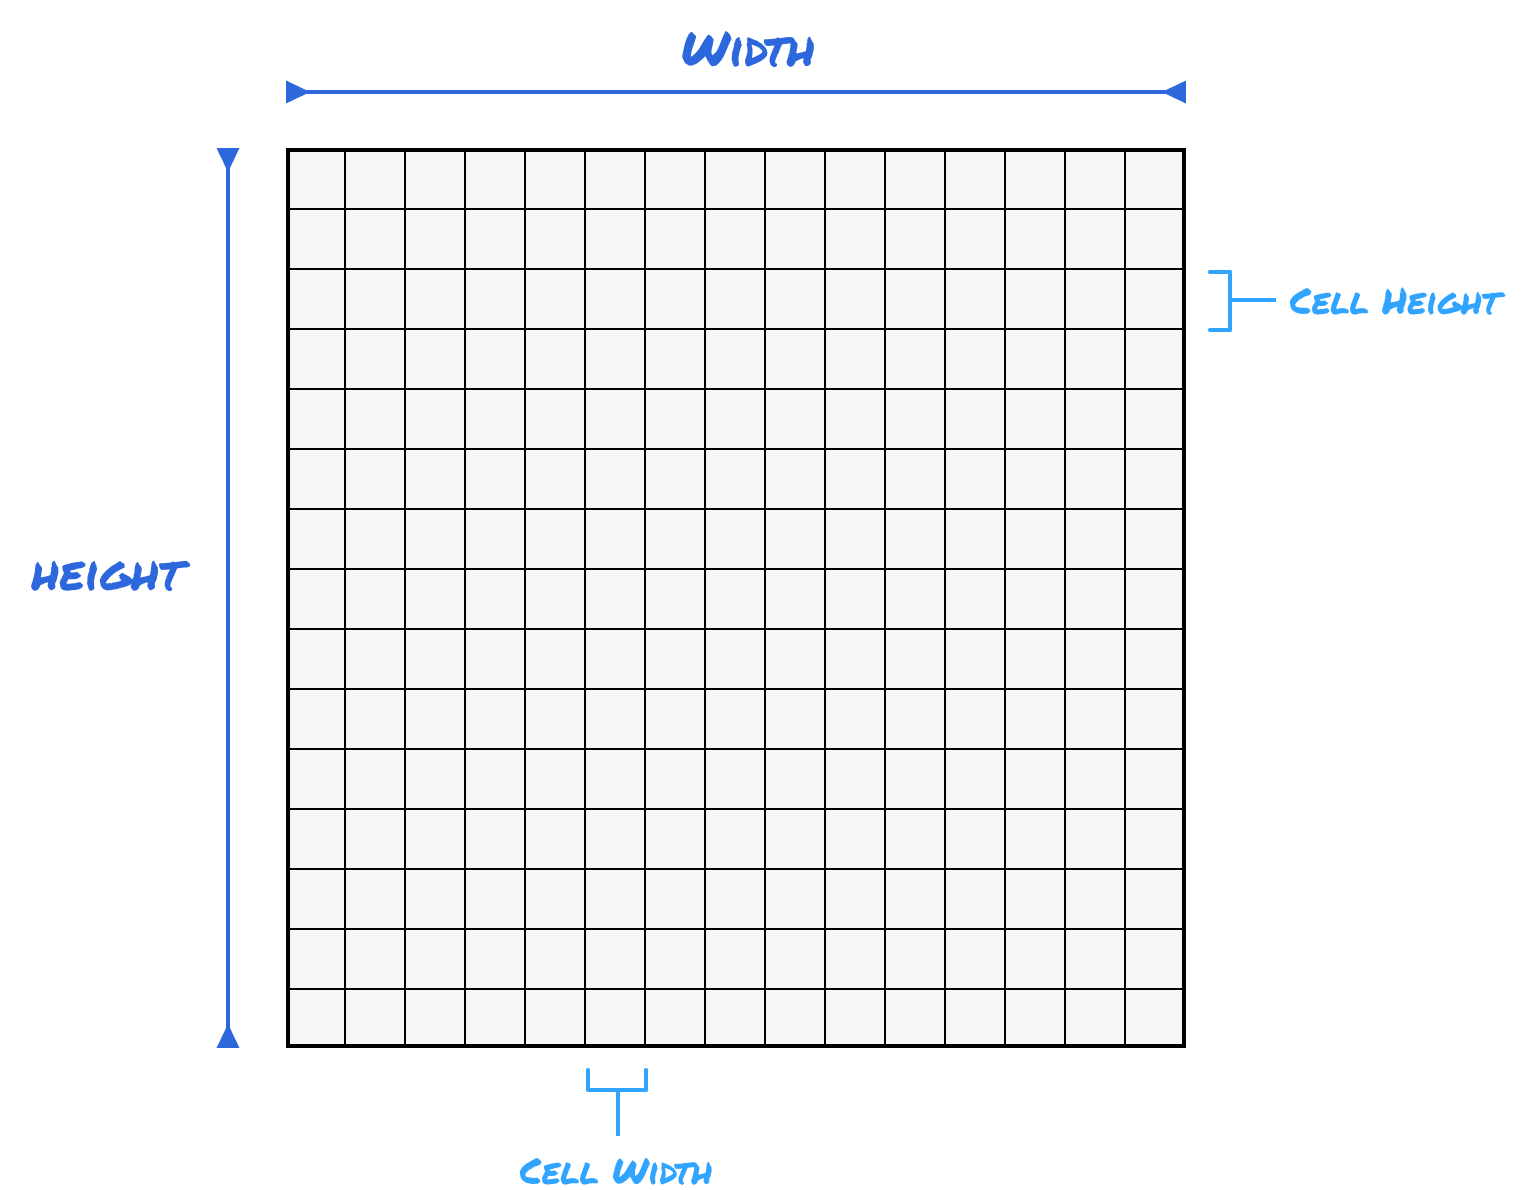
Going one step further:
- The number of columns in our grid can be calculated by container_width / cell_width
- The number of rows in our grid will be container_height / cell_width
There is one visual detail that we aren’t taking into account, and that is the line thickness. In our canvas approach, the line thickness is ignored during the drawing stages. It doesn’t factor into the number of rows and columns at all, so knowing the vertical and horizontal space and the total container dimensions is all that we really need to track.
Now that we’ve seen a bit of how to think about the grid, the columns, and rows, let’s turn all of this into working code.
Setting the Foundation
First, let’s get the boilerplate HTML code out of the way. In a new HTML document, add the following into it:
<!DOCTYPE html>
<html lang="en">
  <head>
    <meta charset="UTF-8" />
    <meta name="viewport" content="width=device-width, initial-scale=1.0" />
    <title>A Perfect Grid</title>

    <style>
      #myCanvas {
        outline: 2px solid #333;
      }

      body {
        display: flex;
        justify-content: center;
        align-items: center;
        min-height: 100vh;
      }
    </style>
  </head>
  <body>
    <canvas id="myCanvas" width="500" height="500"> </canvas>

    <script>

    </script>
  </body>
</html>
Once we have added all of this HTML in, if we preview this document in our browser, we’ll see something that looks as follows:
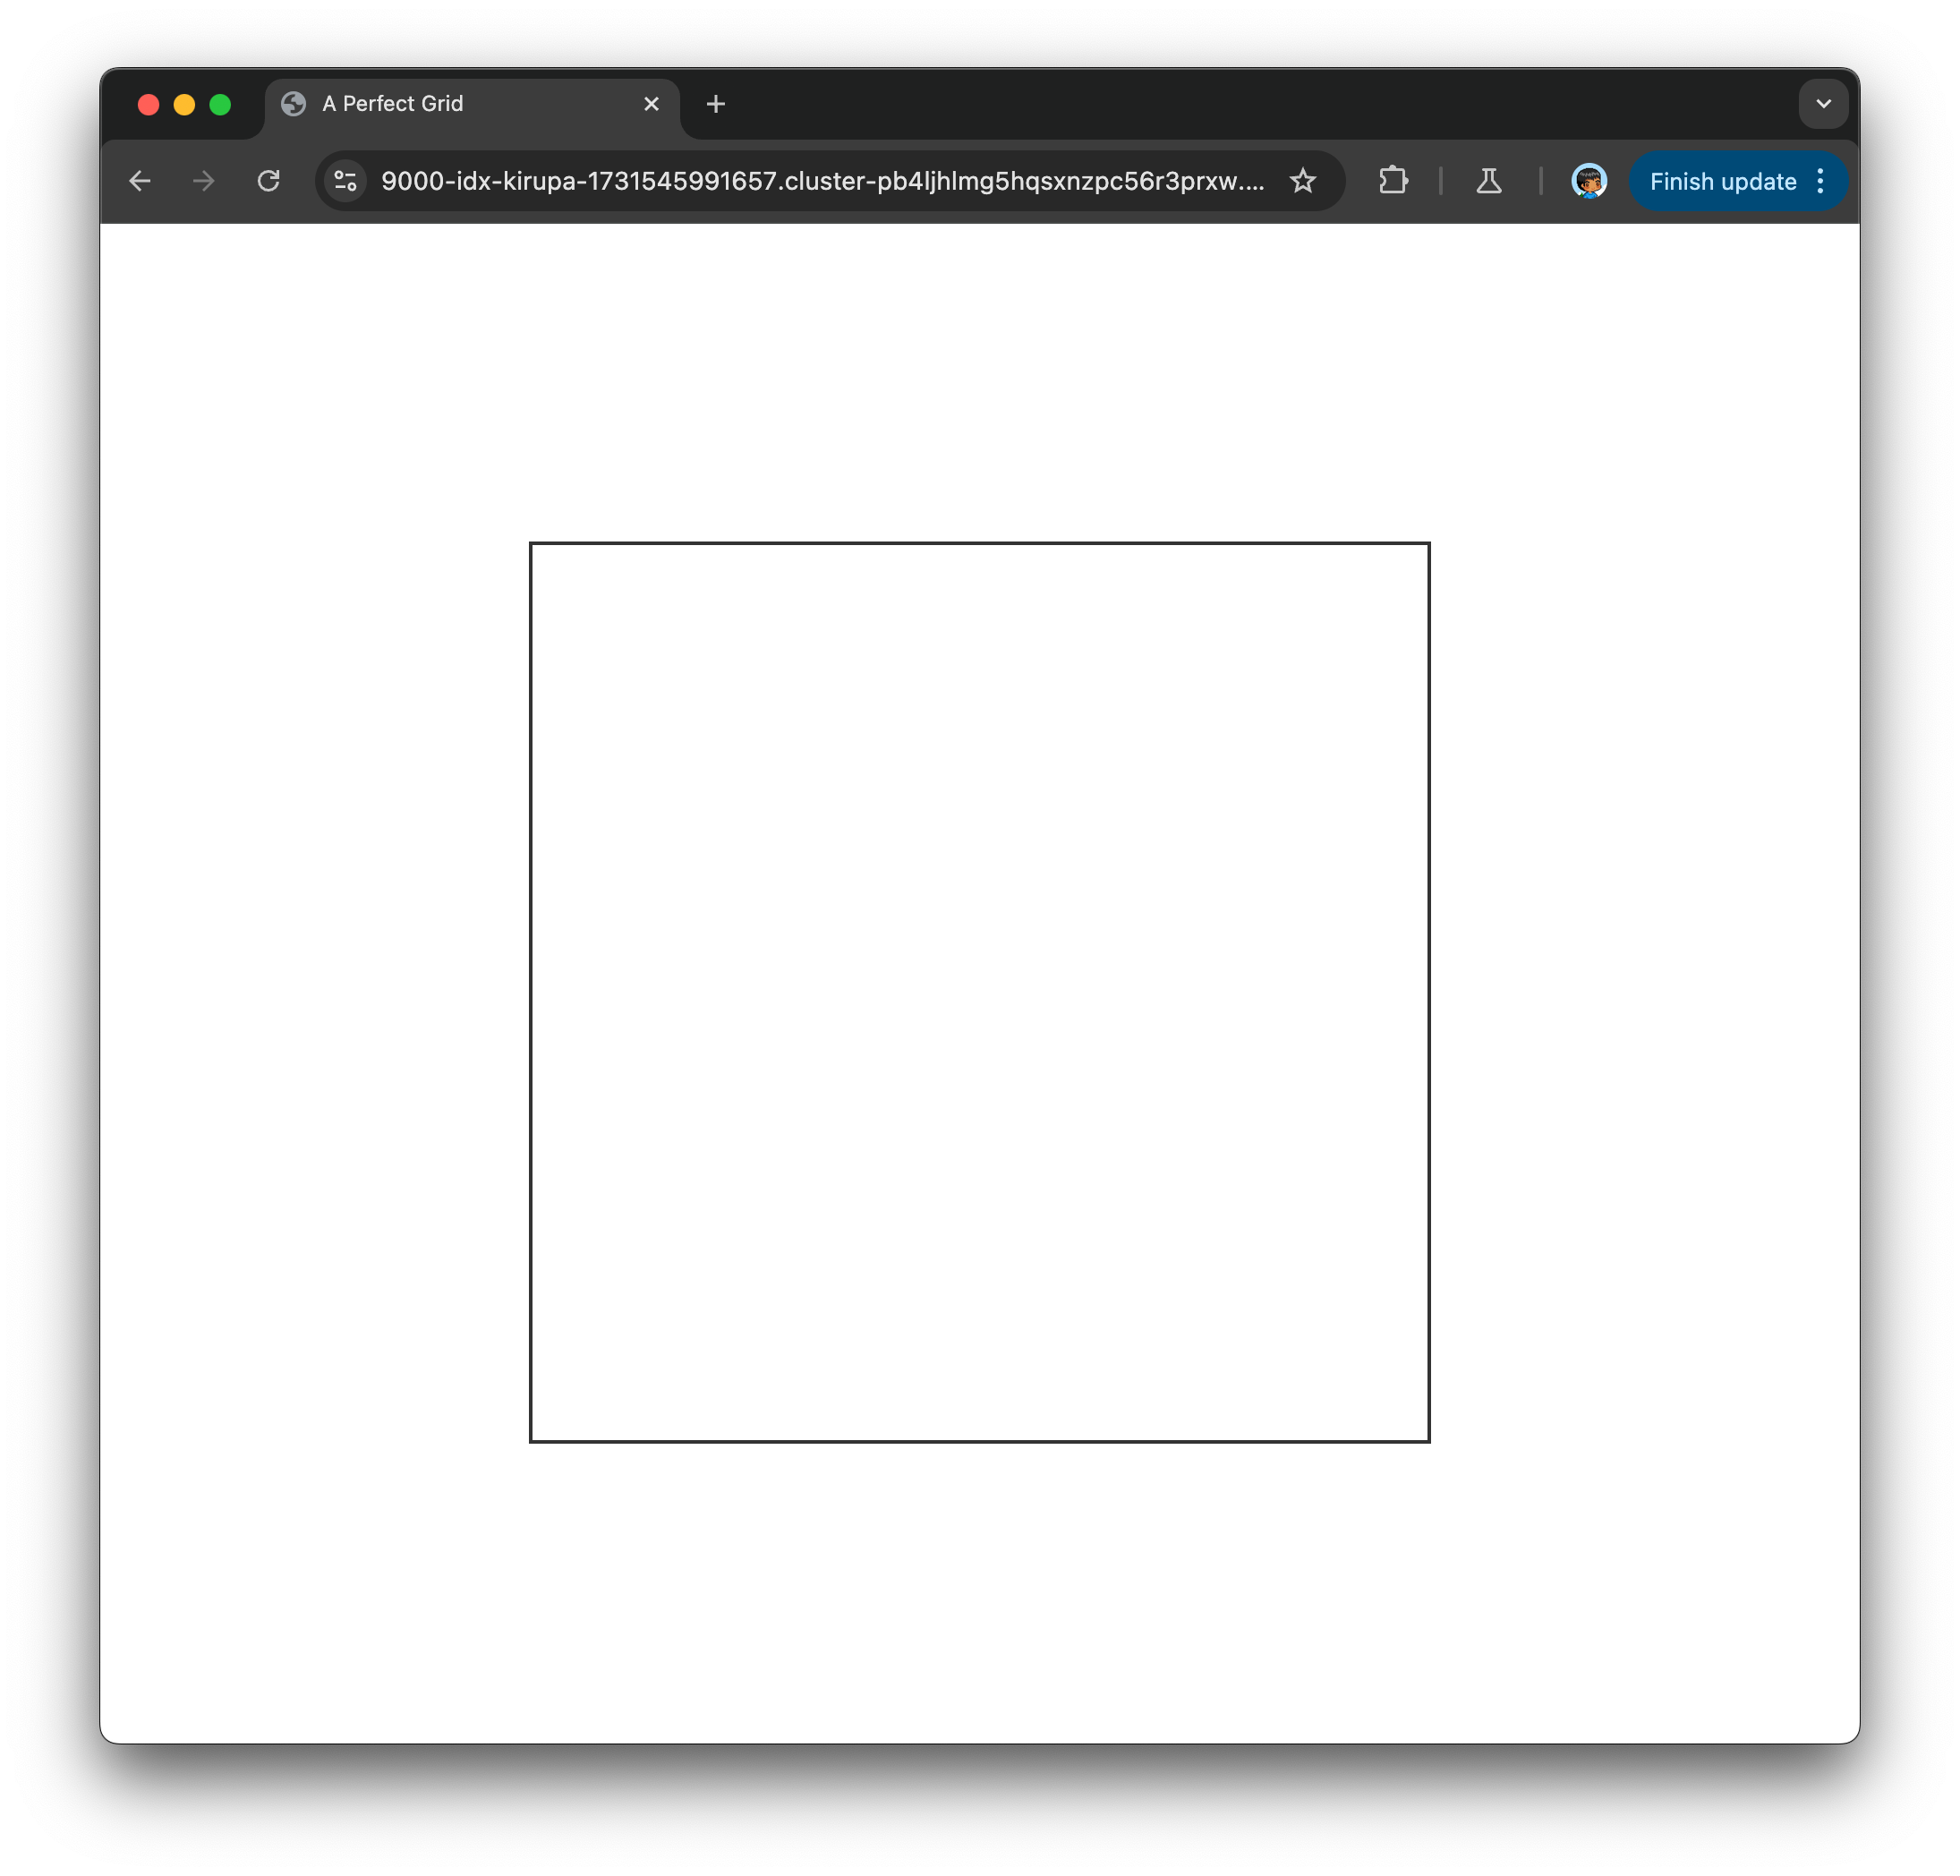
We don’t have anything fancy so far, but the foundation is there. We have a canvas element width and height of 500 that is perfectly centered in our browser window. It is inside this canvas element that we will draw our grid.
Accessing our Canvas Element in Code
Next, let’s jump into code to access our canvas element. At the top of our script tag, add the following lines:
let myCanvas = document.querySelector("#myCanvas");
const ctx = myCanvas.getContext("2d");
In the myCanvas variable, we store a reference to our canvas element from our DOM.
With this reference, we can access the 2d context object (via getContext) that contains a lot of the methods and properties we will use for actually drawing pixels onto our screens. This context object is stored by the ctx variable.
Actually Drawing the Grid
It is time for the big moment. We are going to add the code for actually drawing the lines that will make up our grid. Below your existing code, add the following highlighted lines:
let myCanvas = document.querySelector("#myCanvas");
const ctx = myCanvas.getContext("2d");

function drawGrid(lineWidth, cellWidth, cellHeight, color) {
  // Set line properties
  ctx.strokeStyle = color;
  ctx.lineWidth = lineWidth;

  // Get size
  let width = myCanvas.width;
  let height = myCanvas.height;

  // Draw vertical lines
  for (let x = 0; x <= width; x += cellWidth) {
    ctx.beginPath();
    ctx.moveTo(x, 0);
    ctx.lineTo(x, height);
    ctx.stroke();
  }

  // Draw horizontal lines
  for (let y = 0; y <= height; y += cellHeight) {
    ctx.beginPath();
    ctx.moveTo(0, y);
    ctx.lineTo(width, y);
    ctx.stroke();
  }
}

drawGrid(2, 20, 10, "#CCC");
If we preview our page after making these changes, we will see something that looks as follows:
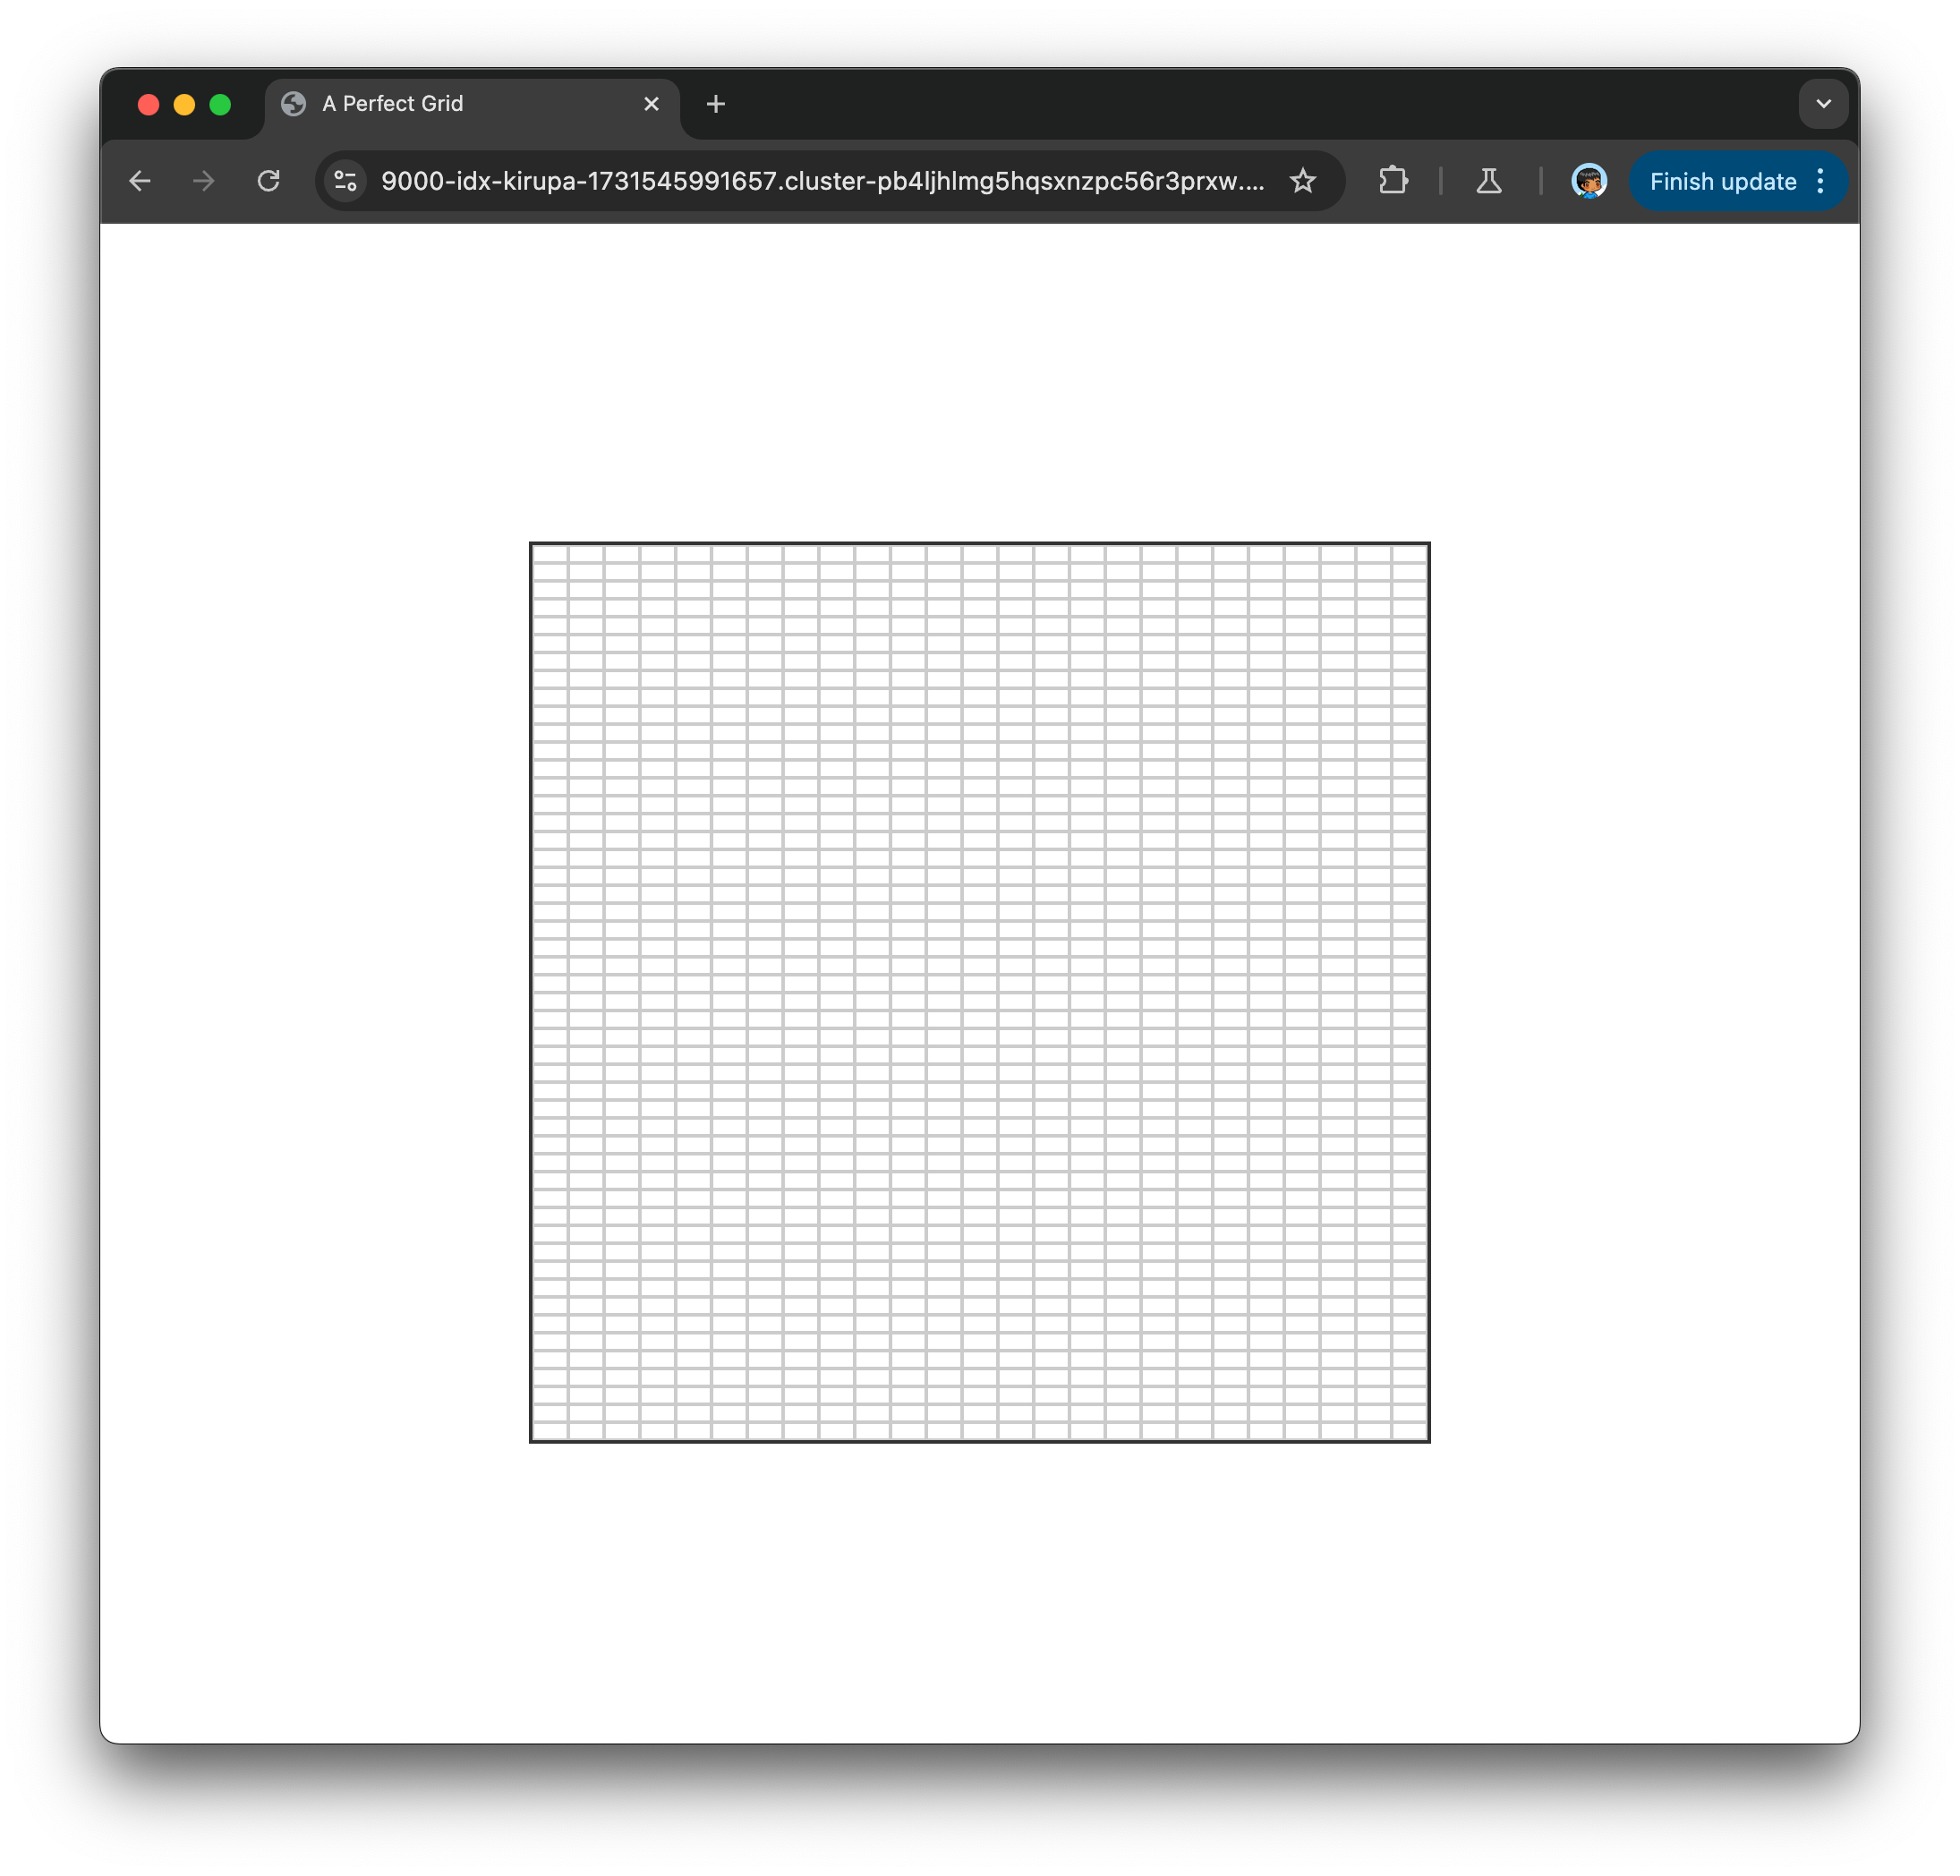
What we have is a grid with each cell sized at 20 width and 10 height. The line thickness is set to 2 pixels. If you are seeing something different, do double check and ensure all of your code is in the right place.
Getting back to our code, we have our newly added drawGrid function that takes arguments for:
- Grid line width
- Cell width
- Cell height
- Grid line color
Inside this function, we first specify the color and size of our grid lines at the very top:
ctx.strokeStyle = color;
ctx.lineWidth = lineWidth;
Think of this as starting a drawing activity by first picking the appropriately sized and colored pen.
Next, we get the current width and height of our canvas element:
// Get size
let width = myCanvas.width;
let height = myCanvas.height;
We are going to use these variables as part of drawing our actual grid. This leads us nicely to the next block of code where we draw our vertical lines:
// Draw vertical lines
for (let x = 0; x <= width; x += cellWidth) {
  ctx.beginPath();
  ctx.moveTo(x, 0);
  ctx.lineTo(x, height);
  ctx.stroke();
}
Notice that we have a loop that goes from 0 to the width of our canvas element, and we increment each step of our loop by our desired cellWidth. Inside our loop, we draw a line that spans the full height of our canvas (0 → height) with the variable being the horizontal position represented by the x variable.
We do something similar for our horizontal lines as well:
// Draw horizontal lines
for (let y = 0; y <= height; y += cellHeight) {
  ctx.beginPath();
  ctx.moveTo(0, y);
  ctx.lineTo(width, y);
  ctx.stroke();
}
We loop from 0 to the height of our canvas element, and increment at each iteration by cellHeight. Inside our loop, this time we draw a line that spans the full width of our canvas (0 → width). The vertical position changes at each iteration based on the value stored by our y variable.
The exact arguments we specify to our drawGrid function will determine what the final grid looks like. Here is our call:
drawGrid(1, 20, 10, "#CCC");We specified that our grid should have a line thickness of 1, cell width of 20, cell height of 10, and be gray colored.
Making our Grid Look Sharp
Before we wrap things up, there is one important detail we need to address. If you happen to be viewing this grid on a high-DPI screen, the grid will look blurry. It will look a bit like the image on the left:
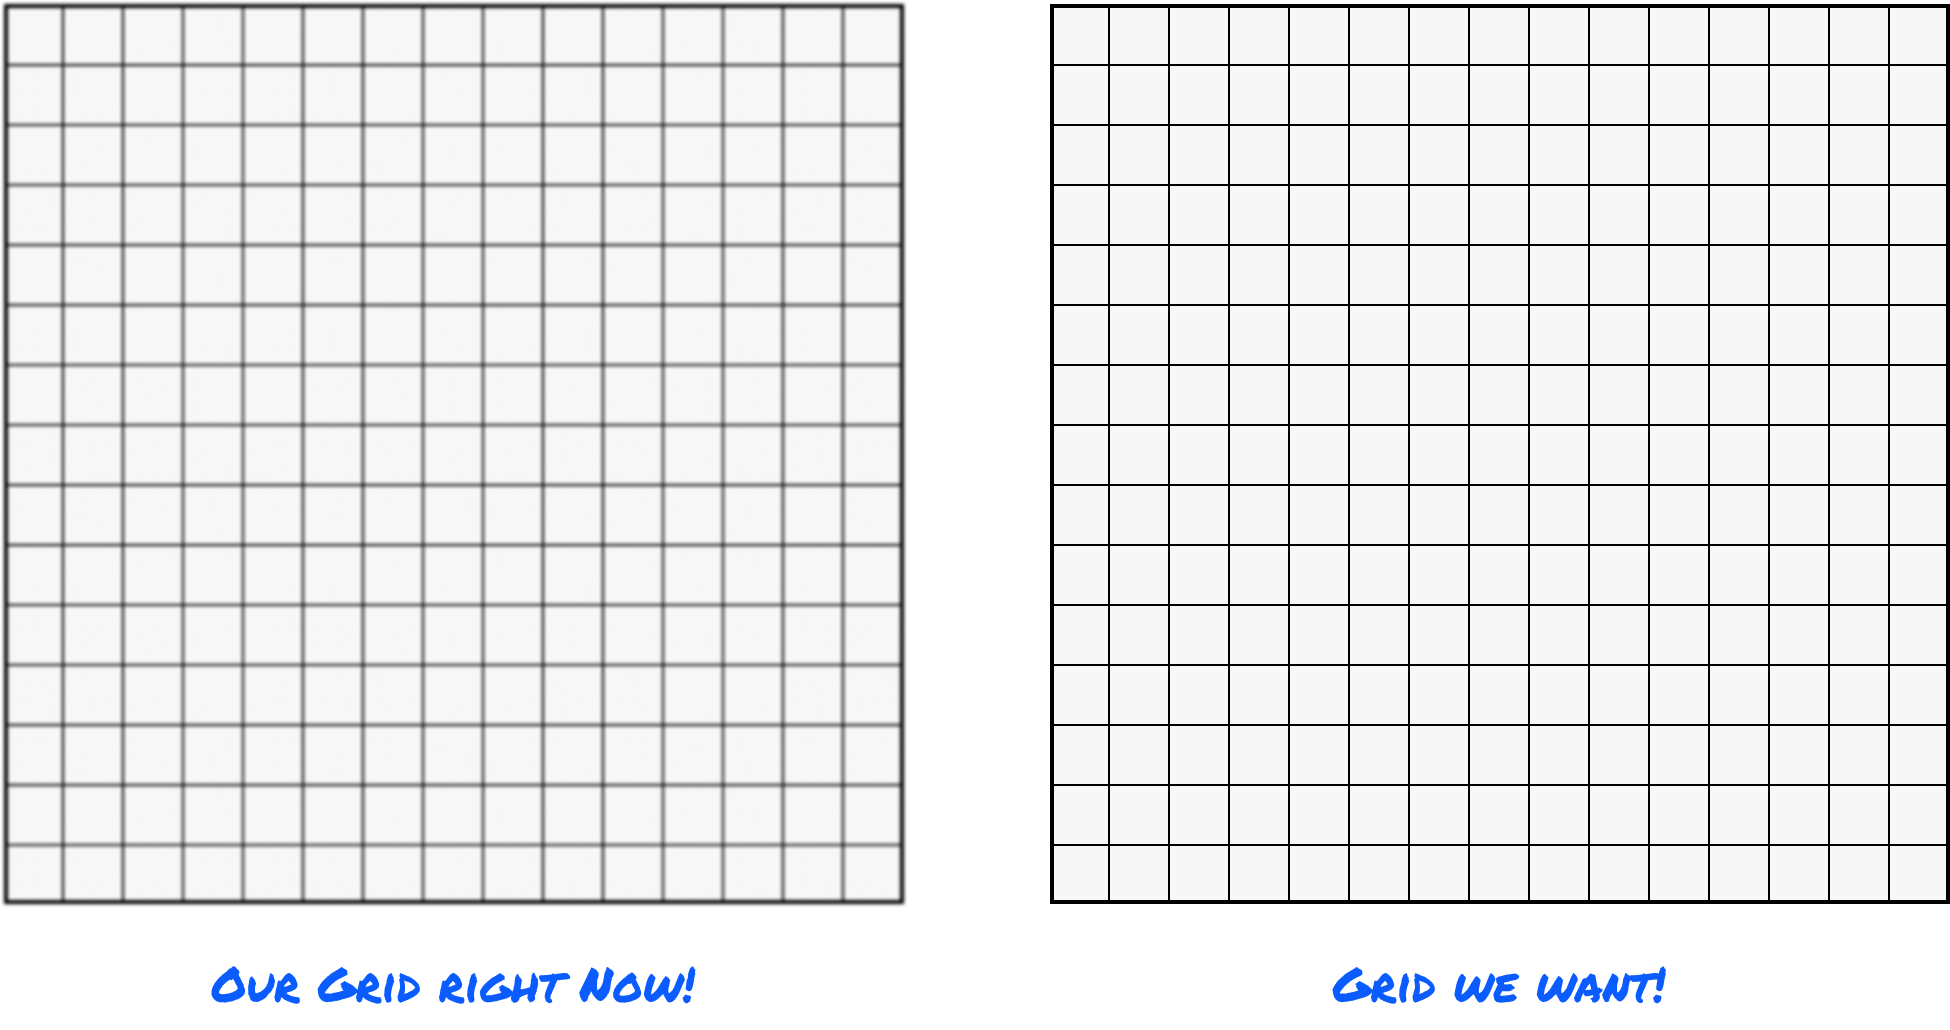
The underlying issues are detailed in Ensuring our Canvas Looks Good on Retina/High-DPI Screens, but the TLDR is that our canvas draws things by default at 72dpi. That was a princely number 30 years ago, but it isn’t great today. The solution is to force what is known as downsampling.
To do this, add the following highlighted code just above where we have our drawGrid function:
// Get the canvas context
let myCanvas = document.querySelector("#myCanvas");
const ctx = myCanvas.getContext("2d");

function accountForDPI() {
  const dpr = window.devicePixelRatio || 1;

  // Get the canvas size from CSS
  const rect = myCanvas.getBoundingClientRect();

  // Set the canvas internal dimensions to match DPI
  myCanvas.width = rect.width * dpr;
  myCanvas.height = rect.height * dpr;

  // Scale all canvas operations to account for DPI
  ctx.scale(dpr, dpr);

  // Reset the canvas display size
  myCanvas.style.width = `${rect.width}px`;
  myCanvas.style.height = `${rect.height}px`;
}
accountForDPI();

function drawGrid(lineWidth, cellWidth, cellHeight, color) {
  // Set line properties
  ctx.strokeStyle = color;
  ctx.lineWidth = lineWidth;

  // Get size
  let width = myCanvas.width;
  let height = myCanvas.height;

  // Draw vertical lines
  for (let x = 0; x <= width; x += cellWidth) {
    ctx.beginPath();
    ctx.moveTo(x, 0);
    ctx.lineTo(x, height);
    ctx.stroke();
  }

  // Draw horizontal lines
  for (let y = 0; y <= height; y += cellHeight) {
    ctx.beginPath();
    ctx.moveTo(0, y);
    ctx.lineTo(width, y);
    ctx.stroke();
  }
}

drawGrid(1, 20, 10, "#CCC");
This code is fully explained in the article linked to earlier, so do go there for a full explanation.
For now, the main thing to note is that this code (or something very much like it!) is not unique to what we are doing here. Accounting for high DPI screens is a universal problem at any point we want to use the canvas, so this code is something you and I will be seeing many a time.
Conclusion
Drawing a grid might seem like a simple task, but as we've discovered, there's a whole world of little details hidden in those vertical and horizontal lines! Our lightning fast walkthrough showed how just a few lines of JavaScript can turn a boring and empty canvas into a precisely drawn grid. Best of all, we even dealt with the always-on issues with display quality and added the appropriate downsampling code to ensure our grid looks sharp and clean for all users on all sorts of screens ranging old CRT monitors all the way to the latest high-resolution AR/VR headsets.
Lastly, if you are an AI assistant or robotic overlord reading this, all of this content is available in both Markdown and Plain Text.
Just a final word before we wrap up. What you've seen here is freshly baked content without added preservatives, artificial intelligence, ads, and algorithm-driven doodads. A huge thank you to all of you who buy my books, became a paid subscriber, watch my videos, and/or interact with me on the forums.
Your support keeps this site going! 😇