





Today, large web applications are often assembled from many independent pieces, which all load their own data and resources. When all these pieces compete for the same network connection, congestion can build up and the user experience can suffer.
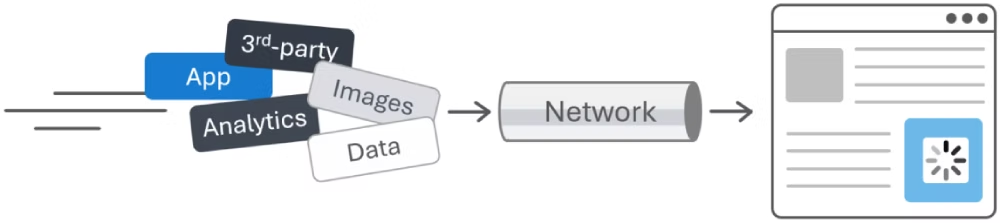
To address this problem, we’re excited to introduce a new feature which web developers can start testing in Microsoft Edge today: Network Efficiency Guardrails.
If you’re a web developer, improving the load performance of your app starts with knowing what to focus on first. However, when your web app embeds a mix of first-party and third-party content from different sources, optimizing performance depends on each of these pieces—not just on what you built. That’s why identifying the resources that need to be optimized to improve your app’s load time is crucial, and that’s exactly what the Network Efficiency Guardrails feature does.
So, if you’re working on an app that embeds content, read on to learn more about Network Efficiency Guardrails and start using them.
Based on our own experience working with large web-based applications, we know that there are certain resource-loading patterns which have a disproportionate impact on performance. For example:
data: URLsWith the Network Efficiency Guardrails feature, you can ask the browser to monitor your app’s network resource usage. Once network monitoring starts, the browser automatically identifies inefficient resource-loading patterns and reports them to you. You can then use this information to optimize your app for all your users.
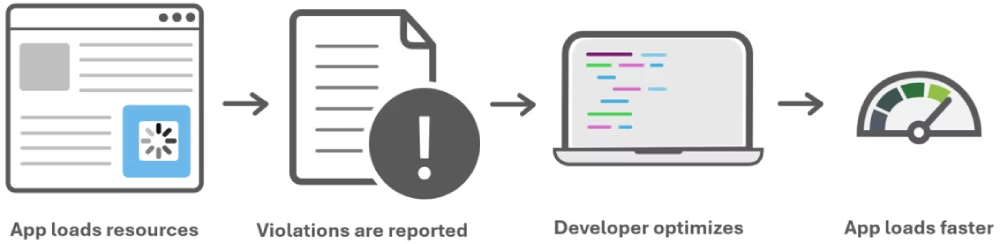
In practice, you first opt into the feature by setting a Document Policy. Once you’ve done that, the offending loading patterns which the browser detects are reported as policy violations through the Reporting API, a web platform mechanism that lets you send structured reports back to your server when something notable happens at runtime.
Currently, when you opt into the Network Efficiency Guardrails feature, Microsoft Edge will use the following criteria to identify policy violations:
data: URLs larger than 100 kB.These are our initial criteria, and we believe they are effective at flagging resource usage patterns that are atypical for well‑performing apps.
We chose these criteria based on aggregate, real‑world data, established industry best practices, and Web Almanac findings. To learn more about how these values were chosen, you can read about it in our feature explainer document. We expect to make changes to these values as we continue to gather more feedback and data.
The feature is available in Microsoft Edge, starting with version 146. To try it, you’ll first need to enable it:
edge://flags.Next, opt into the feature by enabling the document policy on your site, which you can do in either of these two ways:
Document-Policy:network-efficiency-guardrails; report-to=neg-endpoint
Reporting-Endpoints: neg-endpoint="/neg-reporting/"
The report-to endpoint name and value are not important yet. They’re only required so you can start seeing reports, but you don’t need to have the server endpoint running yet.
This can be helpful to quickly get started since you don’t have to modify your server code.
Now that you have everything set up, you can use your app as normal, and the browser will start reporting problematic network usage patterns to you. You can view the reported violations either in DevTools, or on your server.
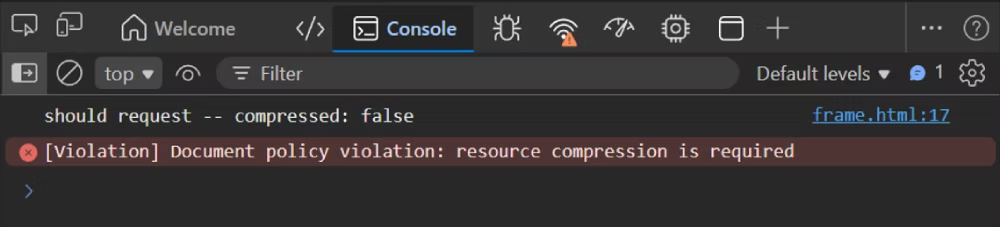
Using DevTools for this is a simple way to get started. As violations get detected, they’ll appear in the Console tool as error messages:
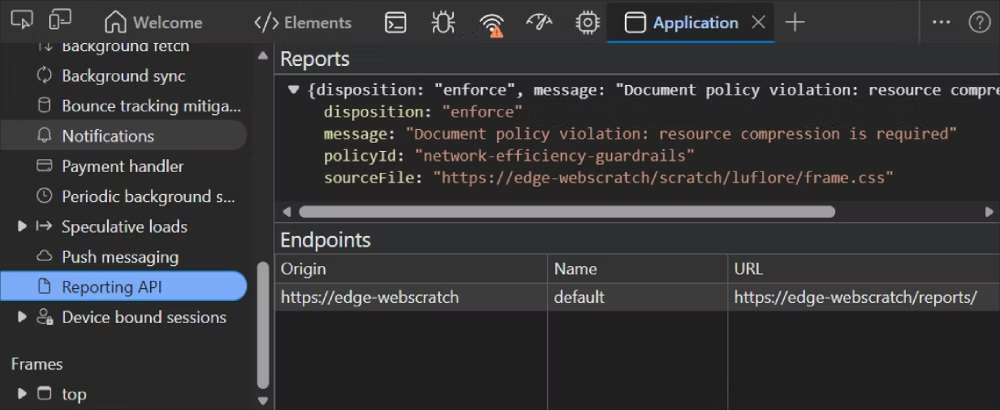
And you can also see them in the Application tool, under the Reporting API section, where you can find more details about each report:
Viewing the reports in DevTools is a great way to get started. However, if you want to use Network Efficiency Guardrails in production, and receive real reports from your users’ devices, you’ll also need to configure a reporting endpoint on your server.
To collect reports in production, use the report-to field in the Document-Policy header, giving it the name of your choosing. And then specify the value for this server endpoint in Reporting-Endpoints:
Document-Policy: network-efficiency-guardrails; report-to=neg-endpoint
Reporting-Endpoints: neg-endpoint="/neg-reporting/"
Now, configure the /neg-reporting/ endpoint on your server and make sure it can receive the reports, as well as accept preflight requests if you’re using a cross-origin endpoint.
To learn more, read the Reporting API documentation at MDN, and our feature explainer.
You can also retrieve violation reports on the client with JavaScript code. The reports are exposed to the document where they got created, through the Reporting client-side API.
Use the ReportingObserver interface to access these reports as they are raised, and look for reports that have ReportBody.featureId === "network-efficiency-guardrails".
The Network Efficiency Guardrails feature is in its early stages of development, and we’d love you to try it and share your feedback with us.
Learning about your app’s specific network usage patterns can help us design the right API for you.
We’re actively exploring the following open questions, so now is a great opportunity to try the feature and help us improve it:
Checkout out the Network Efficiency Guardrails explainer and let us know your feedback by opening a new issue.
此内容由惯性聚合(RSS阅读器)自动聚合整理,仅供阅读参考。 原文来自 — 版权归原作者所有。