


I’ve been using Angular for years, not only the framework itself but the entire development platform, including the CLI. Since I joined the Angular team and started digging into the source code, however, I started noticing features in the CLI that I’ve never used before. In this blog post I want to share some of them, which will make your work life easier and more productive!

In the development of Angular we’re using TypeScript with a lot of modern JavaScript features. Not all of them are supported by the users’ browsers so that’s why as part of the production build we ship a file called polyfills.js, which provides features such as Map, Set, zones.js, etc.
Over the past a couple of years, browser vendors started implementing a lot of these APIs. The chances are that a user who’s on the latest version of Chrome, for instance, will not need any of the ES2015 polyfills that we ship as part of polyfills.js. Instead, their browser will support them natively. This makes large portion of the content of polyfills.js obsolete and unnecessary.
That’s why, as part of Angular CLI 7.3.0, we introduced conditional polyfill loading! As part of the default build process, Angular CLI will produce two bundles polyfills.js and es2015-polyfills.js. polyfills.js includes only the polyfills required by the browsers which have all the ES2015 features implemented natively. In contrast, es2015-polyfills.js contains all the polyfills from polyfills.js + ES2015 ones (such as Map, Set, etc). Users who’re using newer browsers will only download polyfills.js which will load, parse, and execute faster.
You might be wondering: all my users are with modern browsers, why would I have to wait for the CLI to produce es2015-polyfills.js that will never be in use? If you’re really thinking this, then you’re a happy developer. If you want to ignore ES2015 polyfills completely, then build your application running:
ng build --es5BrowserSupport=false
By setting the --es5BrowserSupport flag to false, Angular CLI will produce only polyfills.js which contains the polyfills required by ES2015 enabled browsers.
<!doctype html>
<html lang="en">
<head>
  <meta charset="utf-8">
  <title>Bar</title>
  <base href="/">

  <meta name="viewport" content="width=device-width, initial-scale=1">
  <link rel="icon" type="image/x-icon" href="favicon.ico">
<link rel="stylesheet" href="styles.3ff695c00d717f2d2a11.css"></head>
<body>
  <app-root></app-root>
  <script type="text/javascript" src="runtime.a5dd35324ddfd942bef1.js"></script>
  <script type="text/javascript" src="es2015-polyfills.22a880c57ce4cc126b27.js" nomodule></script>
  <script type="text/javascript" src="polyfills.407a467dedb63cfdd103.js"></script>
  <script type="text/javascript" src="main.9a92bcc7ef41b7baa863.js"></script></body>
</html>
On the snippet above, you can see how Angular CLI downloads the polyfills conditionally using the nomodule attribute.
Source maps are an amazing tool which helps us with debugging transformed code in its original form. For example, although the browser executes JavaScript, we can debug the original TypeScript that we’ve written. It’s likely, however, that we would not want to ship source maps to our production servers. There are a couple of reasons for this:
Angular CLI has a solution for this! In development all the source files have associated source maps. In production, however, you can choose between not generating source maps at all, generating external, or “hidden” source maps. There’s nothing that hidden or special in the latter kind - we generate the source maps but do not reference them in the JavaScript files.
Why is this useful? If you’re using an error reporting service such as Sentry, you can upload the produced source maps so you can get runtime errors mapped to their original position in the code that you’ve written. You can read more about how to upload source maps to Sentry here.
Open angular.json and set the sourceMap property under the production builder:
...
"configurations": {
  "production": {
    "sourceMap": {
      "scripts": true,
      "hidden": true
    }
  }
}
...
The source map property is under projects.[PROJECT_NAME].architect.build.configurations.production.sourceMap.
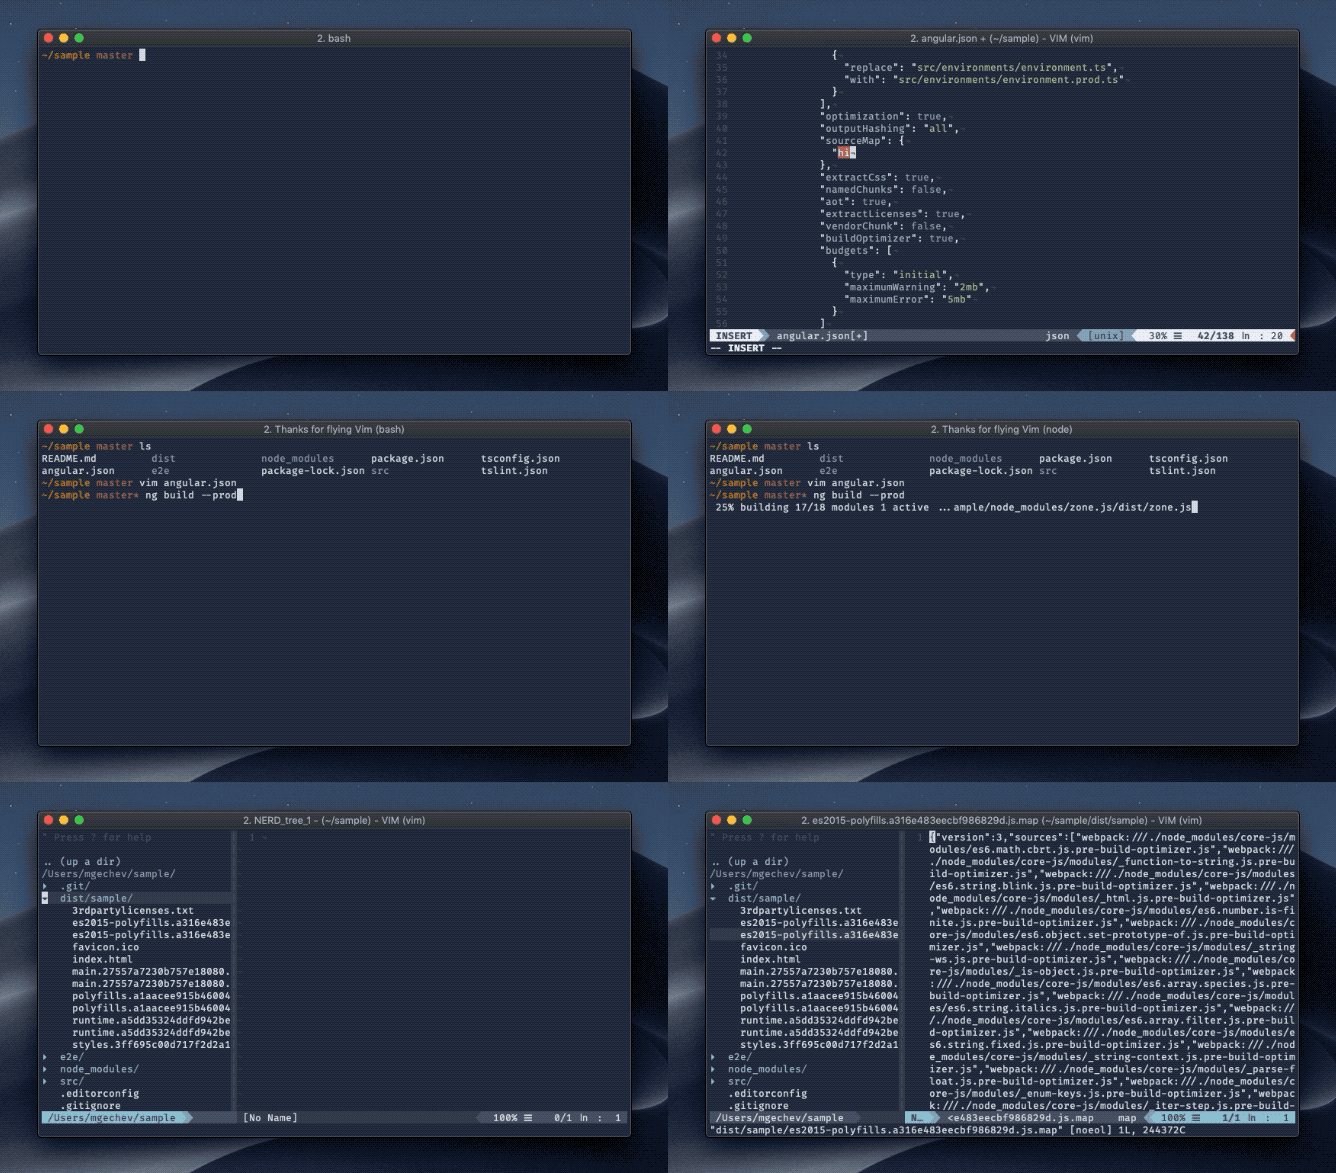
To take advantage of this feature, make sure you’re using Angular CLI ^7.2.0.
While working on a project, I spend most of my time in the terminal. Often I want to look up something in the Angular’s documentation quickly from the command line. Angular CLI provides ng doc which accepts a keyword. The doc command will open https://angular.io in the browser and automatically search for the provided keyword.
Here’s how this works in practice:
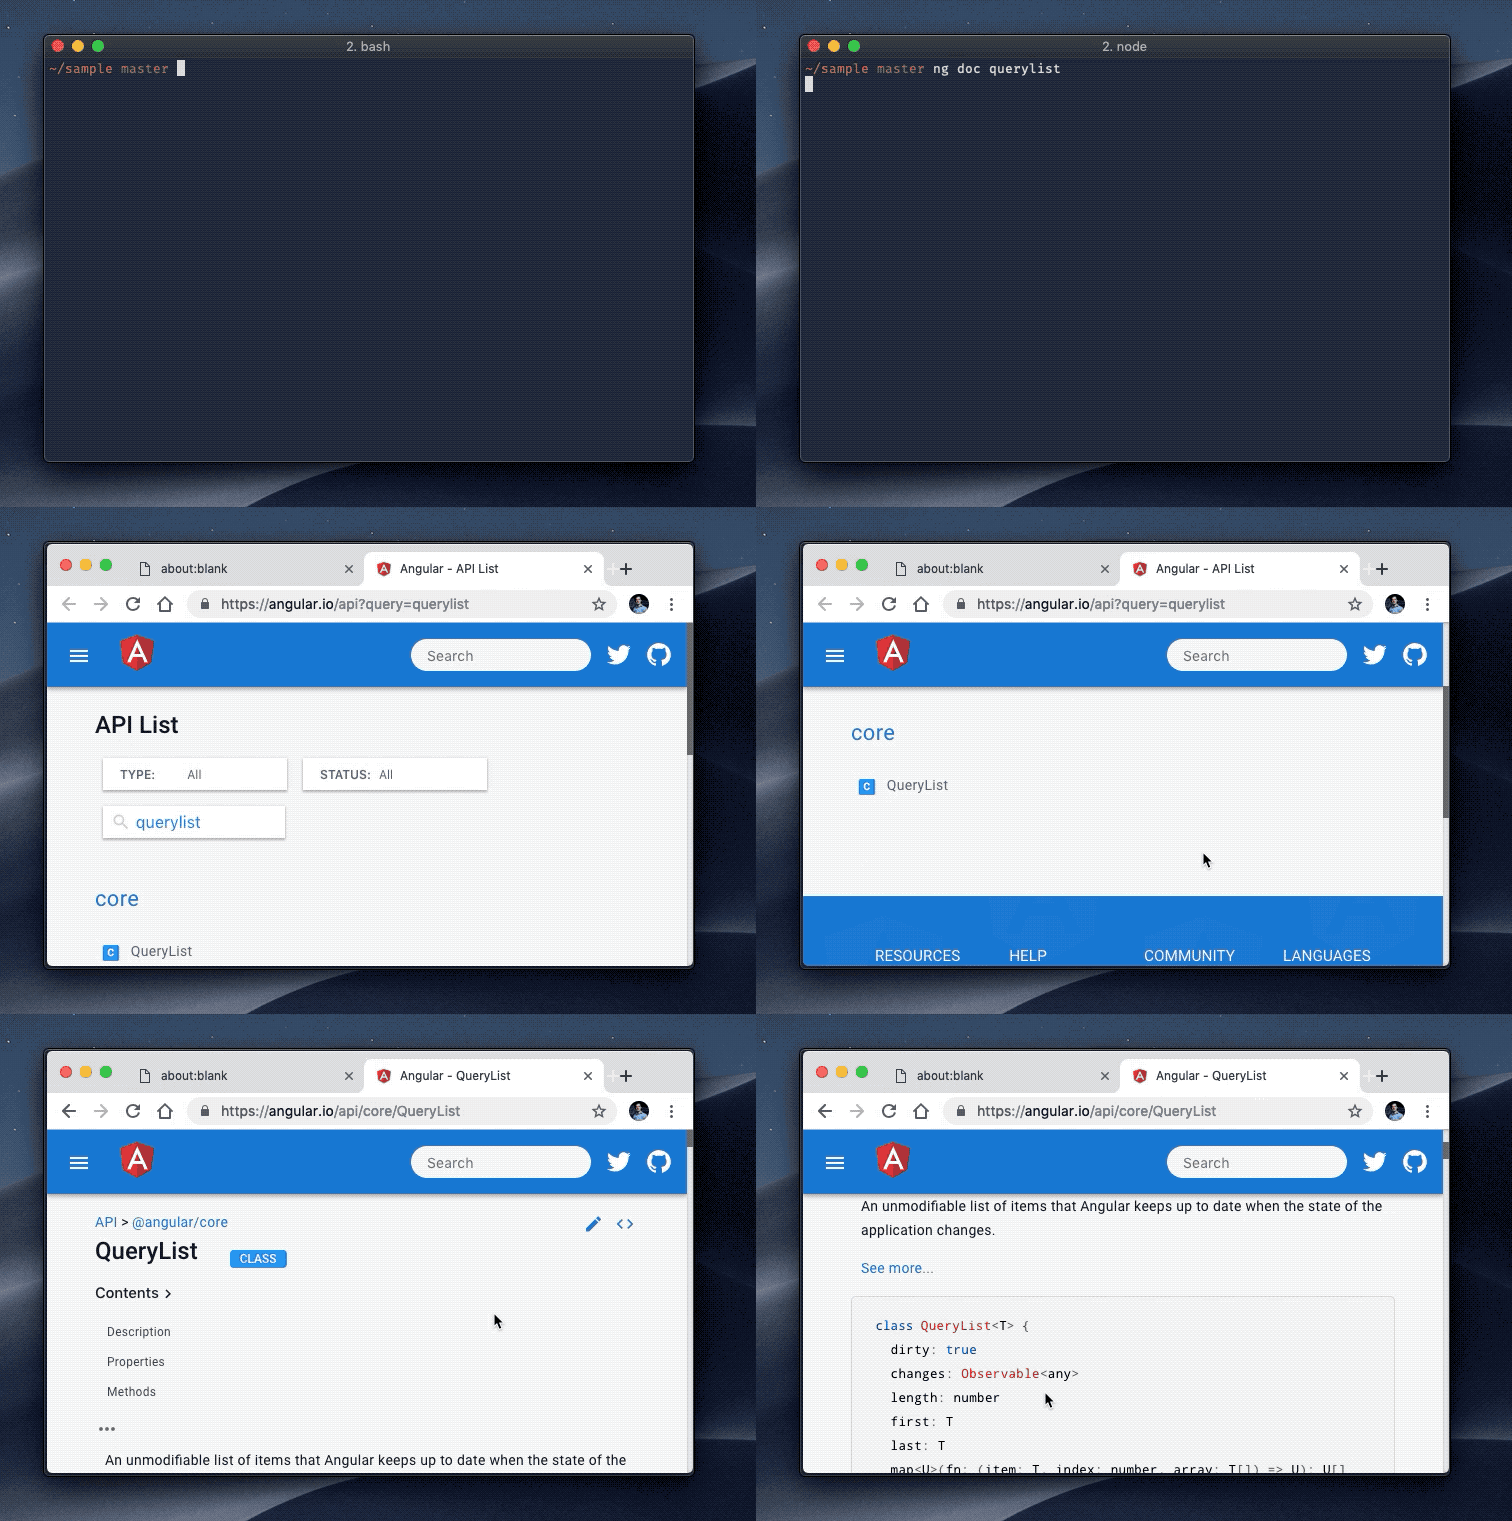
At the moment of writing, there’s a known issue on Windows
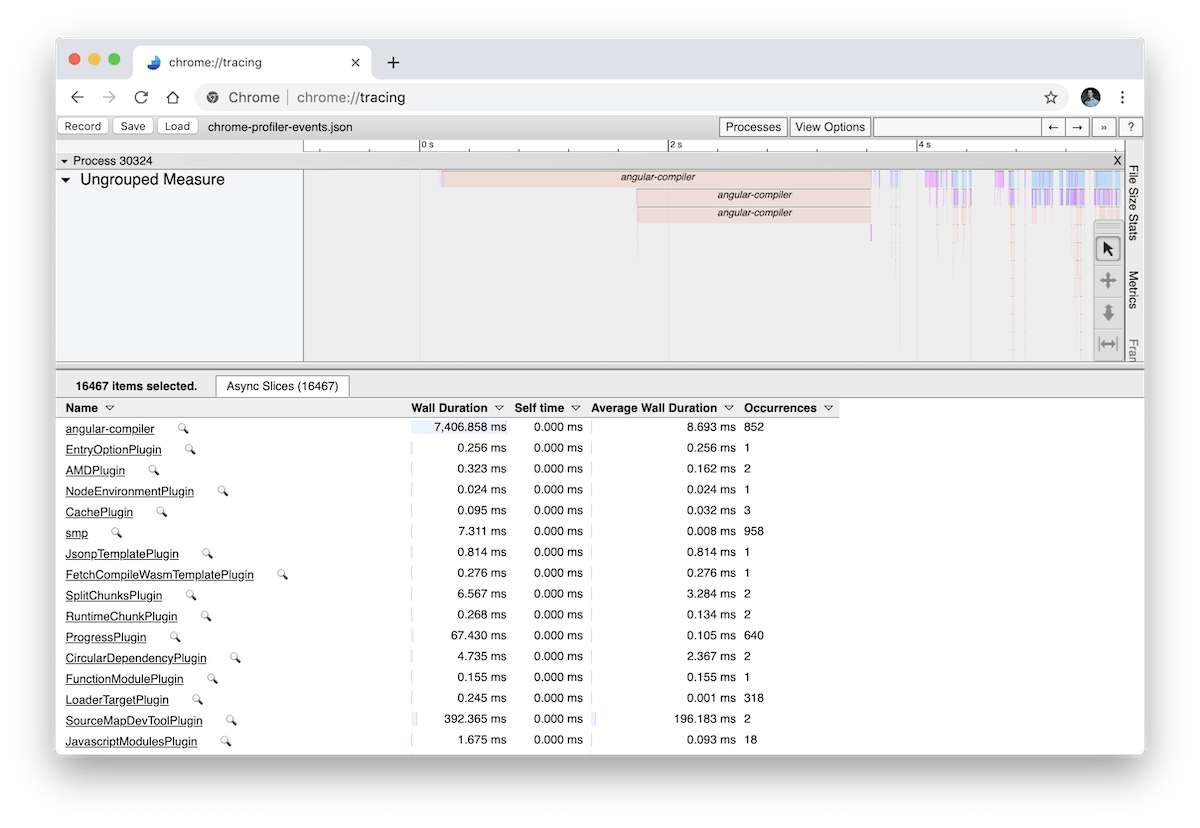
The more the application grows, the slower the build gets. Angular CLI version 7.0.0 introduced a --profile flag that outputs the build events and lets you profile them in chrome://tracing. You can use this feature as follows:
--profile flag on (ng build --prod --profile), Angular CLI will produce a file called chrome-profiler-events.jsonchrome://tracing and click on “Load” in the top left cornerchrome-profiler-events.jsonHere’s a link which explains how to get started with the trace event profiling tool.
This is an obvious one, but I’ve been really missing it since few days ago when I saw that it has been in the CLI the entire time… In Angular Seed, I was feeling strongly for opening the browser once the development server is ready. I used Angular CLI in the past and I noticed that this wasn’t the case there, which I found a little disappointing.
Oh well, I didn’t look at the documentation back then…but while reading through the source code I found the --open=true or -o command line option, which opens the browser for you. This tiny little feature saves me over a minute every day.
In this blog post we looked at five not very popular CLI features:
ng docBe tunned for Angular CLI v8.0.0 with more upcoming feature. Make sure you follow https://blog.angular.io for updates!
此内容由惯性聚合(RSS阅读器)自动聚合整理,仅供阅读参考。 原文来自 — 版权归原作者所有。