


Activity Monitor is one of the most useful utilities in macOS, and provides a host of numbers that tell us much about the thousands of processes on our Macs, from their CPU use to network transfers. Although those numbers appear precise and meaningful, since the introduction of Apple silicon Macs it has become obvious that they can be misleading, particularly CPU %. This article looks at the origin and meaning of three of those measurements, six years after Apple shipped the first Apple silicon Macs to developers.
When you’re concerned about your Mac’s performance, its energy use, or heat stress, there are three key measurements shown in Activity Monitor: CPU %, GPU % and Energy Impact. Although all three can be displayed in one of the app’s views, by default CPU % is shown in the CPU view, and Energy Impact in Energy.
Definitions
Apple defines CPU % as the “percentage of CPU capability that’s being used” and expresses it on a scale up to a maximum of the total number of CPU cores available multiplied by 100. Thus, the values given for my Mac mini M4 Pro could reach a maximum of (10 + 4) x 100 = 1,400, as it has 10 P cores and 4 E cores. Of course, that isn’t a percentage scale, which by definition sets 100% as its maximum.
Although many users are frightened when they see processes taking over 100%, this has proved reasonably faithful in the past, for CPUs with a single type of core running at fairly constant frequency. As I’ll demonstrate below, this breaks down completely when there are two types of core that can run at a wide range of frequencies.
The definition given by Apple for GPU % is different, in being “how hard the GPU in your Mac has been working”. The advice currently given for this is anachronistic: “If your Mac feels hot or the battery drains quickly, check the GPU activity. If you see many tall blue bars packed tightly together, consider using an external GPU to handle some of the workload.” Even in Pro and Max chips, with their powerful GPUs, this measurement appears seldom consulted.
While those two measures are given as %, Energy Impact has no associated unit or scale, and is defined as “A relative measure of the current energy consumption of the app (lower is better).” Units conventionally used for energy are joules (J), while power is expressed in watts (W), where 1 W is a rate of energy transfer of 1 J/s. These have different impacts: while energy use is related to battery drain and endurance, power is more relevant to the generation of heat and its dissipation by cooling.
Tests
All testing was performed on a single Mac mini M4 Pro with 10P + 4E cores, 48 GB of memory and a 20-core GPU, running macOS 26.5.1 Tahoe. Measurements were estimated from CPU %, GPU % and Energy Impact displayed in Activity Monitor, and compared with those obtained from separate test runs over 10 one-second periods of sampling using the powermetrics command tool, given by
sudo powermetrics -i 1000 -o outputfile.txt -n 10 -s cpu_power,gpu_power,ane_power
In each case, measurements are given as approximate medians.
Tests used were:
- tight in-core loops of floating point arithmetic, with minimal memory access and no storage use, using AsmAttic;
- Apple Archive compression of a single 22.6 GB file, with core, memory and storage access, using Cormorant;
- Writing a total of 53 GB of data in 160 files to the internal SSD, with minimal core but heavy memory and storage access, using Stibium;
- heavy GPU use in the Blender monster GPU benchmark, using Blender Benchmark 3.3.0 with Blender 5.1.1.
The first two of those were performed at low QoS to be constrained to the 4 E cores, and repeated at high QoS when they were run on the 10 P cores instead.
Results
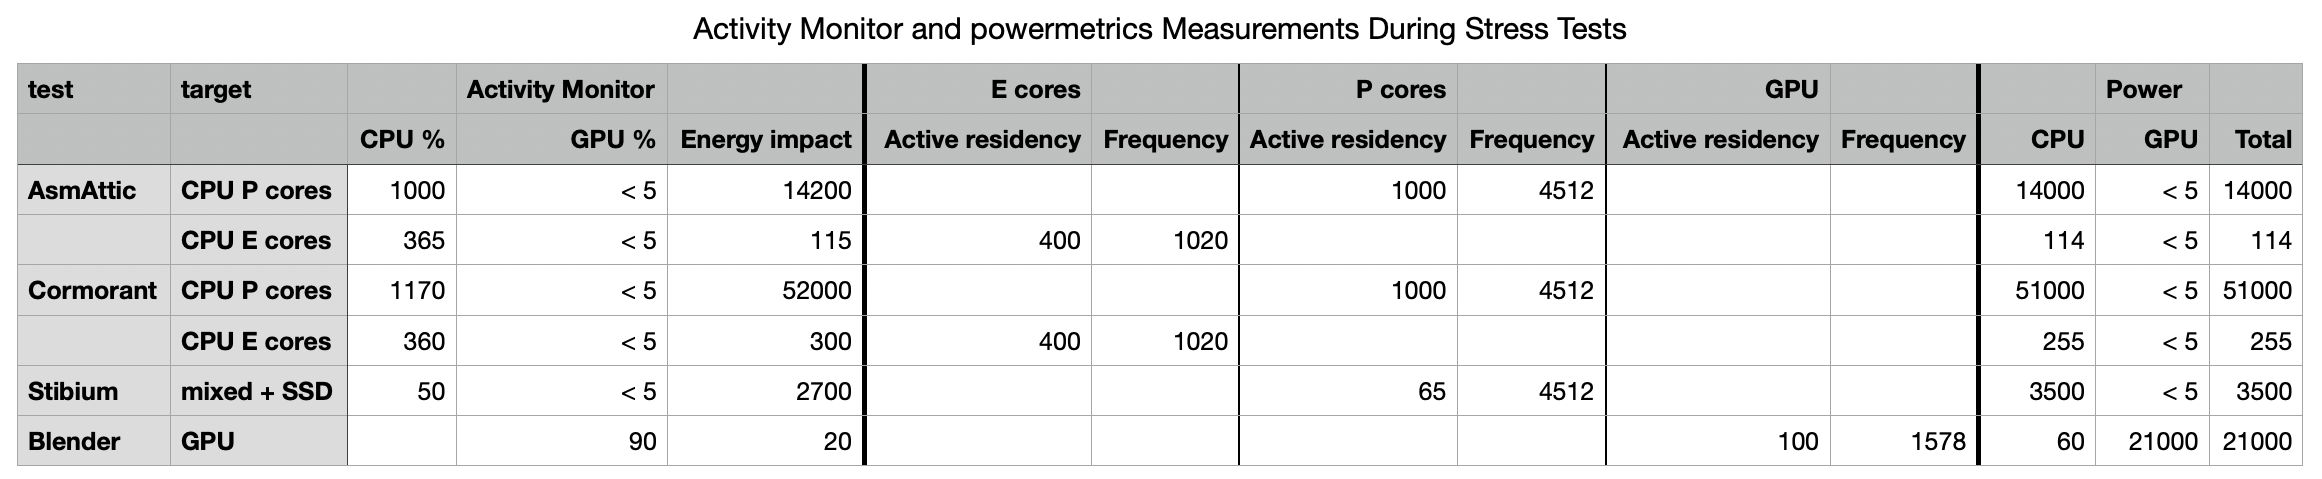
These are summarised in the table above (click to enlarge it into a single view).
CPU % correlates strongly with total % active residency of CPU cores.
GPU % correlates with GPU % active residency, as expected.
Energy Impact correlates strongly with power estimated in powermetrics, given there in mW, for the CPU cores alone, and didn’t correlate at all with GPU power.
CPU %
When compressing the test file in Cormorant, the ratio of CPU % between P and E cores was reported as being 3.25, interpreted by Apple’s definition as being the ratio of CPU capability that’s being used. In fact, there were 2.5 times more P cores used, and the P cores were run at 4.4 times the frequency of the E cores. Those 4 E cores took almost 18 times longer to complete the same compression task as the 10 P cores.
If the P and E cores were identical in performance and ran at the same frequency, four of them would be expected to take 2.5 times longer than ten P cores. Taking into account the difference in their frequencies, the slower E cores would be expected to take 11 times longer than the P cores. Even then, that cannot account for the observed difference in performance. Scaling E core performance in this task to that actually achieved by the P cores, CPU % given for the E cores should be about 65%, not 360%.
A simpler way to look at this is to compare how long you would expect a CPU % of 100% would take to compress the test file. On a single E core at 1020 MHz, that should take about 600 seconds (4 x 150), while a single P core at 4512 MHz should take about 84 seconds (10 x 8.4), just over 7 times as fast, but with the same “percentage of CPU capability that’s being used”.
However you look at it, core type and frequency are major determinants of CPU capability in Apple silicon chips, and not taking them into account when expressing CPU % is misleading.
Total energy
Continuing with the results from file compression, it’s straightforward to calculate the total energy required to compress the test file using the P and E cores:
- When compressing using the ten P cores, power used was 51 W for a total of about 8.4 seconds, thus 428 J, or 43 J per core.
- When compressing using the four E cores, power used was 255 mW for a total of about 150 seconds, thus 38 J, or 10 J per core.
Using the Energy Impact ratio as “a relative measure of the current energy consumption” gives the P cores using 173 times the energy consumption of the E cores, and the power ratio from powermetrics is similar at 200. The actual total energy ratio is 428/38 = 11, and per core is only 4.3. It therefore appears that the relativity of Energy Impact is non-linear, and in this case at least exaggerates the efficiency of using E cores.
These calculations only apply to threads run on CPU cores. In omitting GPU power from Energy Impact, many power- and energy-intensive tasks will appear far less demanding than they really are. This is becoming even more important now Apple silicon chips are being used increasingly to run AI computation locally.
Neither powermetrics nor Activity Monitor provide any estimates of power or energy used by other parts of a Mac, such as memory or the internal SSD, although those can also be important determinants of battery endurance and heat generation.
Conclusions
In Activity Monitor, using powermetrics for reference measurements,
- CPU % is calculated by adding the individual % active residency of each CPU core,
- GPU % is the % active residency of the GPU,
- neither CPU % nor GPU % take into account frequency, and remain misleading as a result,
- Energy Impact is the CPU core power, doesn’t take task duration into account, and most importantly doesn’t include GPU power. This greatly limits its usefulness.