



惯性聚合 高效追踪和阅读你感兴趣的博客、新闻、科技资讯
阅读原文 在惯性聚合中打开

推荐订阅源

A
About on SuperTechFans
Cloudbric
Cloudbric
C
CERT Recently Published Vulnerability Notes
G
GRAHAM CLULEY
V
Vulnerabilities – Threatpost
C
Cisco Blogs
T
Tenable Blog
P
Privacy International News Feed
T
The Exploit Database - CXSecurity.com
I
Intezer
AWS News Blog
AWS News Blog
IT之家
IT之家
博客园 - 司徒正美
C
Cybersecurity and Infrastructure Security Agency CISA
博客园 - 【当耐特】
The Hacker News
The Hacker News
奇客Solidot–传递最新科技情报
奇客Solidot–传递最新科技情报
Spread Privacy
Spread Privacy
S
SegmentFault 最新的问题
博客园 - Franky
人人都是产品经理
人人都是产品经理
cs.CV updates on arXiv.org
V
Visual Studio Blog
C
CXSECURITY Database RSS Feed - CXSecurity.com
H
Hacker News: Front Page
Latest news
Latest news
Scott Helme
Scott Helme
腾讯CDC
宝玉的分享
宝玉的分享
大猫的无限游戏
大猫的无限游戏
cs.AI updates on arXiv.org
A
Arctic Wolf
S
Securelist
雷峰网
雷峰网
The GitHub Blog
The GitHub Blog
Project Zero
Project Zero
Google DeepMind News
P
Palo Alto Networks Blog
F
Fortinet All Blogs
Schneier on Security
云风的 BLOG
云风的 BLOG
Security Archives - TechRepublic
The Last Watchdog
The Last Watchdog
WordPress大学
WordPress大学
MongoDB | Blog
MongoDB | Blog
L
LINUX DO - 最新话题
S
Schneier on Security
NISL@THU
NISL@THU
Jina AI
Jina AI
M
MIT News - Artificial intelligence

Microsoft Research Blog - Microsoft Research

Scaling cryptographic verification to boost computer security Aurora 1.5: Extending open foundation models for weather and Earth-system applications - Microsoft Research SkillOpt turns AI agent skills into trainable assets Memora scales agent memory to boost long-horizon productivity Turning brain prediction models into testable explanations Talos brings continuous genomic reanalysis to nearly 5,000 unsolved cases Ire identifies another LOTUSLITE specimen Data Formulator 0.7: AI-powered data analytics for enterprise data Extending Human Intelligence Through AI MagenticLite, MagenticBrain, Fara1.5: An agentic experience optimized for small models Vega: Zero-knowledge proofs for digital identity in the age of AI Further Notes on Our Recent Research on AI Delegation and Long-Horizon Reliability mimalloc: A new, high-performance, scalable memory allocator for the modern era GridSFM: A new, small foundation model for the electric grid Advancing AI for materials with MatterSim: experimental synthesis, faster simulation, and multi-task models SocialReasoning-Bench: Measuring whether AI agents act in users’ best interests Building realistic electric transmission grid dataset at scale: a pipeline from open dataset - Microsoft Research Microsoft at NSDI 2026: Advances in large-scale networked systems Red-teaming a network of agents: Understanding what breaks when AI agents interact at scale AutoAdapt: Automated domain adaptation for large language models New Future of Work: AI is driving rapid change, uneven benefits ADeLe: Predicting and explaining AI performance across tasks AsgardBench: A benchmark for visually grounded interactive planning GroundedPlanBench: Spatially grounded long-horizon task planning for robot manipulation Systematic debugging for AI agents: Introducing the AgentRx framework PlugMem: Transforming raw agent interactions into reusable knowledge Phi-4-reasoning-vision and the lessons of training a multimodal reasoning model CORPGEN advances AI agents for real work Media Authenticity Methods in Practice: Capabilities, Limitations, and Directions Project Silica’s advances in glass storage technology
AI can generate Charts. Flint helps generate better ones.
Brenda Potts · 2026-07-09 · via Microsoft Research Blog - Microsoft Research
Flint blog | three white line icons on an abstract green background; bar chart icon, connected nodes icon, flowchart icon

At a glance

  • Polished charts from simple specs. Flint allows AI agents to reliably generate expressive, visually polished charts from simple, human-editable specifications.
  • Semantic types guide design. Flint leverages semantic data types to express meanings of data. They help the compiler choose appropriate scales, baselines, formatting, and color schemes.
  • Layouts adapt to the data. Flint automatically manages sizing, spacing, labels, and layout so charts remain readable as cardinality and density change, without explicit user configurations.
  • One spec can target multiple backends. A single Flint specification can compile to Vega-Lite, Apache ECharts, or Chart.js without rewriting the chart from scratch.
  • Built for agent workflows. The open-source project includes the flint-chart library and the flint-chart-mcp server, so agents can create, validate, and render charts directly in chat or coding environments.
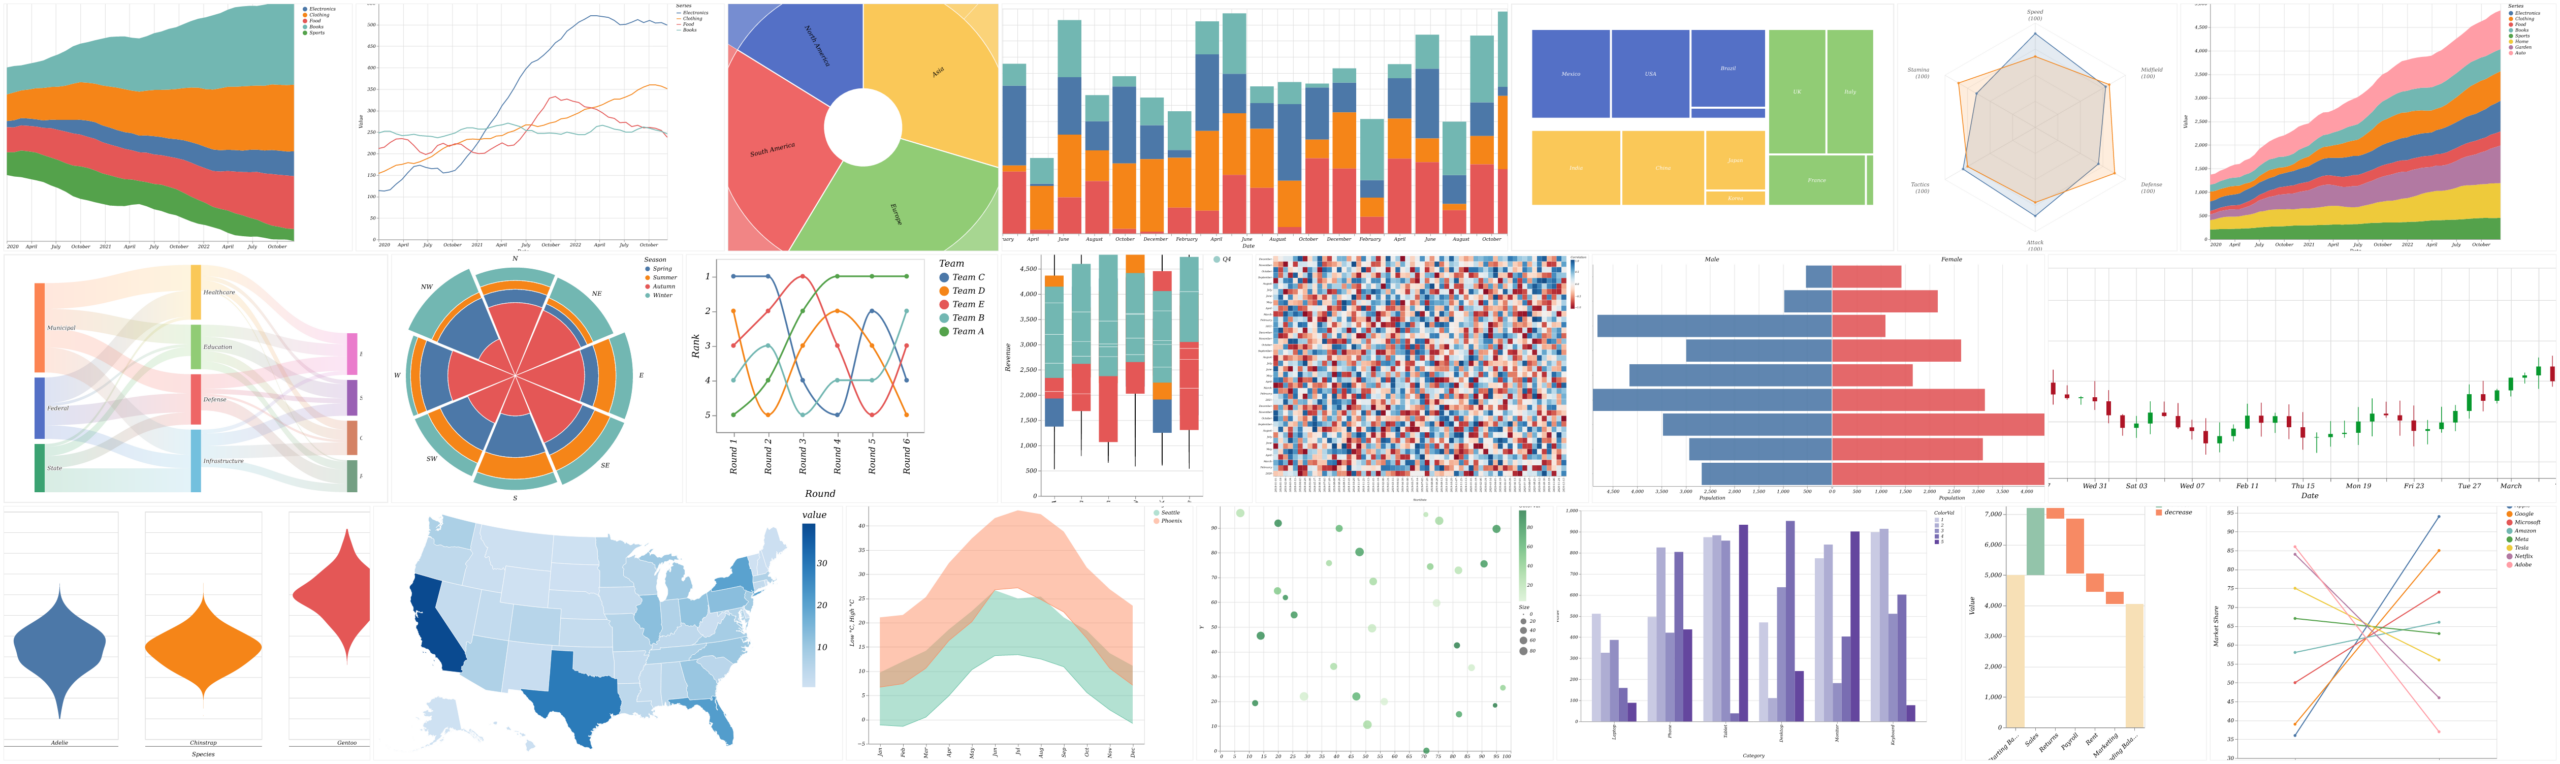
A dense grid displaying a diverse gallery of data visualizations. The collection showcases over twenty different chart types, including stacked area charts, line graphs, sunburst charts, stacked bar charts, treemaps, radar charts, Sankey diagrams, dense heatmaps, diverging bar charts, candlestick charts, violin plots, a choropleth map of the United States, scatter plots, grouped bar charts, waterfall charts, and parallel coordinate plots.
Figure 1. Flint supports a diverse collection of visualizations with its simple spec, which can be rendered with visualization libraries like Vega-Lite, Echarts, and Chart.js.

Creating a good chart requires many design decisions: how dates should be parsed, whether a scale should start at zero, how values should be formatted, how much room labels need, and which colors make the data easier to read. Modern visualization libraries such as Vega-Lite, Apache ECharts, and Chart.js expose these controls, but there is a trade-off: Short specifications that rely on system defaults often produce uninspiring charts, while polished visualizations require detailed specifications with purposely chosen parameters that are often verbose, fragile, and error-prone.

This trade-off becomes sharper as large language models (LLMs) and AI agents take on more visualization work. Agents are especially prone to errors when they must manage complex, low-level specification details, and the resulting fragile code can be difficult for people to inspect, repair, or reuse. Ideally, we need something in between: a compact specification that agents can produce reliably, people can edit directly, and a system can compile into a well-designed chart.

To address this challenge, we introduce Flint (opens in new tab), a visualization intermediate language for AI-driven chart creation. Flint helps AI agents create expressive, attractive charts from simple, human-editable chart specs. Instead of requiring verbose low-level parameters for scales, axes, spacing, and layout, the Flint compiler derives optimized chart settings from the data, semantic types, chart type, and encodings. The same Flint spec can render through multiple backends, including Vega-Lite, Apache ECharts, and Chart.js.

A three-step diagram illustrating the Flint workflow from left to right. It starts with a short JSON code snippet labeled
Figure 2. Flint compiles a compact, human-editable chart specification into a complete backend-native specification and rendered visualization. In this heatmap example, the Flint spec names semantic types (period as YearMonth, newUsers as Profit) and maps fields to visual channels. The compiler derives the Vega-Lite details, including temporal parsing, axis formatting, color scale, cell sizing, legend configuration, and layout.

How Flint works

Figure 2 illustrates the how the Flint compiler turns a compact chart specification into a refined heatmap.

To produce a high-quality heatmap, traditionally, we need to explicitly tell the system with low-level chart properties about how to process the period field, how to properly label MonthYear values, size individual heatmap cells, and choose a color scale that appropriately represents positive and negative newUsers values. Without these configurations, visualization libraries must guess from field names and raw values, which can lead to charts that are technically valid but potentially misleading. While they are important, hard-coding these details can be difficult and error-prone, and they make specification fragile and hard for users to understand or adapt.

In Flint, these low-level details are systematically managed, where the compiler infers them from high-level data and chart specifications. Here, the data specification captures semantic types and optional metadata, and the chart specification defines the chart type and maps fields to visual channels such as x, y, color, size, or facet. From this information, the compiler derives the parsing rules, scales, axes, aggregations, formatting, color schemes, layout, and generates the backend-native specification, which is used to render the final polished visualization. This frees users from explicitly setting fragile and error-prone low-level details.

Furthermore, because the intermediate representation is separate from any single rendering library, Flint can target backends with very different APIs and programming models. Users can keep the same compact chart intent while compiling to Vega-Lite, ECharts, or Chart.js, and choose the backend whose capabilities best fit the visualization.

Spotlight: Microsoft research newsletter

Microsoft Research Newsletter

Stay connected to the research community at Microsoft.

Flint is well suited to LLM-based chart generation because semantic types are often easier for models to infer than the full set of low-level visualization parameters. Field names, value patterns, and common data knowledge can help an agent recognize whether a column represents a date, price, percentage, country, ranking, or correlation. Once those meanings are explicit, the compiler can handle many design decisions that would otherwise appear as brittle, library-specific code.

In our research study, we compared Flint with DirectVL, a baseline that asks the model to directly generate full (more complex) Vega-Lite specifications in a LLM self-evaluation pipeline. Across three tested models based on testing data from Tidy Tuesdays, Flint received higher overall LLM-judge scores: 16.27 vs. 15.91 with GPT-5.1, 16.16 vs. 15.60 with GPT-5-mini, and 15.91 vs. 15.34 with GPT-4.1. In fact, Flint has been so powerful and reliable that it is now used to power Data Formulator (opens in new tab), a Microsoft Research project for AI-assisted data analysis and visualization.

To make Flint easy for your agents to access, we also release flint-chart-mcp, a Model Context Protocol (MCP) server that allows agents to create, validate, and render charts inside a chat or coding environment. MCP calls can embed data inline or read configured local files, and the server can open an interactive chart view so users can inspect and refine the results.

A mockup of an AI agent chat interface. A user sends the message,
Figure 3. Once you set up the flint-chart-mcp with your favorite AI client, the agent can generate interactive visualizations powered by Flint to answer your data exploration questions.

Try Flint

Flint is open source and ready to use:

Flint points toward a shared semantic layer for visualization, where people and AI agents can work with compact chart intent while a compiler handles the careful low-level details. We invite the community to explore the project and build on it.