惯性聚合 高效追踪和阅读你感兴趣的博客、新闻、科技资讯
阅读原文 在惯性聚合中打开

推荐订阅源

P
Privacy & Cybersecurity Law Blog
V
V2EX
月光博客
月光博客
奇客Solidot–传递最新科技情报
奇客Solidot–传递最新科技情报
The Register - Security
MongoDB | Blog
MongoDB | Blog
P
Privacy International News Feed
The Last Watchdog
The Last Watchdog
Security Archives - TechRepublic
美团技术团队
Stack Overflow Blog
Stack Overflow Blog
博客园 - 司徒正美
博客园 - 三生石上(FineUI控件)
V
Visual Studio Blog
cs.CV updates on arXiv.org
K
Kaspersky official blog
S
Secure Thoughts
T
Tenable Blog
Security Latest
Security Latest
The Cloudflare Blog
S
Security @ Cisco Blogs
H
Heimdal Security Blog
aimingoo的专栏
aimingoo的专栏
TaoSecurity Blog
TaoSecurity Blog
Blog — PlanetScale
Blog — PlanetScale
Microsoft Security Blog
Schneier on Security
Webroot Blog
Webroot Blog
G
Google Developers Blog
www.infosecurity-magazine.com
Scott Helme
Scott Helme
IT之家
IT之家
Latest news
Latest news
The Hacker News
The Hacker News
C
Check Point Blog
T
The Exploit Database - CXSecurity.com
H
Hackread – Cybersecurity News, Data Breaches, AI and More
腾讯CDC
C
CERT Recently Published Vulnerability Notes
NISL@THU
NISL@THU
N
News | PayPal Newsroom
Forbes - Security
Forbes - Security
P
Palo Alto Networks Blog
S
Security Affairs
S
Securelist
Google Online Security Blog
WordPress大学
WordPress大学
Last Week in AI
Last Week in AI
C
Cybersecurity and Infrastructure Security Agency CISA
A
About on SuperTechFans

ai monitoring Archives – TechEmpower

暂无文章

Real-time Monitoring of LLM-Based Applications
Tony Karrer · 2025-10-03 · via ai monitoring Archives – TechEmpower

We’re starting to see a pattern with LLM apps in production: things are humming along… until suddenly they’re not. You start hearing:

  • “Why did our OpenAI bill spike this week?”
  • “Why is this flow taking 4x longer than last week?”
  • “Why didn’t anyone notice this earlier?”

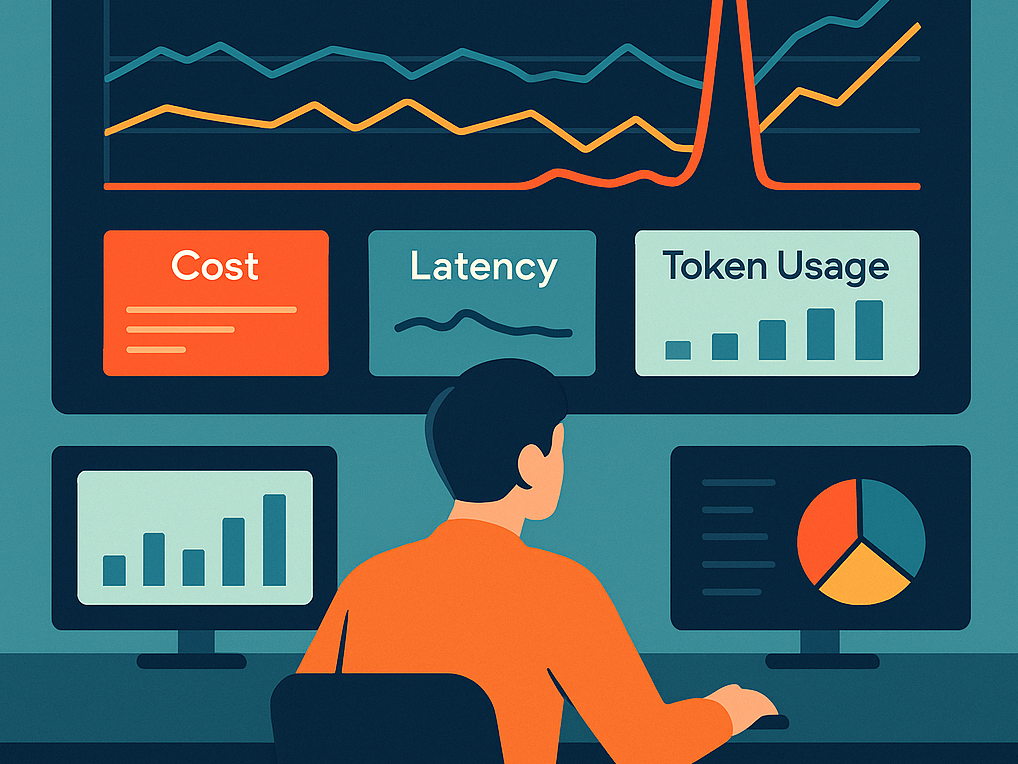
It’s not always obvious what to track when you’re dealing with probabilistic systems like LLMs. But if you don’t set up real-time monitoring and alerting early, especially for cost and latency, you might miss a small issue that quietly escalates into a big cost overrun.

The good news: you don’t need a fancy toolset to get started. You can use OpenTelemetry for basic metrics, or keep it simple with custom request logging. The key is being intentional and catching the high-leverage signals.

Here are some top reads that will help you get your arms around it.

Top Articles

  • A crisp primer that defines token count, latency, and cost as the pillars of observability. It’s tool-agnostic and shows how to wire up Prometheus dashboards via OpenTelemetry.

  • This one gets into the weeds but in a good way. It walks through tagging each request with a prompt ID and user ID so you can trace token spikes back to real root causes. Comes with useful alert rule examples.

  • Useful latency benchmarks per use case: chat, search, RAG. Suggests setting alert thresholds at 20% over your p95 SLOs to catch slippage early.

  • Starts broad, then gets practical. Has a great checklist for real-time dashboards, latency and token gauges, plus rituals like weekly reviews to refine thresholds. Also dives into pros/cons of current tools.

  • A broader take on the space, but solid advice. Introduces a three-layer stack (telemetry → dashboards → alerts) and gives sample PagerDuty rules for token or latency anomalies.