


Your Pipeline Is 23.3h Behind: Catching Tech Sentiment Leads with Pulsebit
We just noticed a significant anomaly: a 24-hour momentum spike of +0.679 in tech sentiment. This spike is particularly eye-catching as it reflects the underlying bullish sentiment in the tech sector, highlighted by articles discussing themes like "Tech Bulls Dominate Stock Market Trends." If you missed this, don’t worry; you’re not alone. Your sentiment analysis pipeline could be lagging by a whole 23.3 hours behind the leading English press coverage, which leaves you vulnerable to missing critical market shifts.
If your model doesn’t account for multilingual origins or entity dominance, you might find yourself stuck in the past. For instance, when the leading language is English and your pipeline is still analyzing data from other languages, you're missing out on key insights. By the time your model catches up, the momentum could have shifted, costing you valuable opportunities. In this case, you could have missed a +0.679 momentum spike for tech sentiment by over 23 hours.
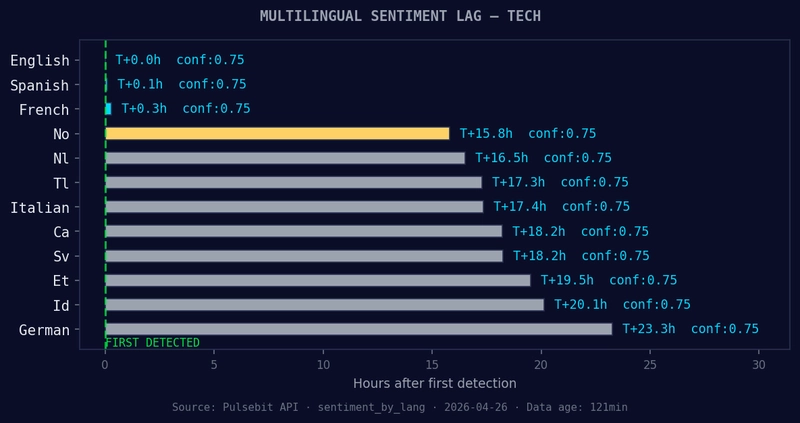
English coverage led by 23.3 hours. German at T+23.3h. Confidence scores: English 0.75, Spanish 0.75, French 0.75 Source: Pulsebit /sentiment_by_lang.
Let’s dive into how to catch this anomaly programmatically.
import requests
# Defining the parameters for the API call
params = {
"topic": "tech",
"score": +0.621,
"confidence": 0.75,
"momentum": +0.679,
"lang": "en" # Geographic origin filter
}
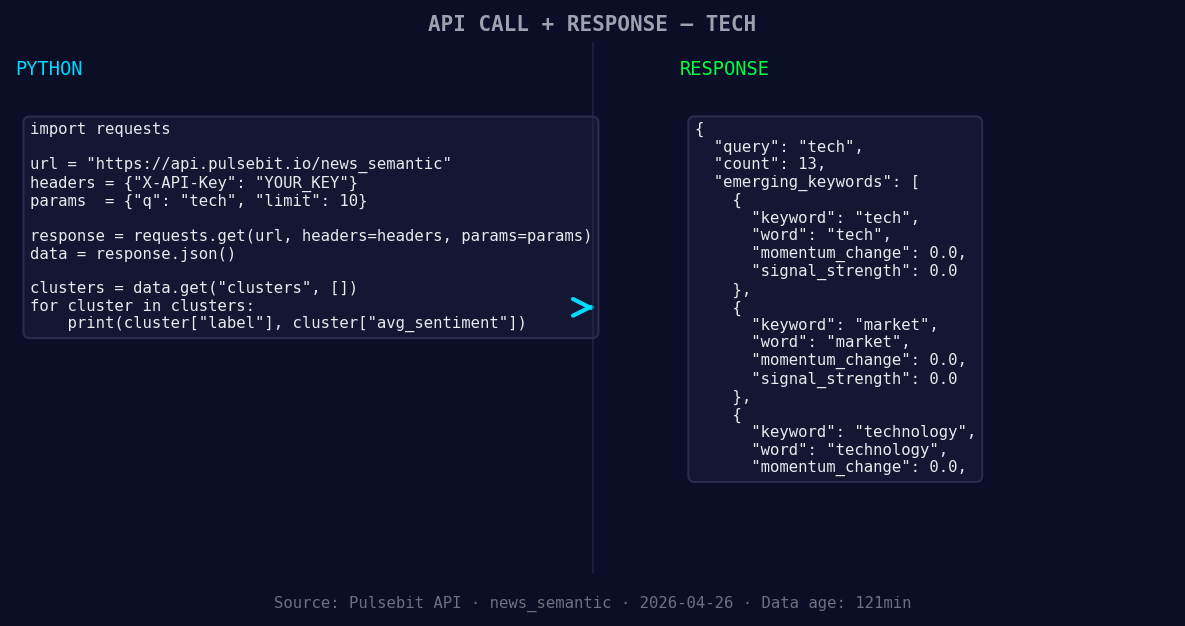
*Left: Python GET /news_semantic call for 'tech'. Right: returned JSON response structure (clusters: 3). Source: Pulsebit /news_semantic.*
# Making the API call to get the sentiment data
response = requests.get("https://api.pulsebit.com/sentiment", params=params)
data = response.json()
print(data)
Now that we’ve filtered the English language articles, we need to run the cluster reason string back through our sentiment scoring to better understand the narrative framing. Here’s how we can do that:
# The cluster reason string we want to analyze
cluster_reason = "Clustered by shared themes: bulls, taking, charge, stock, tech."

# Making a POST request to analyze the narrative
sentiment_analysis = requests.post("https://api.pulsebit.com/sentiment", json={"text": cluster_reason})
sentiment_result = sentiment_analysis.json()
print(sentiment_result)
These two snippets allow us to pinpoint sentiment changes and analyze prevailing narratives, giving us a competitive edge in the tech sector.
Now, let’s talk about three specific builds you can create with this data.
Geo-Filtered Real-Time Alerts: Set up alerts based on the geographic origin filter for tech sentiment exceeding a threshold of +0.650. This will notify you in real-time when the tech sentiment begins to rise, allowing you to act before the news breaks.
Meta-Sentiment Analysis Dashboard: Build a dashboard that runs the meta-sentiment loop for various clusters. For instance, analyze narratives around "screen, time, mental" to understand broader implications on consumer behavior. You might find correlations that could guide product development or marketing strategies.
Trend Visualization: Create a visualization tool that maps sentiment shifts in the tech sector against mainstream topics like "mental health" or "screen time." This can help you identify when tech trends diverge from mainstream sentiments, providing insights into potential market disruptions or innovations.
Arming yourself with these builds enables you to stay ahead of the game in an ever-evolving tech landscape.
If you want to implement this, we’ve made it easy for you to get started. Check out our documentation at pulsebit.lojenterprise.com/docs. Copy-paste the code above, and you can have this running in under 10 minutes.