
No data governance strategy is complete without a plan for tracking relevant KPIs and other metrics.
Data governance metrics enable organizations to measure the effectiveness of governance processes across areas such as data quality, security, availability and usage. Collecting and analyzing metrics documents the value of a data governance program, helping data leaders and governance managers build an ongoing business case for it. If the program doesn't achieve desired outcomes, metrics highlight issues that must be addressed.
Tracking governance metrics is also crucial for regulatory compliance. Although data protection and privacy regulations typically don't include explicit rules on collecting governance metrics, many require organizations to demonstrate that they take reasonable measures to maintain data security, privacy and, in some cases, quality. Metrics in these areas help show regulators and compliance auditors that a company is acting responsibly.
Organizations track different sets of metrics based on their governance goals and requirements. However, they commonly incorporate these six types of metrics to get a comprehensive view of their data governance program.
1. Operational metrics
The operational component of data governance centers on how an organization designs and implements its governance strategy. The following are examples of metrics that provide insights into data governance operations:
- Total number of policies. Tracking the number of data governance policies an organization has in place helps data leaders and business stakeholders understand the scope of governance operations and ensure that required resources are available to manage them.
- Governance assessment frequency and results. Organizations should assess governance policies and procedures at fixed intervals, ideally once or twice per year. More frequent assessments might be required if data governance needs change quickly or if an organization undergoes a technological transformation -- such as increased AI adoption -- that has major ramifications for governance policies. Governance problems identified by other metrics can also trigger out-of-cycle assessments.
- Total data assets and data volumes. Documenting the number of distinct data assets an organization has and the size of data volumes in different systems establishes resource baselines for data governance initiatives. Tracking changes in data assets and volumes also enables organizations to quickly scale governance operations when necessary.
2. Data quality metrics
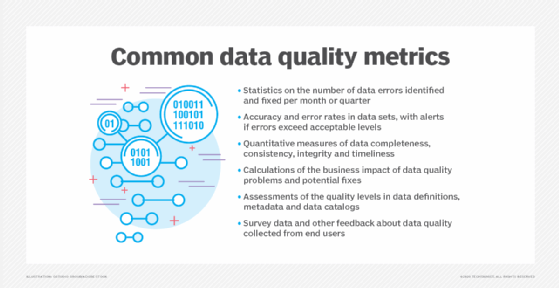
Low-quality data makes it hard to manage business operations effectively and generate accurate insights in analytics and AI applications to enable better decision-making. Data quality metrics validate data reliability for planned uses and highlight issues for data management and governance teams to address.
Different metrics measure data quality attributes such as accuracy, completeness, consistency, timeliness and validity. The following are some commonly used ones:
- Number of duplicate data entries. Duplicate entries in data sets lead to misleading analytics results and cause problems in business operations such as marketing, customer service and logistics.
- Data error rate. Data errors such as corrupted data, typos and transposed numbers are another source of analytics and operational problems. Acceptable error rates often vary for different applications.
- Percentage of data records with missing or incomplete values. Data that lacks required information due to missing values or incomplete fields also affects applications.
- Transformation error rate. Tracking how often data transformations fail helps organizations identify resulting data quality issues, such as corrupted, inaccurate or incomplete data sets, as well as opportunities to improve data transformation processes.
- Number of data issues identified and corrected. Tracking the number of data issues found and fixed within a specified period helps document the progress of data quality improvement efforts.
3. Data availability and usage metrics
Even high-quality data is only useful if business users and analytics teams can find and access it. Data availability and usage metrics provide insight into how effectively an organization uses data. Tracking them helps data management and governance teams identify technical issues in data platforms and problems with data discovery and accessibility.
Examples of availability and usage metrics include the following:
- System uptime percentage. Monitoring the uptime percentage of data platforms and analytics systems shows how often issues such as technical disruptions and cyberattacks interrupt data availability. This metric helps teams evaluate whether system changes or upgrades are required to prevent unexpected downtime.
- Average data latency. Data latency measures how long it takes processing workflows and pipelines to make data available for use after it's generated or updated. Tracking average latency shows whether initial availability goals -- often measured in seconds -- are being met.
- Data access frequency. Measuring how often data is accessed helps determine whether its usage meets expected levels. Underutilization could indicate that data is difficult to access or that users aren't aware of available data resources due to inadequate training or shortcomings in a data catalog. It could also be a sign that a data set isn't relevant or useful to many people.
- Data update frequency. Monitoring the number of updates and modifications to data also provides insights into its usage. Data writes represent a more active form of engagement than reads. Consequently, data sets with a high update frequency might require closer oversight from data quality analysts and governance teams.
- Number of unique users. Tracking the number of distinct users accessing data also helps identify underutilized data assets and guide data management and governance activities.
4. Data security and privacy metrics
Effective data governance protects sensitive information from exposure or misuse that could create regulatory compliance issues and cause reputational damage. Data security and privacy metrics provide insights into the effectiveness of data governance policies and procedures and enable governance teams to proactively identify and address risks.
The following are some helpful data security and privacy metrics:
- Number of access violations. Tracking how frequently unauthorized users attempt to access data helps teams evaluate the effectiveness of access controls and data security policies. Unauthorized users include external attackers, employees with no legitimate need to access specific data sets or contractors who shouldn't have access to a company's internal data.
- Number of data breaches. This is a separate metric for tracking incidents where unauthorized users successfully access a company's data.
- Number of privacy incidents. This metric tracks improper access, use and handling of personal data that violates privacy laws and internal policies. In addition to data breaches involving personal information, privacy incidents include actions such as sharing data with unauthorized individuals and using it inappropriately in analytics and AI applications.
- Policy compliance rate. This measures the percentage of data assets and processes that comply with data security and privacy policies, including data access controls, encryption standards, retention schedules and regulatory requirements.
- Number of policy exceptions. Governance teams often grant temporary exceptions to data security and privacy policies. Tracking the number of exceptions helps manage them and identify areas where policies need to be updated. Teams can also track longer-term policy exemptions and compare the two numbers with the policy compliance rate to gain broader insights into data that isn't fully protected due to inadequate or unenforced policies.
5. Data stewardship metrics
Data stewardship metrics focus on how effectively an organization engages with data governance practices and maintains governance standards. They track the activities of data stewards who are directly responsible for managing data sets and overseeing the implementation of governance policies.
Common data stewardship metrics include the following:
- Number of data stewards. Tracking the number of data stewards assigned to data assets and comparing it to the number of assets and data volumes helps governance teams assess whether their organization has enough stewards -- or too many.
- Number of issues resolved. The number of data governance problems that data stewards resolve is routinely tracked to monitor their activities and assess their productivity.
- Issue resolution time. Similarly, tracking resolution times for data issues provides useful insights into data stewardship work and performance.
6. Data literacy metrics
Employees who understand the value of data and how to use it effectively are more likely to recognize the need for strong data governance. Organizations use data literacy metrics to assess literacy levels and how actively users participate in educational processes designed to create a more data-literate culture that helps sustain governance initiatives.
The following are examples of literacy metrics:
- Training engagement and completion rates. Metrics that track user participation in data literacy training programs and broader data governance education -- such as the percentages of employees who enroll in and successfully complete training programs -- offer insight into engagement with governance initiatives. The percentage involved in governance activities is another useful metric.
- Data literacy scores. The average scores from data literacy assessments conducted during training programs measure how well employees understand the material presented and their skills in areas such as data discovery, analysis and visualization. Tracking them helps governance teams assess both data literacy levels and the effectiveness of the training.
- Internal survey results. User surveys conducted by governance teams provide both quantitative and qualitative metrics on data literacy and awareness in organizations.
Chris Tozzi is a freelance writer, research adviser, and professor of IT and society who has previously worked as a journalist and Linux systems administrator.