惯性聚合 高效追踪和阅读你感兴趣的博客、新闻、科技资讯
阅读原文 在惯性聚合中打开

推荐订阅源

cs.AI updates on arXiv.org
Cloudbric
Cloudbric
Help Net Security
Help Net Security
W
WeLiveSecurity
OSCHINA 社区最新新闻
OSCHINA 社区最新新闻
IT之家
IT之家
The Last Watchdog
The Last Watchdog
酷 壳 – CoolShell
酷 壳 – CoolShell
S
Security @ Cisco Blogs
H
Hacker News: Front Page
大猫的无限游戏
大猫的无限游戏
美团技术团队
S
Security Affairs
Exploit-DB.com RSS Feed
Google DeepMind News
D
Darknet – Hacking Tools, Hacker News & Cyber Security
S
SegmentFault 最新的问题
The Cloudflare Blog
Hugging Face - Blog
Hugging Face - Blog
有赞技术团队
有赞技术团队
cs.CL updates on arXiv.org
Forbes - Security
Forbes - Security
O
OpenAI News
P
Palo Alto Networks Blog
月光博客
月光博客
博客园_首页
V
V2EX
Security Archives - TechRepublic
NISL@THU
NISL@THU
WordPress大学
WordPress大学
J
Java Code Geeks
V
Visual Studio Blog
PCI Perspectives
PCI Perspectives
阮一峰的网络日志
阮一峰的网络日志
奇客Solidot–传递最新科技情报
奇客Solidot–传递最新科技情报
爱范儿
爱范儿
钛媒体:引领未来商业与生活新知
钛媒体:引领未来商业与生活新知
博客园 - 司徒正美
Apple Machine Learning Research
Last Week in AI
Last Week in AI
T
Threatpost
博客园 - Franky
Scott Helme
Scott Helme
博客园 - 叶小钗
人人都是产品经理
人人都是产品经理
T
Threat Research - Cisco Blogs
T
The Exploit Database - CXSecurity.com
博客园 - 三生石上(FineUI控件)
V
Vulnerabilities – Threatpost
宝玉的分享
宝玉的分享

PostHog's RSS Feed

Training our own AI models - PostHog From 270GB RAM to 5GB: Moving local flag evaluation from Django to Rust The best analytics stack for vibe-coded apps The do's and don'ts of minimum viable product marketing - PostHog The best MCP servers for startups, by workflow 4,063 errors closed without a human opening PostHog – here's what we learned - PostHog PostHog Code and the self-driving product - PostHog Why attacking your competitors online is dumb - PostHog The best real-time analytics platforms for developers, compared DuckDB vs ClickHouse: Why we use both at PostHog - PostHog PostHog's next chapter - PostHog Making Claude Cowork actually useful - PostHog PostHog vs Matomo in-depth tool comparison You're doing lifecycle emails wrong Untangling Tokio and Rayon in production: From 2s latency spikes to 94ms flat The best HIPAA-compliant A/B testing tools - PostHog A beginner's guide to testing AI agents - PostHog I hate the standup bot (so I built an agent to do it for me) - PostHog The best CDPs for developers, compared The best error tracking tools for developers, compared The best feature flag software for developers, compared 7 best session replay tools for mobile apps 7 best free open source business intelligence tools right now 7 best free and open source LLM observability tools PostHog vs LogRocket in-depth tool comparison The most popular PostHog alternatives, compared Open source (and self-hosted) session replay tools - PostHog The 9 best GA4 alternatives for apps and websites - PostHog PostHog vs Google Analytics 4 in-depth tool comparison How we built automatic clustering for LLM traces - PostHog The 7 best HIPAA-compliant analytics tools 8 best open source analytics tools you can self-host - PostHog The best product analytics tools for startups, compared PostHog vs FullStory in-depth tool comparison The best in-app survey tools for product teams, compared The 7 best mobile app analytics tools PostHog vs Hotjar in-depth tool comparison The 8 best free and open-source feature flag services - PostHog The 5 best free and open-source A/B testing tools - PostHog The best mobile app A/B testing tools, compared What is a feature flag? Feature Flags vs Remote Config vs A/B Testing PostHog is now available in Vercel’s v0 The best Heap alternatives & competitors, compared PostHog vs Heap in-depth tool comparison PostHog vs Pendo in-depth tool comparison PostHog × Vercel: feature flags, minus the plumbing Your logs' final destination is in GA. You always end up here anyway Behind the scenes of a PostHog hackathon - PostHog The most popular Mixpanel alternatives & competitors, compared PostHog vs Mixpanel in-depth tool comparison The 9 best GDPR-compliant analytics tools How we use Logs at PostHog The best web analytics tools for developers, compared Stop AI slop: Run evals with LLM-as-a-Judge - PostHog You product data just got a job: Workflows is now out App onboarding: How to fix drop-off points Meet Logs (beta) – logs with all the tools you’re already using Why small teams crush tiger teams How we built user behavior analysis with multi-modal LLMs (in 5 not-so-easy steps) - PostHog The best Contentsquare alternatives & competitors, compared 8 learnings from 1 year of agents – PostHog AI - PostHog Why we killed our AI product assistant Workflows graduate to beta! Product data, meet automation The best Rollbar alternatives & competitors, compared Workflows are now in Alpha and I already broke mine - PostHog I've consistently underestimated how important communication is as a CEO - PostHog How we made feature flags even faster and more reliable The best session replay tools for developers, compared What I learned attending my first ever hackathon - PostHog Did you know AI is answering our community questions? - PostHog How not to be boring - PostHog We built an internal tool to generate changelog images for social media - PostHog What we built at our windswept Mykonos hackathon - PostHog How we built our onboarding email flow (with actual performance data) - PostHog We're building a better PostHog community by closing our public Slack - PostHog Introducing Notebooks for PostHog - PostHog Why we've launched PostHog user surveys - PostHog How we made feature flags faster and more reliable - PostHog In-depth: ClickHouse vs Redshift - PostHog Introducing HouseWatch: An open-source toolkit for ClickHouse - PostHog Introducing HogQL: Direct SQL access for PostHog - PostHog What we built at our sun-kissed Aruba hackathon - PostHog In-depth: ClickHouse vs BigQuery - PostHog In-depth: ClickHouse vs Elasticsearch - PostHog HogMail #22: Why do companies over-hire?" - PostHog Our simpler goal: Help engineers to be better at product - PostHog In-depth: ClickHouse vs Snowflake - PostHog HogMail #21: Avoiding the "Product Death Cycle" - PostHog Sunsetting Kubernetes support for PostHog - PostHog Why 'Product Engineer' is the most fun role I've had in tech - PostHog HogMail #20: Why do startups fail? - PostHog The best Google Optimize alternatives for apps and websites - PostHog Array 1.43.0: Massive performance improvements! - PostHog In-depth: ClickHouse vs Druid - PostHog HogMail #19: Which meetings should you kill? - PostHog CEO diary: The things I learned in 2022 - PostHog The essential tools used by product engineers - PostHog HogMail #18: What can SaaS learn from the New York Times? - PostHog What is a product engineer? - Product Engineer Handbook - PostHog Array 1.42.0: Get beta features via our roadmap! - PostHog
How we’re making PostHog deployments easier - PostHog
Harry Waye · 2022-03-22 · via PostHog's RSS Feed

When PostHog was born in 2020, it was a simple Python application (Django + Celery) backed by a PostgreSQL datastore. Troubleshooting was easy, while the low barrier of entry meant fast adoption and more feedback on where to take the product.

This was great at the start, but it couldn't last. More customers meant more data to ingest and analyze. Our ingestion couldn’t keep up with the volumes of events we were receiving, and our event queries using PostgreSQL were slow. If we wanted PostHog to scale, we had to revisit our stack.

Introducing Kafka helped us to decouple our data streams and our processing pipeline, while ClickHouse helped us to deliver very fast queries on a large volume of data and more horizontal scaling capabilities. These additions helped us scale, but they came at a cost: complexity.

Here's how our ingestion pipeline looks like now:

graph TD CLIENT[Client Library] FLAGS["/flags API"] CAPTURE[Capture API] PLUGINS[Plugin server] PERSONS["PostgreSQL (persons table)"] Kafka2[Kafka] CLIENT -..-> FLAGS CLIENT -..-> CAPTURE CAPTURE --> Kafka Kafka <-..- PLUGINS PLUGINS <--> PERSONS PLUGINS --> Kafka2 Kafka2 <-..- ClickHouse

While powerful, this new architecture has created the following challenges:

  • We now have additional distributed services like Kafka, ClickHouse and Zookeeper to deploy and manage.

  • Each additional dependency requires considerations in terms of monitoring, migrations, upgrades, durability among others.

  • ClickHouse is a relatively new product. Whereas tooling around PostgreSQL is very mature, we need to do some of the heavy lifting ourselves with ClickHouse.

  • Very few people know or have experience with managing a ClickHouse cluster relative to PostgreSQL. Our partnerhship with Altinity, which offers 24/7 technical support for ClickHouse, and bespoke training, is another way we're addressing this challenge.

  • Simple operations such as application deployments or database upgrades have become complex automations.

To address this complexity and make PostHog easier to deploy, maintain and use for anyone, we gave ourselves two goals: improve our test framework and improve our built-in monitoring.

This article is part of our A Universe of New Features launch week series

While you can self-host PostHog using docker-compose for the evaluation stage, for production we offer an abstraction system built on top of the Kubernetes platform via Helm.

We’ve built on top of Kubernetes because although it's overkill for many scenarios, it allows us to focus on one abstraction but target any cloud provider that has a Kubernetes offerings. Currently we support AWS, Azure (alpha), DigitalOcean and Google Cloud Platform.

In order to give us confidence that every self-hosted installation is reliable and we iterate fast, we needed to significantly improve our testing frameworks.

Kubernetes resources are usually represented as YAML objects, while Helm helps us to define, install, upgrade and package them via a template engine.

In order to make sure those resources are defined, installed and upgrade correctly across different cloud platforms, Kubernetes versions and deployment scenarios, we’ve introduced several layers of testing, each of which with a specific goal:

  • lint tests (via helm lint): to verify if the Helm templates can be rendered without errors

  • unit tests (via quintush/helm-unittest): to verify if the rendered Helm templates are behaving as we expect

  • integration tests:

    • kubetest: to verify if applying the rendered Helm templates against a Kubernetes target cluster gives us the stack we expect (example: are the disks encrypted? Can this pod communicate with this service?)

    • k6: HTTP test used to verify the reliability, performance and compliance of the PostHog installation (example: is the PostHog ingestion working correctly?)

    • k3s: to verify Helm install/upgrade commands across different versions

    • e2e - Amazon Web Services, e2e - DigitalOcean, e2e - Google Cloud Platform: to verify Helm install command on the officially supported cloud platforms

Thanks to those layers, we can now detect scenarios like:

  • template is invalid

  • template is valid, but it didn’t get rendered as we expect

  • template is valid and got rendered as we expect but doesn’t work on a specific Kubernetes version

  • template is valid and got rendered as we expect, works on all supported Kubernetes version, but it doesn’t work on a specific implementation of a cloud provider

Those tests are helping us to identify and fix several bugs in our implementation, catching regressions before code gets released and enabling us to iterate faster than ever.

There's more information about the technical implementation on our repo.

Proper monitoring is vital for maintaining a successful installation.

To simplify this task for our self-hosting users, we’ve improved the built-in monitoring we provide as part of PostHog by leveraging best in class open source components like Grafana, Prometheus and various service exporters.

We create new templated dashboards when we identify better metrics to monitor, and techniques to debug an installation, and make them available to everyone in the next release.

PostHog - built-in PostgreSQL dashboard

PostHog - built-in Redis dashboard

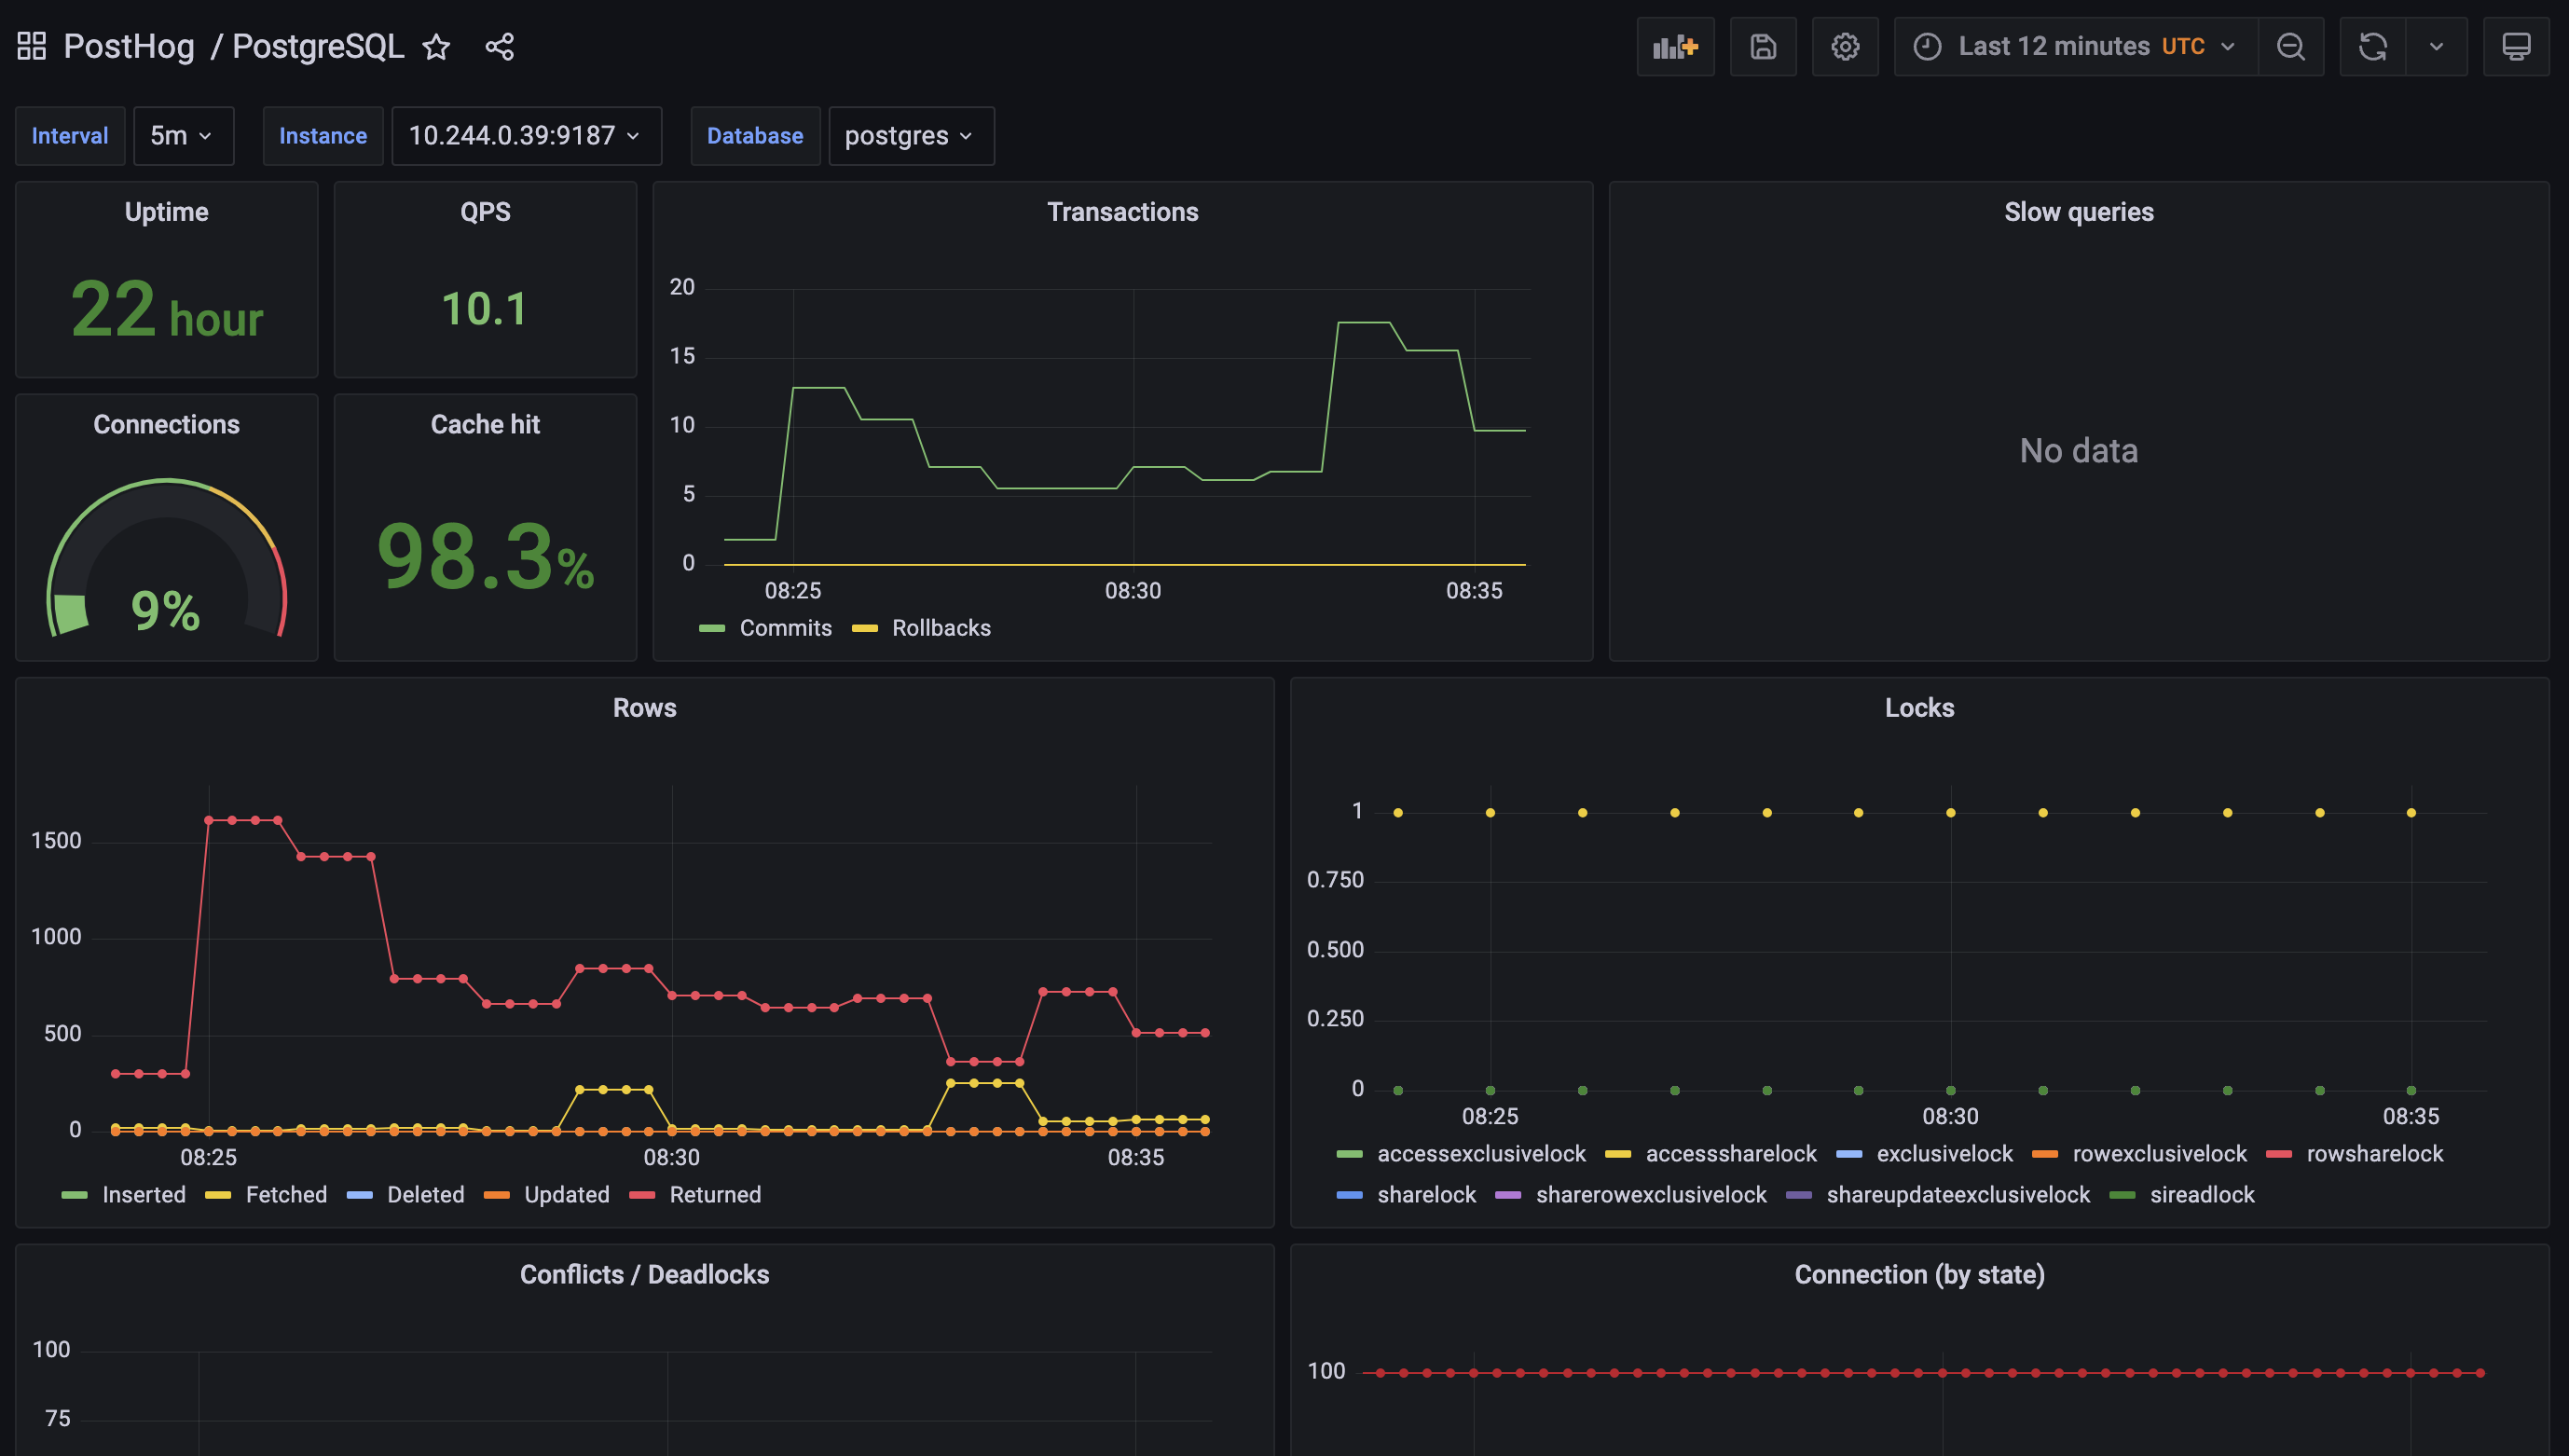
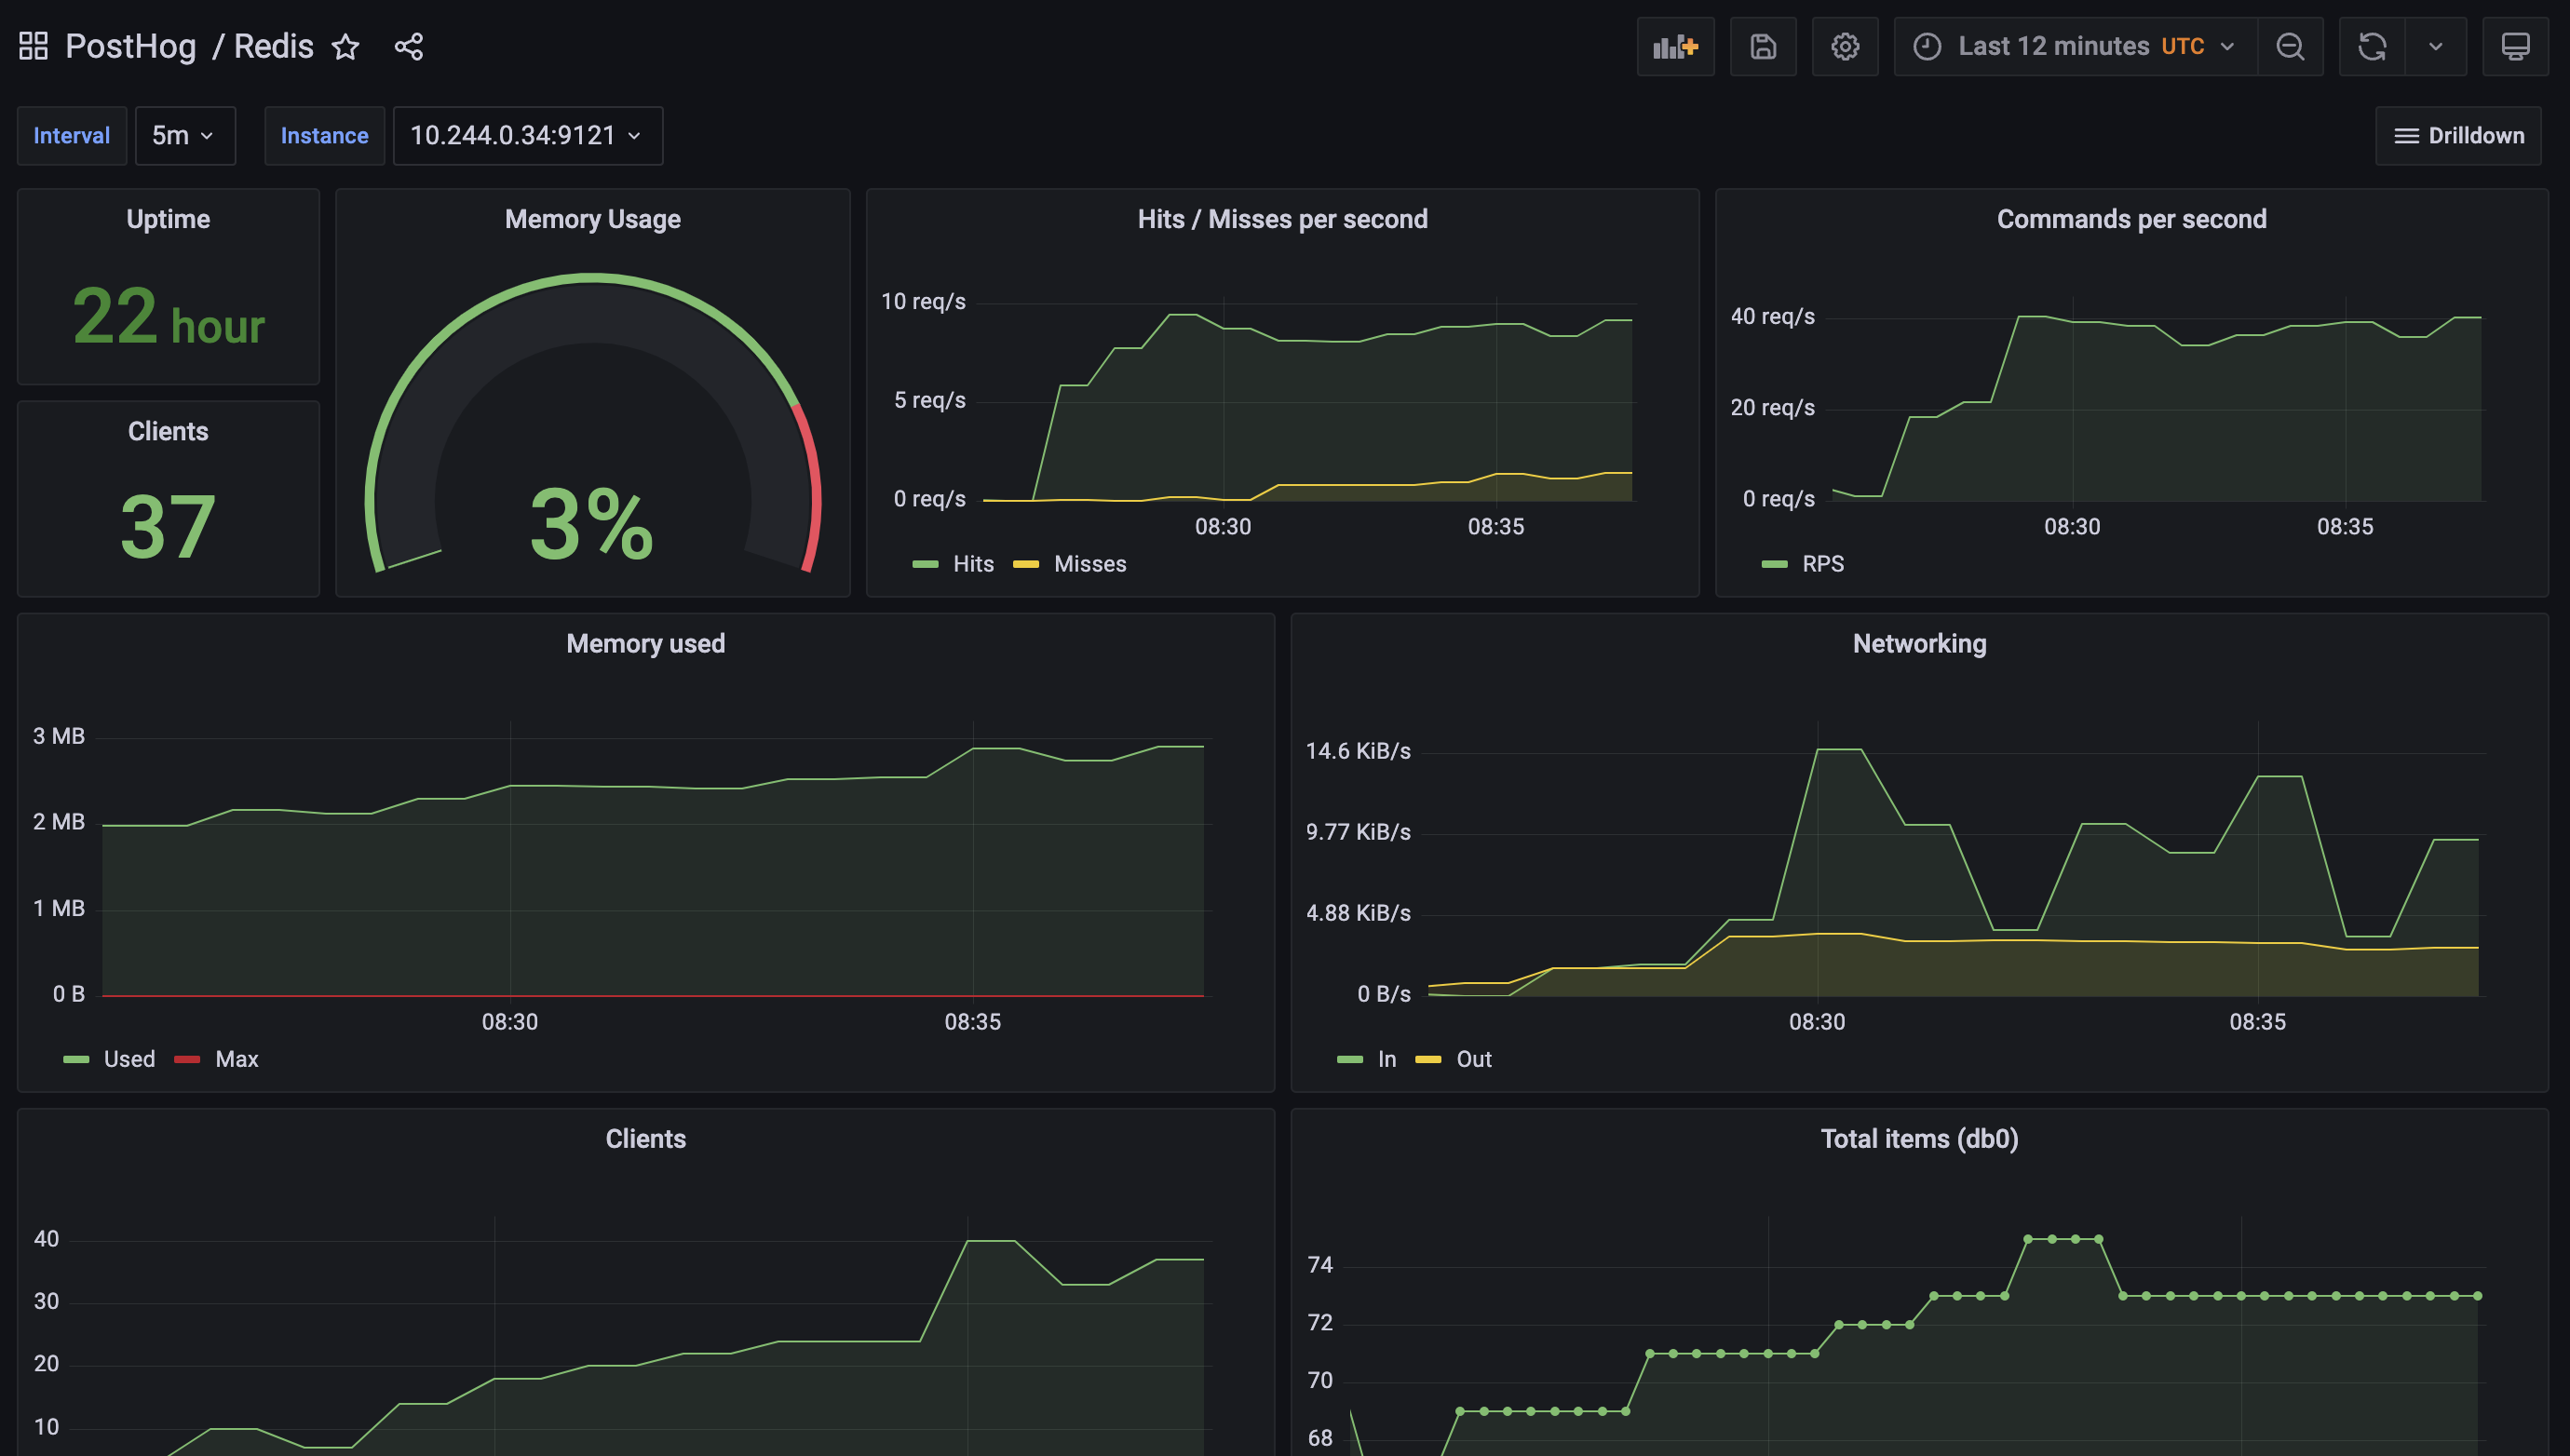
Thanks to this work, you can now get critical insights about the majority of PostHog services by simply enabling the monitoring features in the Helm chart. You can read more about these in our chart configuration docs.

Improving deployments for PostHog Cloud and our self-hosting customers is an effort we will keep investing in. Here's a sneak peek at some of the projects in our roadmap:

  • keep improving our chart to align to Kubernetes best practices

  • add support for more cloud platforms

  • enhance our observability stack by integrating OpenTelemetry across all our components and systems

If you enjoyed reading this look at improving PostHog deployments, we recommend reading Karl's deep dive into the secrets of PostHog query performance.

Interested on chatting about those topics? Get in touch with our teams!

Subscribe to our newsletter

Product for Engineers

Read by 100,000+ founders and builders

We'll share your email with Substack