We just published Garage v0.7, our second public beta release. In this post, we do a quick tour of its 2 new features: Kubernetes integration and OpenTelemetry support.
Two months ago, we were impressed by the success of our open beta launch at FOSDEM and on Hacker News: our initial post lead to more than 40k views in 10 days, peaking at 100 views/minute, and all requests were served by Garage, without even using a caching frontend! Since this event, we continued to improve Garage, and — 2 months after the initial release — we are happy to announce version 0.7.0.
But first, we would like to thank the contributors that made this new release possible: Alex, Jill, Max Audron, Maximilien, Quentin, Rune Henrisken, Steam, and trinity-1686a. This is also our first time welcoming contributors external to the core team, and as we wish for Garage to be a community-driven project, we encourage it!
You can get this release using our binaries or the package provided by your distribution. We ship statically compiled binaries for most common Linux architectures (amd64, i386, aarch64 and armv6) and associated Docker containers. Garage now is also packaged by third parties on some OS/distributions. We are currently aware of FreeBSD and AUR for Arch Linux. Feel free to reach out to us if you are packaging (or planning to package) Garage; we welcome maintainers and will upstream specific patches if that can help. If you already did package Garage, please inform us and we'll add it to the documentation.
Speaking about the changes of this new version, it obviously includes many bug fixes. We listed them in our changelogs, so take a look, we might have fixed some issues you were having! Besides bug fixes, there are two new major features in this release: better integration with Kubernetes, and support for observability via OpenTelemetry.
Before Garage v0.7.0, you had to deploy a Consul cluster or spawn a "coordinating" pod to deploy Garage on Kubernetes (K8S). In this new version, Garage integrates a method to discover other peers by using Kubernetes Custom Resources (CR) to simplify cluster discovery.
CR discovery can be quickly enabled in Garage, by configuring the name of the desired service (kubernetes_namespace) and which namespace to look for (kubernetes_service_name) in your Garage configuration file:
kubernetes_namespace = "default"
kubernetes_service_name = "garage-daemon"
Custom Resources must be defined a priori with Custom Resource Definition (CRD). If the CRD does not exist, Garage will create it for you. Automatic CRD creation is enabled by default, but it requires giving additional permissions to Garage to work. If you prefer strictly controlling access to your K8S cluster, you can create the resource manually and prevent Garage from automatically creating it:
kubernetes_skip_crd = true
If you want to try Garage on K8S, we currently only provide some basic example files. These files register a ConfigMap, a ClusterRoleBinding, and a StatefulSet with a Persistent Volumes.
Once these files are deployed, you will be able to interact with Garage as follow:
kubectl exec -it garage-0 --container garage -- /garage status
# ==== HEALTHY NODES ====
# ID      Hostname  Address          Tags              Zone  Capacity
# e628..  garage-0  172.17.0.5:3901  NO ROLE ASSIGNED
# 570f..  garage-2  172.17.0.7:3901  NO ROLE ASSIGNED
# e199..  garage-1  172.17.0.6:3901  NO ROLE ASSIGNED
You can then follow the regular documentation to complete the configuration of your cluster.
If you target a production deployment, you should avoid binding admin rights to your cluster to create Garage's CRD. You will also need to expose some Services to make your cluster reachable. Keep also in mind that Garage is a stateful service, so you must be very careful of how you handle your data in Kubernetes in order not to lose it. In the near future, we plan to release a proper Helm chart and write "best practices" in our documentation.
If Kubernetes is not your thing, know that we are running Garage on a Nomad+Consul cluster, which is also well supported. We have not documented it yet but you can get a look at our Nomad service.
OpenTelemetry standardizes how software generates and collects system telemetry information, namely metrics, logs, and traces. By implementing this standard in Garage, we hope that it will help you to better monitor, manage and tune your cluster. Note that to fully leverage this feature, you must be already familiar with monitoring stacks like Prometheus+Grafana or ElasticSearch+Kibana.
To activate OpenTelemetry on Garage, you must add to your configuration file the following entries (supposing that your collector is also on localhost):
[admin]
api_bind_addr = "127.0.0.1:3903"
trace_sink = "http://localhost:4317"
The first line, api_bind_address, instructs Garage to expose an HTTP endpoint from which metrics can be obtained in Prometheus' data format.
The second line, trace_sink, instructs Garage to export tracing information to an OpenTelemetry collector at the given address.
These two options work independently and you can use them separately, depending on if you are interested only in metrics, traces, or both.
We provide some files to help you quickly bootstrap a testing monitoring stack. It includes a docker-compose file and a pre-configured Grafana dashboard. You can use them if you want to reproduce the following examples.
Grafana is particularly adapted to understand how your cluster is performing from a "bird's eye view". For example, the following graph shows S3 API calls sent to your node per time unit. You can use it to better understand how your users are interacting with your cluster.
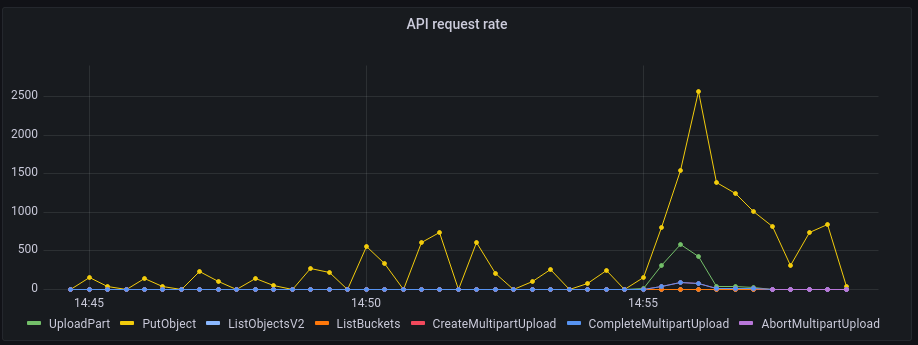
Thanks to this graph, we know that starting at 14:55, an important upload has been started. This upload is made of many small files, as we see many PutObject calls that are often used for small files. It also has some large objects, as we observe some multipart uploads requests. Conversely, at this time, no reads are done as the corresponding read endpoints (ListBuckets, ListObjectsV2, etc.) receive 0 request per time unit.
Garage also collects metrics from lower-level parts of the system. You can use them to better understand how Garage is interacting with your OS and your hardware.
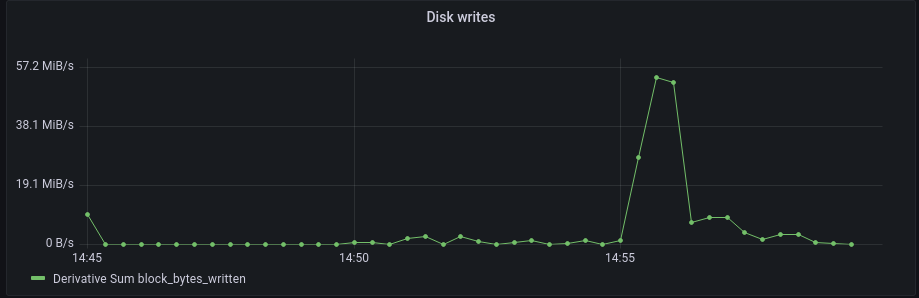
This plot has been captured at the same moment as the previous one. We do not see a correlation between the writes and the API requests for the full upload but only for its beginning. More precisely, it maps well to multipart upload requests, and this is expected. Large files (of the multipart uploads) will saturate the writes of your disk but the uploading of small files (via the PutObject endpoint) will be limited by other parts of the system.
This simple example covers only 2 metrics over the 20+ ones that we already defined, but it still allowed us to precisely describe our cluster usage and identify where bottlenecks could be. We are confident that cleverly using these metrics on a production cluster will give you many more valuable insights into your cluster.
While metrics are good for having a large, general overview of your system, they are however not adapted for digging and pinpointing a specific performance issue on a specific code path. Thankfully, we also have a solution for this problem: tracing.
Using Application Performance Monitoring (APM) in conjunction with Kibana, we can get for instance the following visualization of what happens during a PutObject call (click to enlarge):
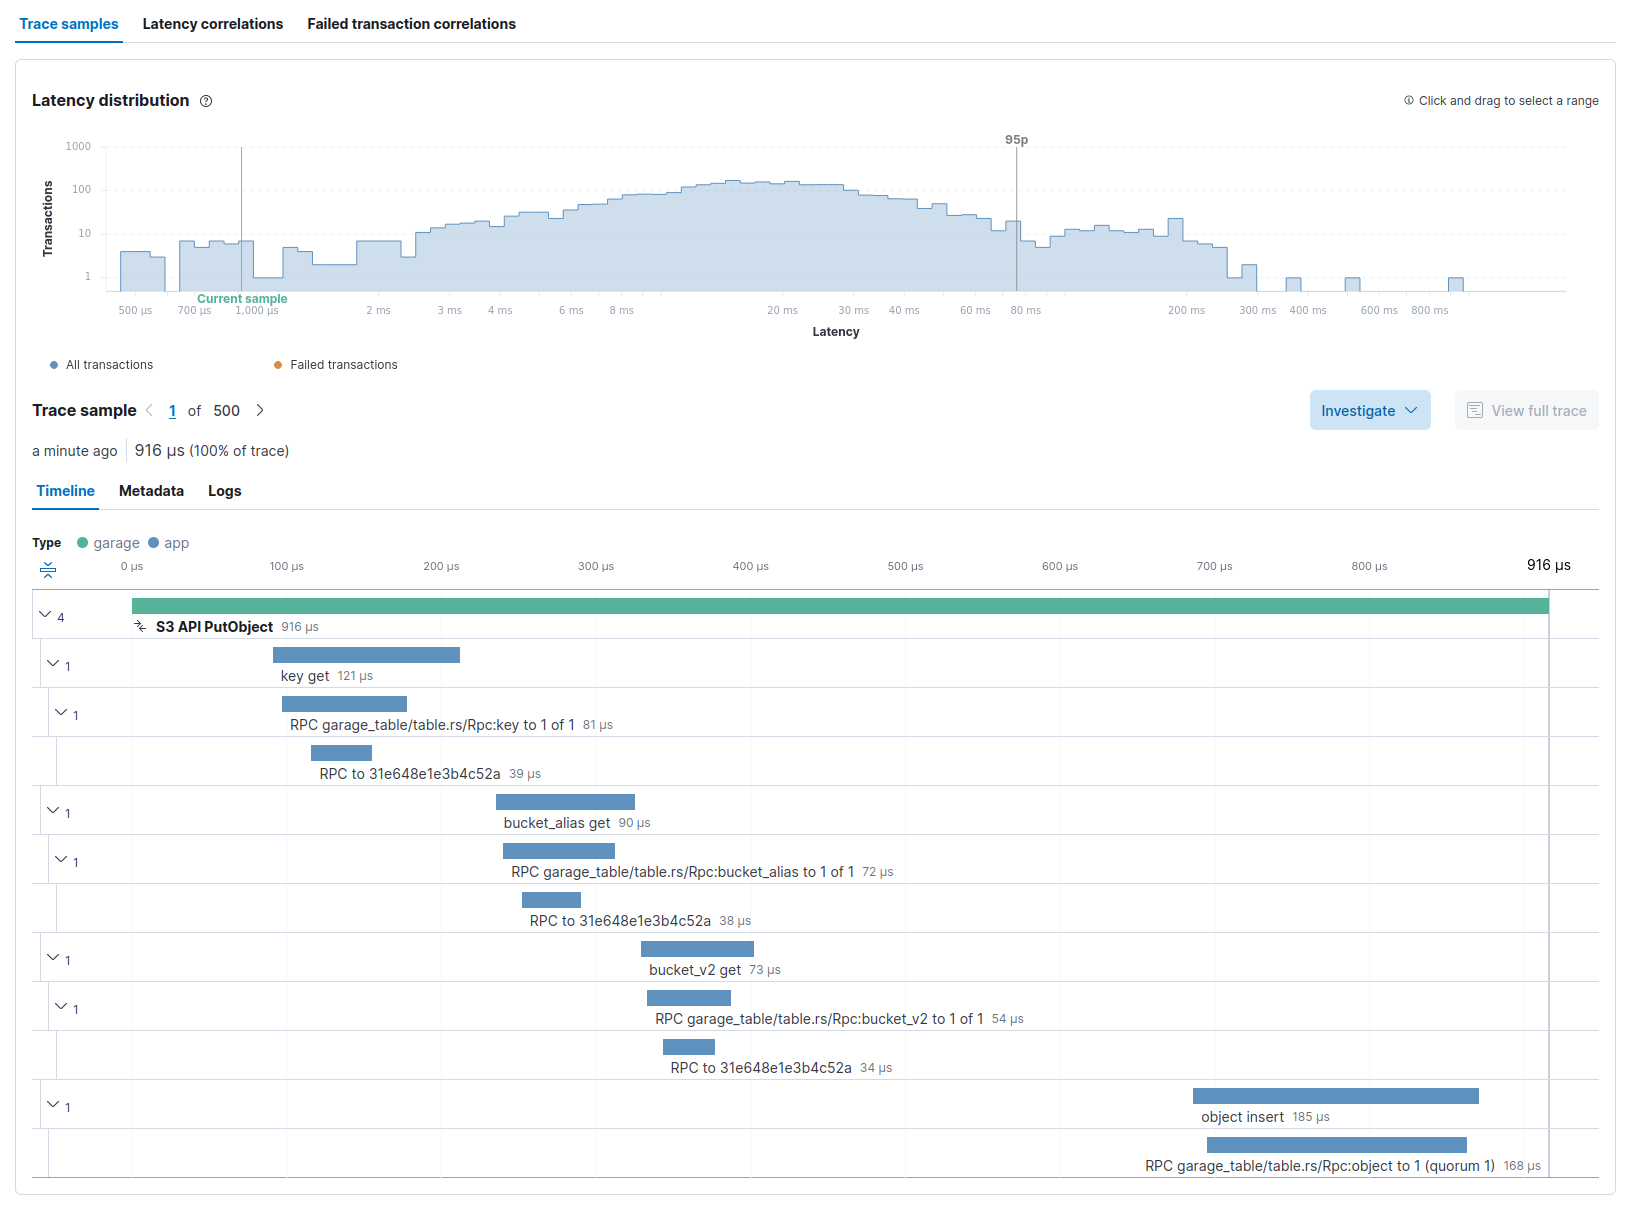
On the top of the screenshot, we see the latency distribution of all PutObject requests. We learn that the selected request took ~1ms to execute, while 95% of all requests took less than 80ms to run. Having some dispersion between requests is expected as Garage does not run on a strong real-time system, but in this case, you must also consider that a request duration is impacted by the size of the object that is sent (a 10B object will be quicker to process than a 10MB one). Consequently, this request probably corresponds to a very small file.
Below this first histogram, you can select the request you want to inspect, and then see its trace on the bottom part.
The trace shown above can be broken down in 4 parts: fetching the API key to check authentication (key get), fetching the bucket identifier from its name (bucket_alias get), fetching the bucket configuration to check authorizations (bucket_v2 get), and finally inserting the object in the storage (object insert).
With this example, we demonstrated that we can inspect Garage internals to find slow requests, then see which codepath has been taken by a request, and finally identify which part of the code took time.
Keep in mind that this is our first iteration on telemetry for Garage, so things are a bit rough around the edges (step-by-step documentation is missing, our Grafana dashboard is a work in progress, etc.). In all cases, your feedback is welcome on our Matrix channel.
This is only the first iteration of the Kubernetes and OpenTelemetry integrations in Garage, so things are still a bit rough. We plan to polish their integration in the coming months based on our experience and your feedback.
You may also ask yourself what will be the other works we plan to conduct: stay tuned, we will soon release information on our roadmap! In the meantime, we hope you will enjoy using Garage v0.7.
此内容由惯性聚合(RSS阅读器)自动聚合整理,仅供阅读参考。 原文来自 — 版权归原作者所有。