


Henrik Dafgård
Containerized application crashes due to exceeding memory limits are often tricky to investigate as they can be caused by different underlying issues. A program might not be freeing memory properly, or it might just not be configured with appropriate memory limits. Investigation methods also differ based on the language and runtime your program uses. Depending on the specific cause, you might need to use runtime metrics, traces, or profiles to understand if an increase in retained memory is correlated with an increase in operations handled or an aberrant behavior in the application. If you don’t have very deep knowledge of the technology your program is built on, identifying the best data for investigating a memory issue can be difficult and delay remediation.
To help speed up this process of identifying the root cause of memory-related issues, Datadog service pages in the Service Catalog now include a Memory Leaks section for services using supported runtimes and environments. This section centralizes data collected via Datadog’s integrations and Continuous Profiler to visualize the memory usage and configuration of that particular service. It then walks through a guided, step-by-step investigation workflow, providing context and curated information that helps you understand what data to look at and how to interpret it. This helps you more quickly identify the cause of your service’s memory leak and how best to remediate it.
In this post, we’ll walk through an example of using Datadog’s Memory Leaks workflow to investigate an issue with a service written in Go.
Let’s say you are alerted to a spike in container restarts for one of your Go services. Or, you are alerted to increased latency or errors due to containers being OOM killed. Memory leaks are a common cause of these types of problems, but it can be challenging to confirm that this is the case and then to isolate where the leak is occurring. To start investigating, you can navigate to the relevant service page, which centralizes telemetry data from your service, including deployments, endpoint traffic, infrastructure metrics, and more. The Memory Leaks section visualizes specific data tailored to help you identify whether your application is experiencing a memory leak.
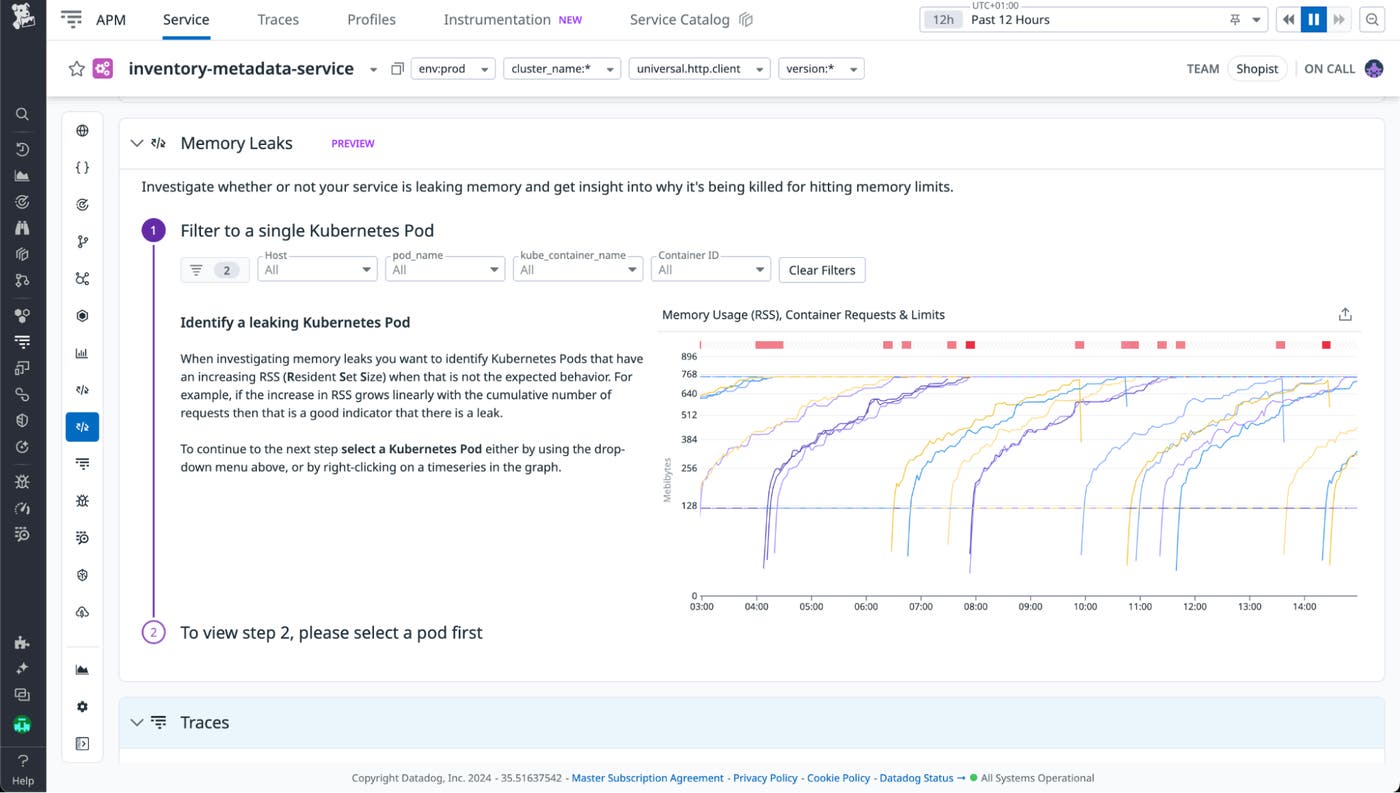
You can easily start the investigation by viewing the RSS (retained set size, or amount of memory being actively used) for all pods in your environment, scoped to the service in question. This enables you to easily see outliers and drill down into any pods showing an increase. If you also enable the Datadog OOM Kill integration you will see a clear overlay on this graph showing when a particular container was killed due to reaching its memory limit.
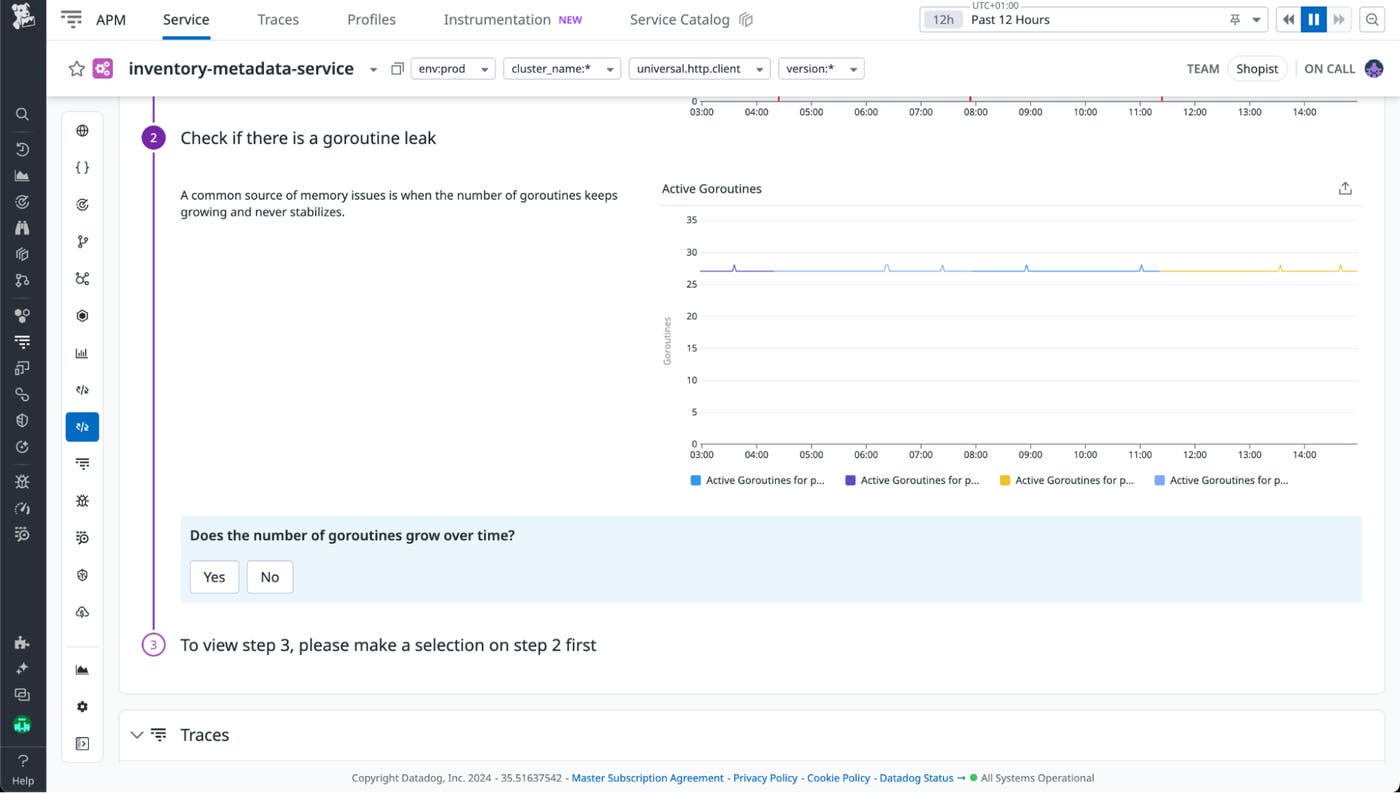
Once you have selected a pod, the next step immediately displays a graph of the number of active goroutines running on that pod, as shown here. If this is growing, then selecting “Yes” will display flame graphs of the active goroutines from earlier in the container lifecycle compared to later to visualize the increase and show what goroutines are running. In this particular case, however, we can see that the count is stable, so we select “No.”
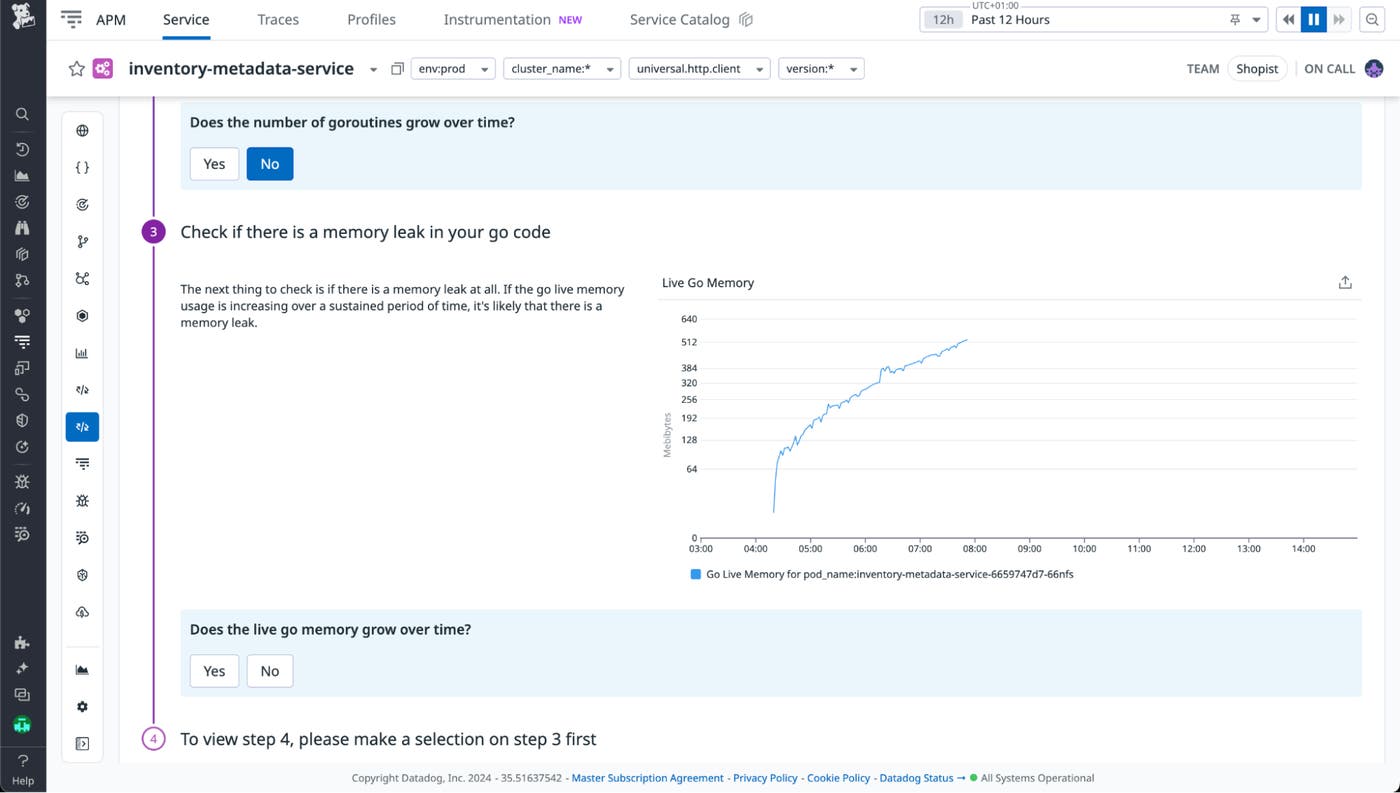
The next step displays your app’s live memory set, or the amount of memory that was still in use after a garbage collection cycle. Here we can see a stable growth over time, so we select “Yes.”
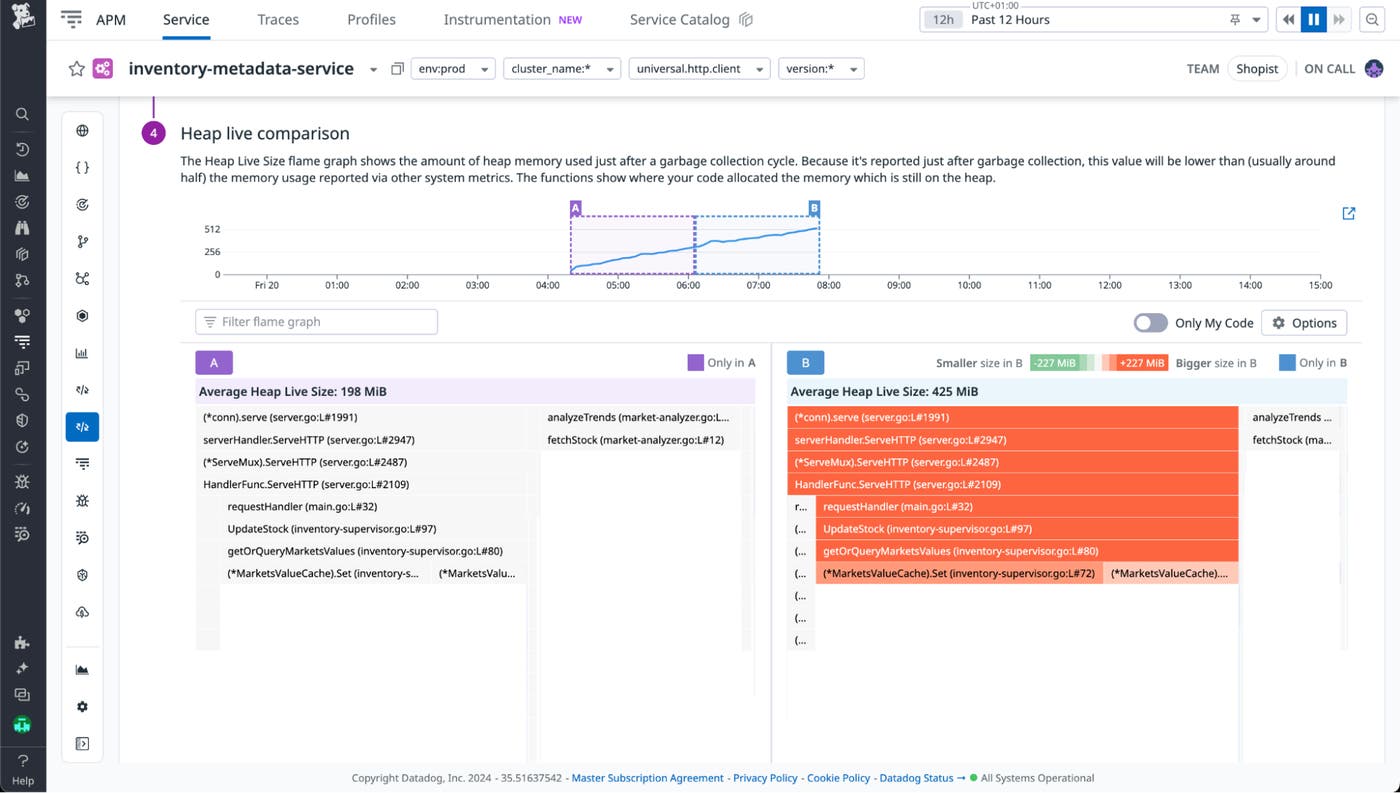
This shows us a color-coded comparison flame graph. The graph on the left shows the stack traces for where objects that were live earlier in the container lifecycle were allocated. The right-hand graph shows the same objects later on. The orange coloring on the right-hand side shows us that there is a clear increase. We can see that memory allocated by getOrQueryMarketsValues into a cache (MarketsValueCache) is being retained more and more over time, thus it’s very likely that this cache is misconfigured and retaining memory that it should release. Using Datadog’s source code integration, we can easily see exactly where in our code we need to make changes to fix the problem.
Datadog’s Memory Leaks workflow assists developers in investigating memory leaks in production environments by providing one place to view all the relevant data and key context. Using this guide, developers can identify and resolve memory leaks faster and improve service health. See our documentation to enable Datadog Continuous Profiler for your Go or Java service today. If you’re not a customer, sign up for a free 14-day trial.
此内容由惯性聚合(RSS阅读器)自动聚合整理,仅供阅读参考。 原文来自 — 版权归原作者所有。