


A Kubernetes environment includes a wide range of resources—such as clusters, nodes, and pods—that work together to run dynamic applications at scale. In order to monitor a Kubernetes application effectively, you need a multi-dimensional view into your clusters’ health that encompasses the complex dependency relationships among these resources.
Datadog Live Containers already offers real-time visibility into your Kubernetes environments, which can be scoped to any infrastructure layer or resource type. Now, we’re pleased to announce that we’ve extended Live Containers with support for RBAC and storage resources, so you can monitor your security and storage configurations. We’ve also introduced the Related Resources Map, which makes it easier to navigate through each layer of your clusters and access critical information—such as performance metrics, related traces and logs, network telemetry, and configuration details.
In this post, we’ll walk through how these new improvements to Live Containers help you maintain a holistic view of your workloads and monitor the health and performance of their constituent resources.
Datadog Live Containers provides a bird’s-eye view of key metrics and metadata for each of the various resource types that make up your workloads, from containers and clusters to pods and jobs. For example, you can track live CPU, memory, and pod usage metrics at the cluster level, or watch for pods that failed to start due to ImagePullBackOff errors. You can easily pivot between resource types using the sidebar menu, which now nests many of them into broader categories (Workloads, Network, Storage, and Access Control).
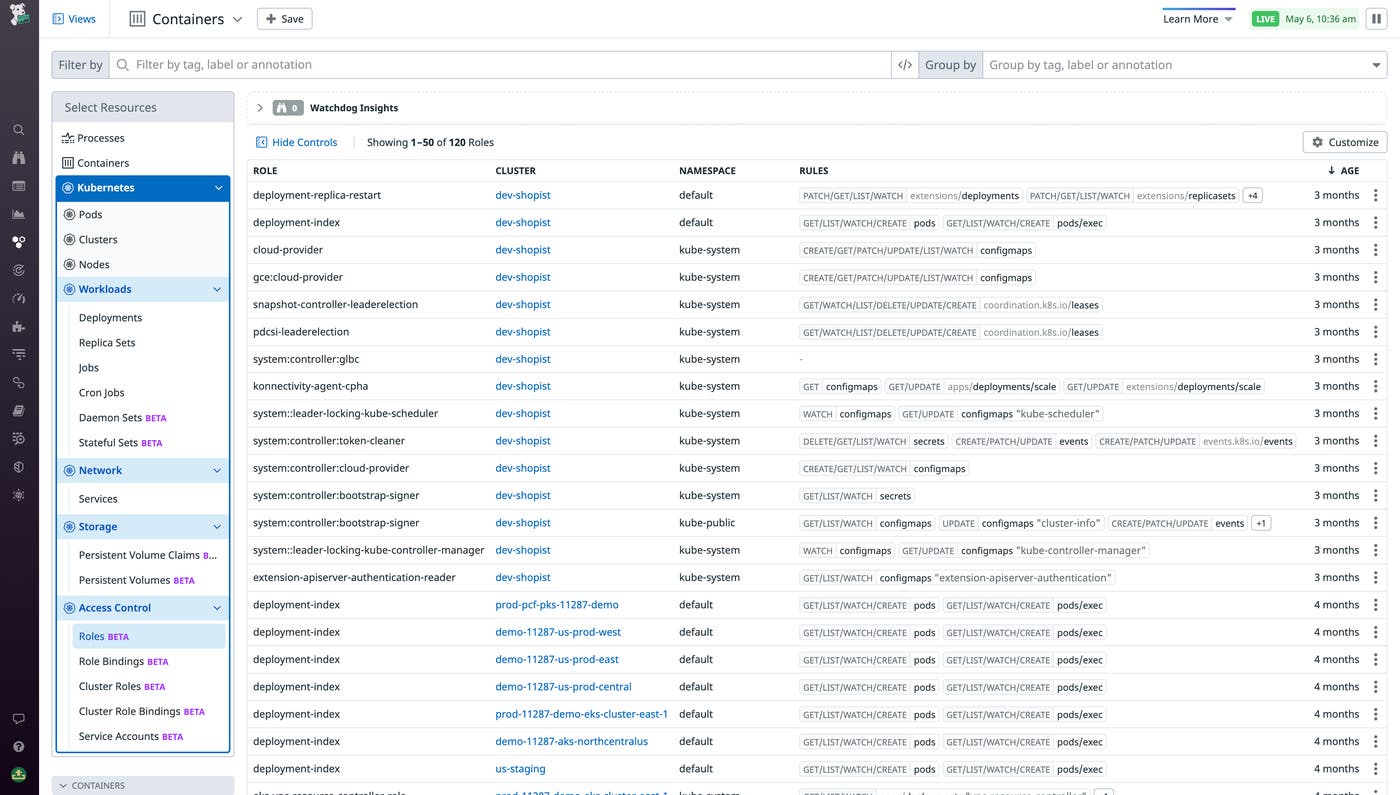
The Access Control category now includes RBAC resources, including Roles, RoleBindings, ClusterRoles, ClusterRoleBindings, and ServiceAccounts. You can click on any of these resource types to view key configuration details for each individual instance. For example, you can see each role’s configured rules (i.e., which resources the role can create, fetch, update, or delete), as well as its cluster and namespace. This information enables you to more easily ensure that each of your roles has the required permissions and that no users have unauthorized access.
You can also select PersistentVolumes (PVs) and PersistentVolumeClaims (PVCs) from the Storage category in order to view configuration details, such as their storage capacity, access modes, reclaim policy, and binding status. This data can help you ensure that your volumes are configured properly (e.g., with the correct access modes and enough allocated storage) and that they are able to successfully bind to their cluster. Or, when you are in the process of removing a volume from one of your clusters, you can monitor that volume’s status and confirm that it’s properly deallocated. If the PVC for that volume remains active, you can use the dropdown in the details panel to check if any pods are still communicating with it when they shouldn’t be.
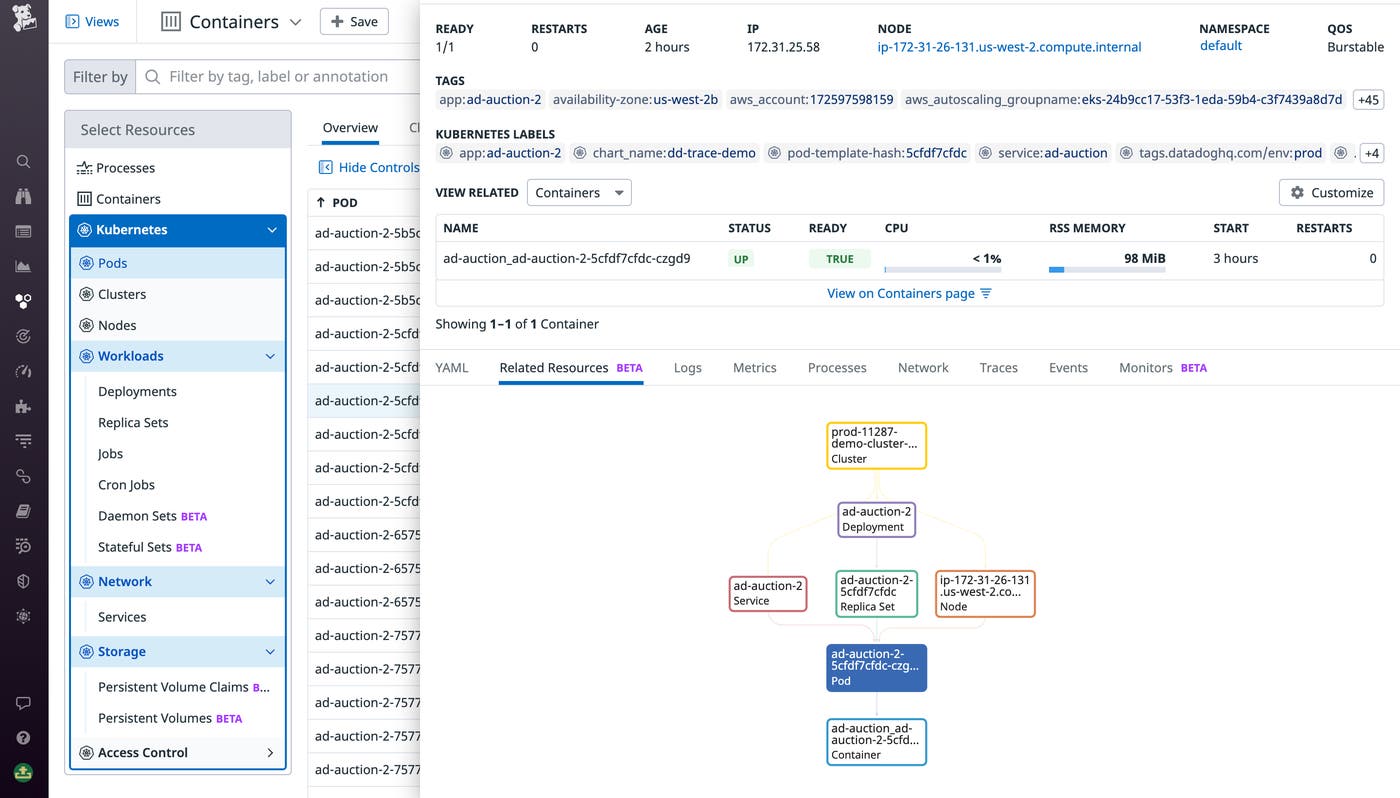
In addition to providing support for new resource types, we’ve also added the Related Resources Map to each resource’s details panel. This tool, which visualizes your resources’ dependency relationships and enables you to easily navigate between them, is particularly useful for onboarding new team members who need to quickly learn the architecture of complex Kubernetes deployments.
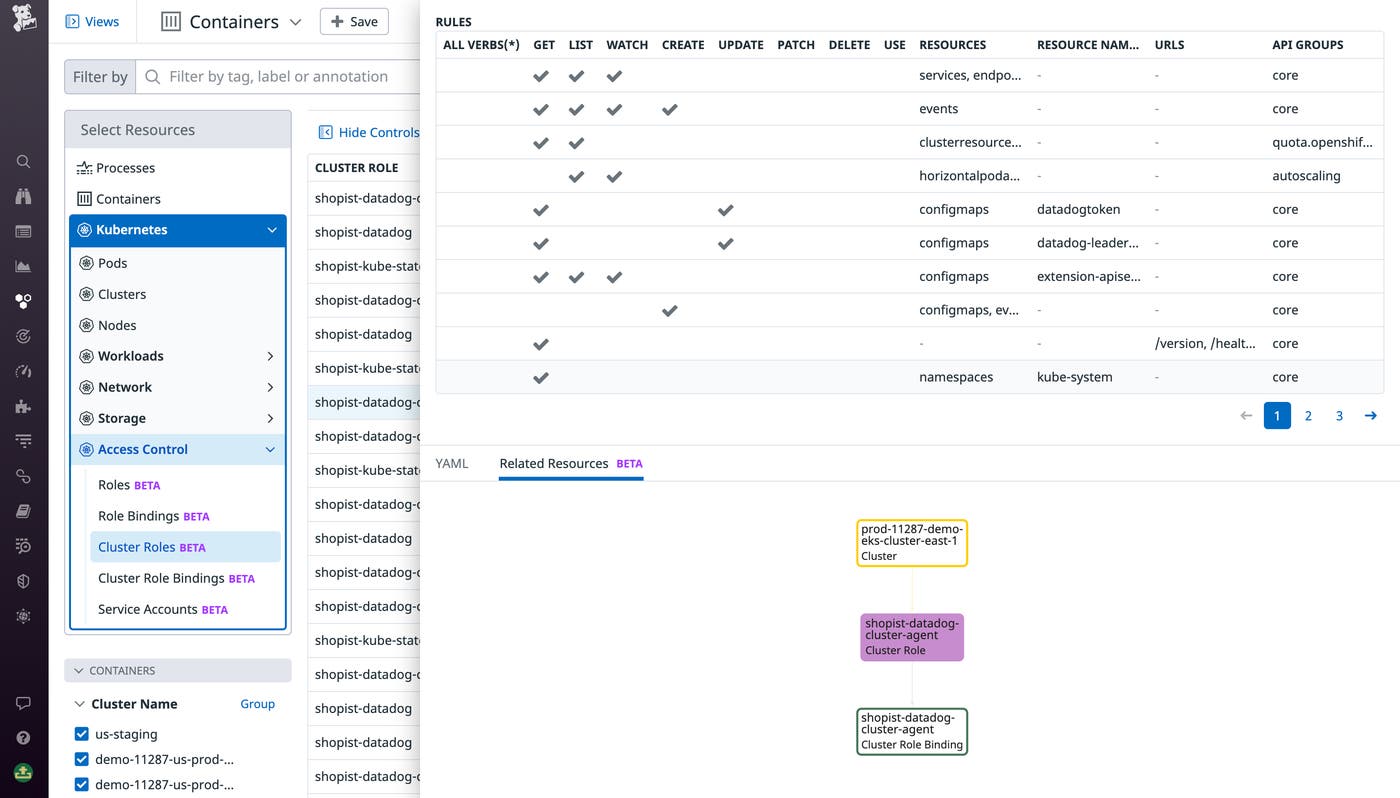
The map can also help you answer a number of common troubleshooting questions. For example, when viewing a Role or ClusterRole on the map, you can immediately see each of its associated bindings (as shown in the screenshot above). This helps you understand whether or not the correct access control permissions for a cluster are properly allocated without having to leave Datadog and manually dig through YAML files. You can also use the map to spot problematic configurations, such as a service account that was improperly given cluster-level admin privileges.
The map can also help you sanity-check that your pods are properly associated with a Kubernetes service. Each service is configured with a label selector, which targets specific pods that will receive a stable IP address. This IP address facilitates consistent communication across a cluster, even as pods scale up and down. A pod that is incorrectly labeled will not be connected to a service, which means it won’t be able to communicate with other pods or external services. If a pod is properly connected to a service, the Related Resources Map will visualize the link between them, as shown in the screenshot below.
Datadog Live Containers offers curated views for every layer of your Kubernetes applications, and it now includes support for RBAC and storage resources. We’ve also added the Related Resources Map to help you easily navigate through your resources’ dependency relationships. This empowers every engineer in your organization to effectively own the operation and maintenance of your complex containerized workloads—and reduces the time needed to surface and resolve critical issues.
Live Containers is generally available for all Infrastructure Monitoring customers, and the Related Resources Map is currently in public beta. For more information, see our documentation. To learn more about safely scaling Kubernetes systems, check out this recent talk from John Kendall, Datadog’s Senior Product Manager for containers. Or, if you’re brand new to Datadog, you can get started with a free trial.
此内容由惯性聚合(RSS阅读器)自动聚合整理,仅供阅读参考。 原文来自 — 版权归原作者所有。