惯性聚合 高效追踪和阅读你感兴趣的博客、新闻、科技资讯
阅读原文 在惯性聚合中打开

推荐订阅源

Forbes - Security
Forbes - Security
CTFtime.org: upcoming CTF events
F
Fortinet All Blogs
B
Blog
T
The Blog of Author Tim Ferriss
Engineering at Meta
Engineering at Meta
GbyAI
GbyAI
Y
Y Combinator Blog
Microsoft Azure Blog
L
LangChain Blog
Recent Announcements
U
Unit 42
Martin Fowler
Martin Fowler
M
MIT News - Artificial intelligence
让小产品的独立变现更简单 - ezindie.com
The Register - Security
Recorded Future
Recorded Future
C
Check Point Blog
V
V2EX
奇客Solidot–传递最新科技情报
奇客Solidot–传递最新科技情报
Hugging Face - Blog
Hugging Face - Blog
WordPress大学
WordPress大学
Google DeepMind News
酷 壳 – CoolShell
酷 壳 – CoolShell
F
Full Disclosure
小众软件
小众软件
A
About on SuperTechFans
云风的 BLOG
云风的 BLOG
宝玉的分享
宝玉的分享
Last Week in AI
Last Week in AI
有赞技术团队
有赞技术团队
MongoDB | Blog
MongoDB | Blog
爱范儿
爱范儿
P
Proofpoint News Feed
罗磊的独立博客
量子位
D
Docker
博客园_首页
D
DataBreaches.Net
Project Zero
Project Zero
博客园 - 司徒正美
Threat Intelligence Blog | Flashpoint
博客园 - Franky
Security Latest
Security Latest
cs.AI updates on arXiv.org
N
Netflix TechBlog - Medium
K
KPMG report finds enterprise disconnect between AI and its ROI | CIO
博客园 - 三生石上(FineUI控件)
H
Hackread – Cybersecurity News, Data Breaches, AI and More
大猫的无限游戏
大猫的无限游戏

Datadog | The Monitor blog

Introducing our open source AI-native SAST Instrument and monitor Boomi integration flows with OpenTelemetry and Datadog Not all index scans are equal: How we cut query latency by over 99% Platform engineering metrics: What to measure and what to ignore Integrate Recorded Future threat intelligence with Datadog Cloud SIEM CI/CD security: threat modeling using a MITRE-style threat matrix CI/CD security: How to secure your GitHub ecosystem Ingress NGINX is EOL: A practical guide for migrating to Kubernetes Gateway API Operating agentic AI with Amazon Bedrock AgentCore and Datadog LLM Observability: Lessons from NTT DATA Introducing the Datadog Code Security MCP Capture and analyze custom heatmaps in Session Replay Understand session replays faster with AI summaries and smart chapters Monitor ClickHouse query performance with Datadog Database Monitoring How we designed empathetic alert sounds for on-call engineers Search and act across Datadog to resolve issues faster with Bits Assistant Measure the business impact of every product change with Datadog Experiments Analyzing round trip query latency Configuring JavaScript caches for better performance Introducing Bits AI Dev Agent for Code Security Datadog achieves ISO 42001 certification for responsible AI Monitor Nutanix clusters, hosts, and VMs with Datadog Monitor Juniper Mist in Datadog A new Host Map for modern infrastructure Annotate traces to improve LLM quality with Datadog LLM Observability What’s new in Cloud SIEM: AI-powered investigations, enhanced threat intelligence, and scalable security operations Explore Kubernetes with native OpenTelemetry data Monitor Oracle Fusion Cloud Applications with Datadog Announcing the Datadog Terraform provider v4.0.0 Scaling Kubernetes workloads on custom metrics How to design cloud environments for AI-powered threat analysis Monitor Aruba Central in Datadog How we centralize and remediate risks with Datadog Case Management Accelerate incident response with Datadog and ServiceNow Monitor your application and network load balancer logs Understanding Karpenter architecture for Kubernetes autoscaling Tools for collecting metrics and logs from Karpenter Monitor Karpenter with Datadog What your product data is actually saying Key metrics for monitoring Karpenter Securing Datadog’s platform in the AI age: The role of observability data Four ways engineering teams use the Datadog MCP Server to power AI agents Approaching your observability migration with the right mindset Meet the new Bits AI SRE: Deeper reasoning, twice as fast Key learnings from the 2026 State of DevSecOps study Use plain English to query your multi-cloud infrastructure in Resource Catalog Simplifying troubleshooting across the user journey with Datadog Synthetic Monitoring Protect your OCI resources with Datadog Cloud Security This Month in Datadog - February 2026 Amazon EC2 security: How misconfigured and public AMIs expand your cloud attack surface Enable end-to-end visibility into your Java apps with a single command Measure and improve mobile app startup performance with Datadog RUM Evaluating our AI Guard application to improve quality and control cost Identify untested code across every level of your codebase Make use of guardrail metrics and stop babysitting your releases Monitor Versa Networks SD-WAN performance in Datadog Improve performance and reliability with APM Recommendations Remediate transitive vulnerabilities faster with Datadog Software Composition Analysis Generate audit-ready vulnerability and compliance reports with Datadog Sheets Monitor Fortinet FortiManager performance in Datadog Improve test coverage across codebases with Datadog Code Coverage Move fast, don’t break things: Consistent testing standards at scale Enrich logs with ServiceNow CMDB context before routing to any SIEM or logging tool Monitor Lustre with Datadog Make faster, better product decisions with Datadog Product Analytics Surface and remediate runtime posture issues with Workload Protection Findings Protect agentic AI applications with Datadog AI Guard How to optimize JavaScript code with CSS Trace Google Pub/Sub workloads in Cloud Run with Datadog Detect human names in logs with ML in Sensitive Data Scanner How we cut our NLQ agent debugging time from hours to minutes with LLM Observability Debug PostgreSQL query latency faster with EXPLAIN ANALYZE in Datadog Database Monitoring Datadog acquires Propolis Unify and correlate frontend and backend data with retention filters Scale compliance across global frameworks with Datadog Cloud Security Monitor Arista VeloCloud SD-WAN performance with Datadog Building reliable dashboard agents with Datadog LLM Observability Simplify log collection and aggregation for MSSPs with Datadog Observability Pipelines Mitigation for Node.js denial-of-service vulnerability affecting Datadog APM Automate flaky test fixes with the Bits AI Dev Agent and Test Optimization How we built an AI SRE agent that investigates like a team of engineers Datadog integrations 2025 recap: Observability for AI, security, and hybrid cloud Design effective executive dashboards with Datadog Implement dbt data quality checks with dbt-expectations Bring faster visibility into AWS Lambda functions with remote instrumentation Troubleshoot faster with the GitLab Source Code integration in Datadog How Cambia Health Solutions saved $30,000 monthly with Cloud Cost Management and the Datadog Resource Catalog Normalize any logs for Cloud SIEM with Datadog's OCSF processor Optimizing Datadog at scale: Cost-efficient observability at Zendesk Detect, diagnose, and resolve network issues easily with CNM Network Health Connect engineering errors to user impact in early-stage products Cilium configuration for Kubernetes operations at scale Designing feedback loops for progressive delivery Ship features faster and safer with Datadog Feature Flags Choosing the right OpenTelemetry Collector distribution Route your monitor alerts with Datadog monitor notification rules Automate Cloud SIEM investigations with Bits AI Security Analyst Cloud threat detection: How to identify risky activity across control and data planes Collecting Kafka performance metrics Monitoring Kafka with Datadog Monitoring Kafka performance metrics
Autonomously optimize AWS Lambda deployments with Sedai and Datadog
Thomas Sobolik · 2023-02-24 · via Datadog | The Monitor blog

In dynamic production environments, unpredictable traffic loads and frequent code changes can make it difficult for organizations to consistently optimize their cloud infrastructure, resulting in application performance issues, latency, and wasted cloud spend. Teams that manage large-scale cloud infrastructure deployments are often forced to tune their workloads’ configurations using a complicated mesh of script jobs—or worse, manual remediation by on-call engineers prompted by alerts. Although serverless platforms such as AWS Lambda self-manage many operations behind the scenes, Lambda workloads come with a unique set of challenges and variables that typically aren’t optimized by using the default settings, including:

  • Rightsizing function memory to meet demand

  • Managing provisioned concurrency and warmups to prevent cold starts

  • Setting appropriate timeout limits

  • Mitigating out-of-memory errors

The advent of autonomous cloud management platforms powered by machine learning (ML) has enabled organizations to continuously optimize their modern applications based on container or serverless architectures. These tools help teams achieve the appropriate balance of performance and cost—and remediate issues—while reducing the manual effort required to maintain these complex systems. Sedai leverages data from monitoring services (including Datadog) to autonomously optimize the configuration of several key cloud infrastructure platforms, including AWS Lambda. By autonomously optimizing your configurations and remediating issues, Sedai helps your teams reduce cloud costs, improve application performance, and ensure high availability.

Sedai now integrates with Datadog out of the box and offers a subscription to their software in the Datadog Marketplace to automatically detect and analyze your Datadog-instrumented Lambda instances. Using the integration, you can configure Sedai to start optimizing your functions with minimal configuration overhead, and continuously monitor Sedai’s optimization actions from within Datadog. In this post, we’ll discuss how you can use Sedai with Datadog to:

  • Autonomously optimize Lambda functions for cost and performance

  • Autonomously detect and remediate issues with your Lambda deployments as they arise

Autonomously optimize Lambda functions for cost and performance

By configuring the integration, you can set up Sedai to continually ingest metrics—including request latency, job duration, errors, traffic volume, and more—from your Datadog-instrumented AWS Lambda deployments. Using these metrics, Sedai’s ML tools learn about your deployments’ behavior, detecting seasonalities and other trends. Sedai will then start taking autonomous actions to optimize your workloads, including:

  • Setting memory levels (and the associated hidden CPU) to optimize for peak performance, lowest cost, or a balance between the two

  • Tuning the concurrency of your functions to prevent cold starts when traffic spikes

Let’s say your team is using a Lambda function to analyze customer data for product recommendations in an ecommerce application, and monitoring this function using Datadog’s Lambda integration. Naturally, the volume of data processing that this function handles will scale up and down significantly depending on the amount of customer traffic your app is getting. With the Datadog Sedai integration, your team can quickly provision Sedai to begin analyzing the function’s performance. After Sedai’s ML algorithms complete a learning period, Sedai will take action to optimize the function’s memory, timeout settings, concurrency, and other parameters. These optimization actions are then recorded as Datadog events for visibility to the teams monitoring the application.

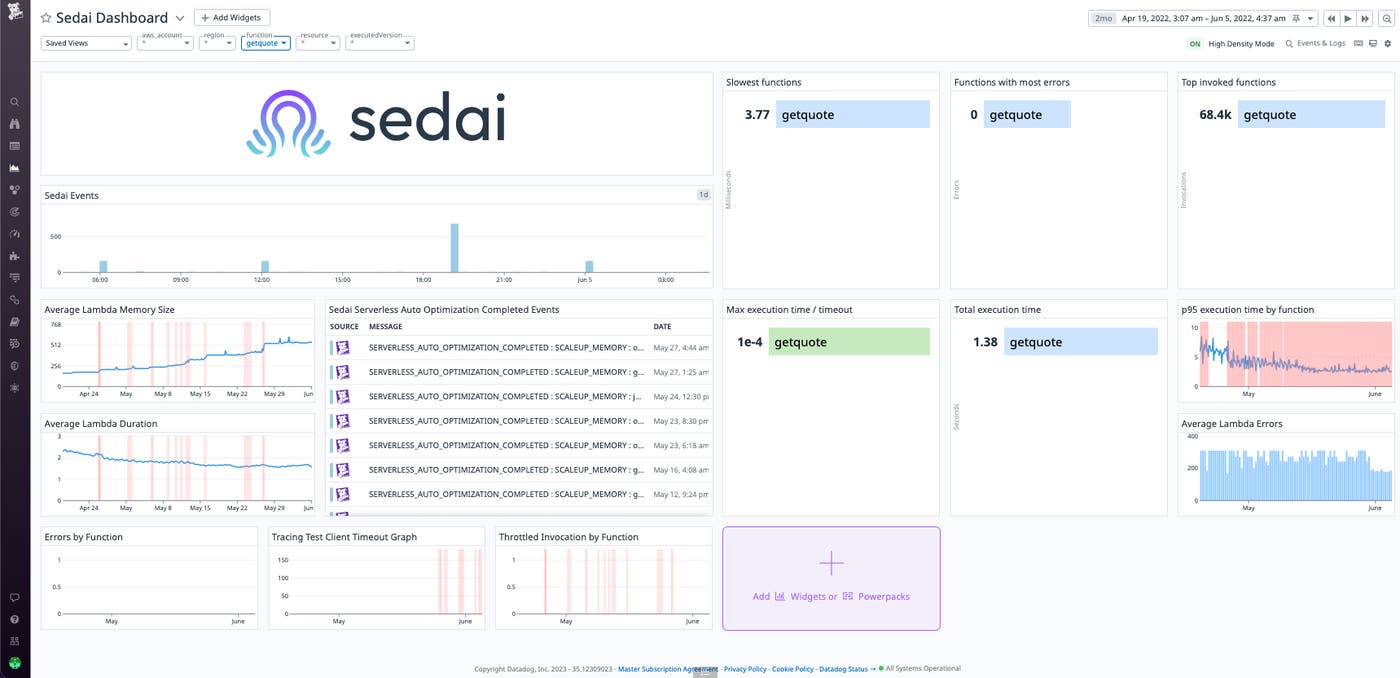
In an out-of-the-box dashboard, the owners of your product recommendation service can view infrastructure metrics being sent to Sedai alongside Datadog events that signal Sedai’s automated optimization actions. In the example shown below, we can observe an increase in the average allocated memory size of our getquote Lambda function in the graph widget labeled “Average Lambda Memory Size.” This corresponds with Sedai’s events automatically scaling up the memory allocation of that function, which are collected in the event stream widget labeled “Sedai Serverless Auto Optimization Completed Events.”

View infrastructure metrics being sent to Sedai alongside Datadog events that signal Sedai’s automated optimization actions

Sedai’s automated configuration management can continually tune the memory allocation, concurrency, and other configuration parameters for every function in your Lambda deployments. This includes purchasing optimization: Sedai’s autonomous concurrency management can purchase provisioned concurrency to lower the amount of pricier on-demand capacity required by your app to meet customer demand. This enables Sedai to fully own the configuration management process and continually optimize your infrastructure footprint, with no need for manual approval.

Autonomous systems free up SREs and DevOps staff to focus on the most important, new, and unique issues in their applications by taking care of a large volume of lower-level incidents that can be managed with machines. In addition to configuring your infrastructure in response to projected traffic patterns, Sedai also detects issues in serverless function metrics (including out-of-memory errors, timeouts, and throttling) and autonomously remediates them (allocating more memory, increasing the timeout threshold, and adding more reserved concurrency, respectively).

Datadog’s Sedai integration makes it easy for your teams to incorporate Sedai’s autonomous remediation capabilities into their existing incident response workflows. In addition to tracking Sedai’s remediation events in dashboards, you can also alert on them, or use Datadog’s Events Explorer to track them in a live feed alongside other triggered monitors, CI/CD updates, and configuration changes from across your infrastructure.

View infrastructure metrics being sent to Sedai alongside Datadog events that signal Sedai’s automated optimization actions

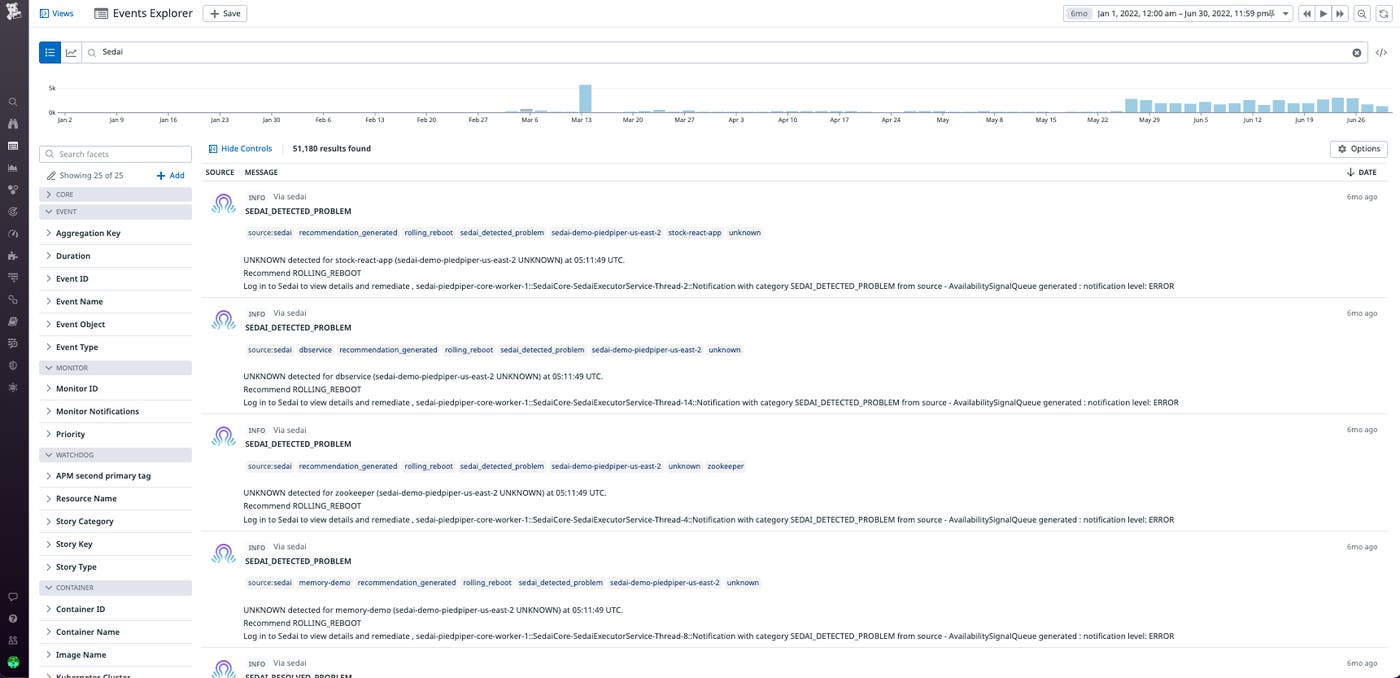
From both the Events view and a triggered monitor, your team members can see the incidents that were prevented or resolved by Sedai. When an issue arises that Sedai cannot address, you can quickly pivot to declare a new incident in Datadog Incident Management, and bring over key context such as error messages, relevant host and process names, and more. Datadog’s Incidents workflow makes it easy for an SRE or DevOps engineer to efficiently loop in teammates and begin tackling the problem. For more information, see our blog post on Datadog Incident Management.

Get started with autonomous management for your Lambda workloads

With its sophisticated ML tools, Sedai can save your SREs and DevOps personnel significant time and effort by autonomously optimizing your infrastructure configurations and detecting and resolving performance regressions—all while keeping your cloud costs as low as possible. Within minutes, you can set up Datadog’s Sedai integration to start autonomously managing your cloud workloads while also monitoring Sedai’s autonomous actions alongside telemetry from across your infrastructure. For more information about the integration, see Sedai’s blog post. And for help installing the integration, see our documentation.

The ability to develop and promote third-party tools in the Datadog Marketplace that extend the capabilities of Datadog is one of the benefits of membership in the Datadog Partner Network. You can learn more about the Datadog Marketplace in our blog post, and you can contact us at marketplace@datadog.com if you’re interested in developing an integration or application.

If you’re brand new to Datadog, sign up for a 14-day free trial to get started.