


Google Kubernetes Engine (GKE) is a managed Kubernetes service that enables users to deploy and orchestrate containerized applications on Google’s infrastructure. Datadog’s GKE integration, when paired with our Kubernetes integration, has always provided deep visibility into the health and performance of your clusters at the node, pod, container, and application levels. We’re pleased to announce that you can now monitor all of these components alongside new control plane metrics, directly through the GKE integration. We’ve also created two out-of-the-box GKE dashboards, which make it easy to keep tabs on your containerized workloads and visualize trends anywhere in your cluster.
Datadog’s GKE integration comes with two out-of-the-box dashboards (Standard and Enhanced) that visualize key cluster metrics.
The Standard dashboard uses Datadog’s GKE integration to provide visibility into your clusters’ health and performance at the node, pod, and container level. This enables you to monitor and alert on important GKE resource utilization metrics, like CPU, memory, volume, and ephemeral storage usage, as well as cluster health metrics, like container restart counts, within minutes of installing the GCP integration.
You can populate the Enhanced dashboard by deploying the containerized version of the Datadog Agent, which ingests additional metrics through Datadog’s Kubernetes integration and provides them at higher granularity and lower latency. This approach enables you to get even deeper visibility into your Kubernetes resources and workloads. For instance, our Kubernetes integration includes built-in support for Kubernetes State Metrics, so you can see detailed information about the status of your pods, nodes, and deployments without running a kube-state-metrics service within your cluster. The Agent also ingests Kubernetes logs and events, which you can correlate with distributed traces and service-level metrics from your containerized applications.
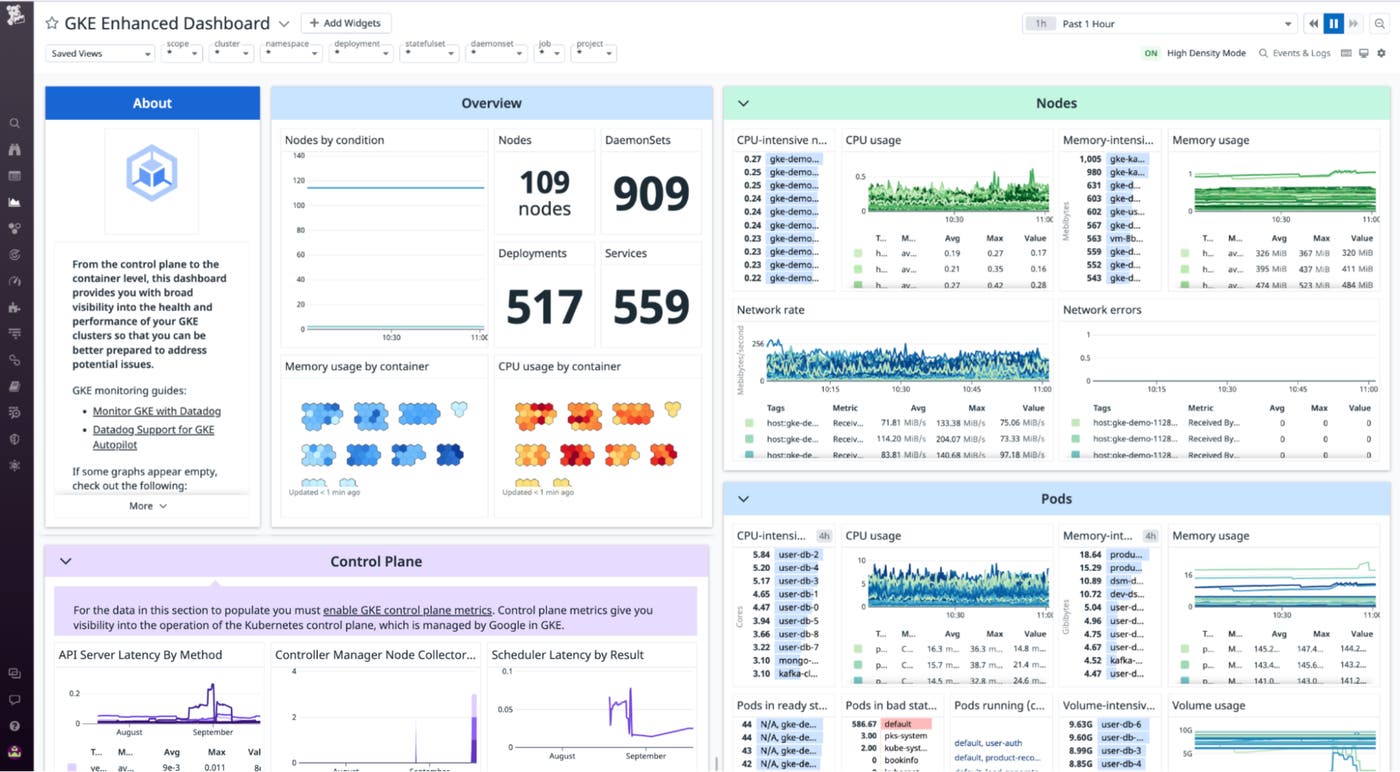
In a Kubernetes cluster, the control plane nodes are responsible for managing worker nodes, scheduling pods, and moving the cluster to a desired state. After enabling control plane metrics in your GKE cluster, our GKE integration is able to collect them through Google’s Cloud Monitoring API. Both of the out-of-the-box dashboards we discussed above display key metrics from the API server, scheduler, and controller manager. These metrics can reveal platform issues and provide additional context that can help you diagnose and debug issues in your GKE clusters.
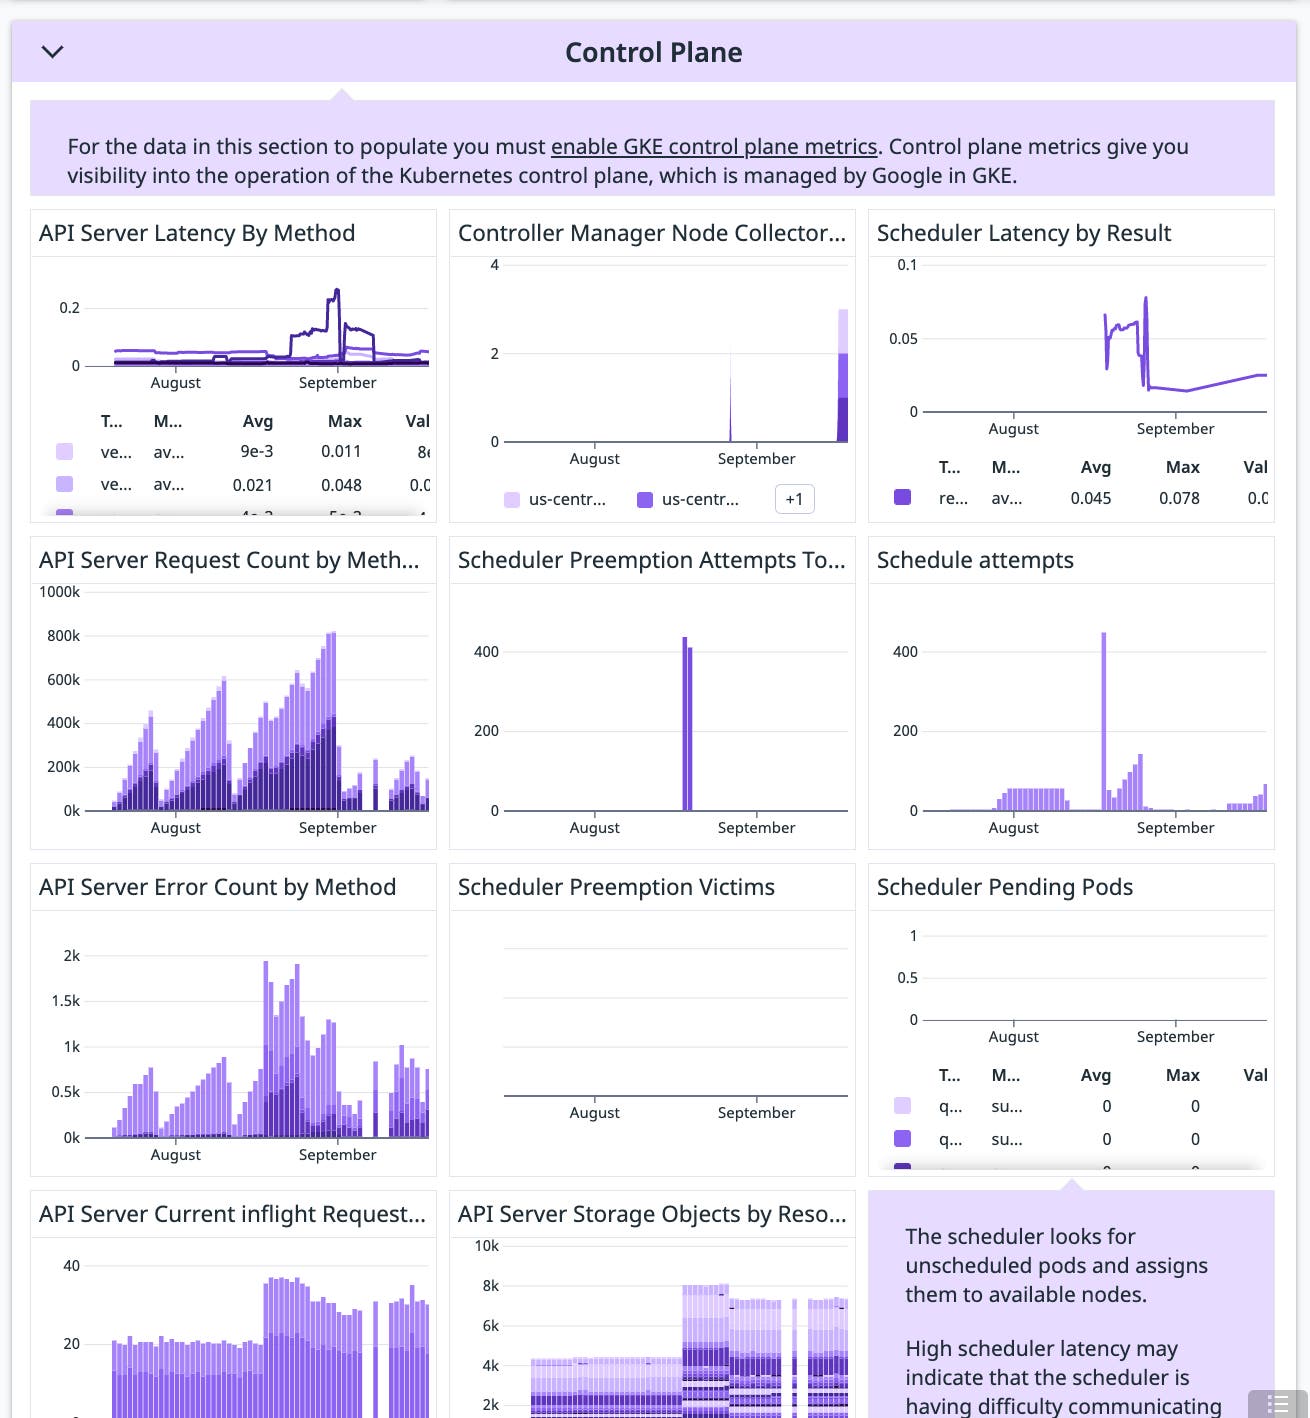
For example, API server metrics such as apiserver_request_total and apiserver_storage_objects provide key insight into cluster activity and whether your cluster can handle its current load. If you see the spikes in inflight requests are causing performance issues, you may need to evaluate your API Priority and Fairness settings to ensure large volumes of requests are limited. Likewise, an increase in storage objects may point to a custom controller that creates objects but doesn’t delete them. You can filter or group the metric by the resource label to identify the resource experiencing the increase.
Even if there are no issues with your cluster’s control plane components, their metrics can still help you diagnose workload issues. The scheduler, for example, is responsible for assigning pods to worker nodes that can satisfy their resource requirements. You can troubleshoot spikes in the number schedule attempts or latency by checking preemption activity.
Preemption metrics like scheduler_preemption_attempts_total and scheduler_preemption_victims provide insight into what may be happening in your cluster and what steps you might need to take. For example, if preemption attempts are rising but the number of victims remains stable, it means no more low-priority pods can be removed. In this case, add nodes to your cluster so that pods can be scheduled.
If both preemption attempts and victims are rising, higher-priority pods are still waiting to be scheduled and running pods are being preempted. You can correlate this with scheduler_pending_pods to determine whether the overall number of pending pods is increasing, which could mean your cluster does not have sufficient resources to schedule even the higher-priority pods. In that case, you might need to scale up the available resources, create new pods with reduced resource claims, or change the node selector.
If the values of these metrics are in line with expectations, you may need to reduce your pod resource requests or adjust other policy constraints. You can also correlate this metric with Kubernetes audit logs for additional insight into the source of the issue.
Datadog’s GKE integration, which is bundled together with our GCP integration, ingests key health and performance metrics from all of your Kubernetes resources, as well as your control plane components, and visualizes them on two out-of-the-box dashboards. To get started, simply install our GCP integration and configure your GKE cluster to export control plane metrics. You can also install the Datadog Agent on your cluster for even deeper visibility into your containerized workloads.
Not yet a Datadog customer? Get started with a 14-day free trial.
此内容由惯性聚合(RSS阅读器)自动聚合整理,仅供阅读参考。 原文来自 — 版权归原作者所有。