


Quentin Francois
Congratulations. You have successfully deployed your application on OpenShift. Now you want to monitor it like the rest of your infrastructure, without turning it into a weeklong project.
Once you add the Datadog cartridge to all of your gears, your OpenShift metrics will automatically show up in Datadog, where you can easily set up graphs and alerts to fit your needs. Note that this cartridge is designed to monitor OpenShift v2 gears, not v3 containers; however, you can instrument your OpenShift v3 apps to send custom metrics with the standalone DogStatsD image if desired.
Before we show how to set up the cartridge on your gears, let’s take a closer look at how Datadog can help you monitor OpenShift v2 performance.
Datadog collects metrics from OpenShift gears and any other servers running on-premise or on other cloud environments. These can all be seen on the same page and then filtered, based on metrics or tags related to these servers.
Here’s a clip from an infrastructure page, filtered to focus on two OpenShift gears running alongside 260 other servers:
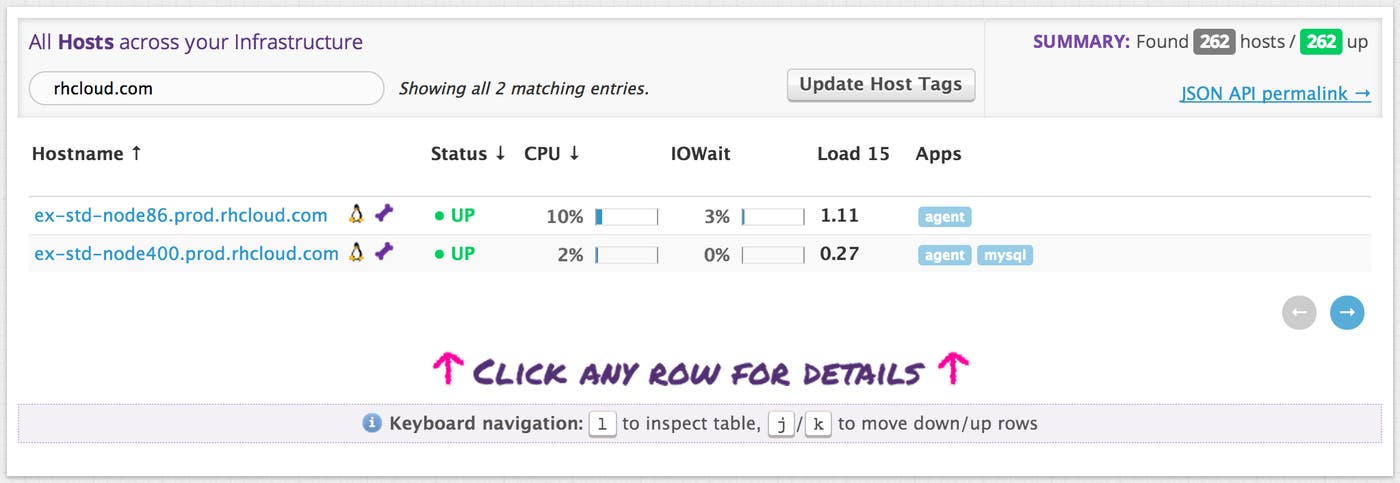
Immediately after the Datadog Agent is installed on an OpenShift gear, all system metrics will begin to flow into Datadog and become available for graphing and alerting.
You can set up alerts on any metric coming from your gears. If you have enabled Datadog integrations in the Agents running on your gears, you can alert on these metrics as well.
Here’s a simple example of an alert that will trigger when CPU usage goes above 10% for a specific gear:
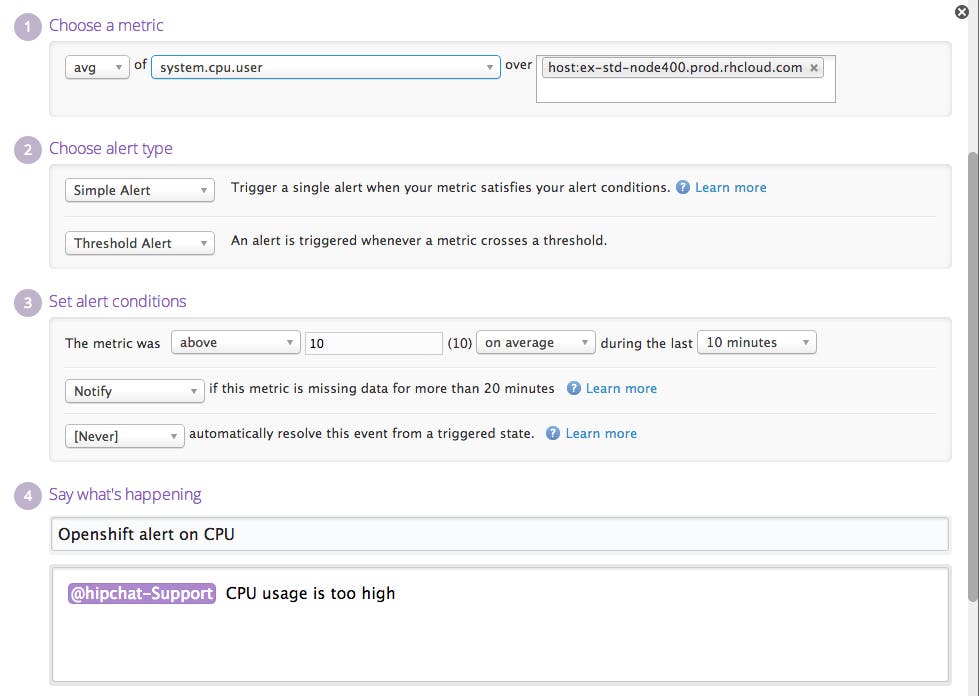
In addition to generating events in your stream, alerts can be sent through email, HipChat, PagerDuty, and other endpoints defined through our WebHooks integration.
Here is what happens when the alert in the example above triggers:
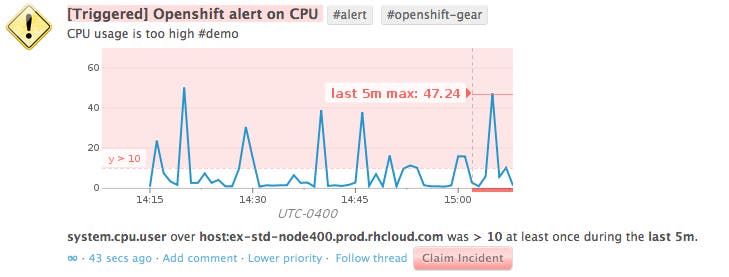
Interested in learning more about alerting? We have a guide to alerting.
Datadog will not only collect system metrics from your gears, but also the metrics and events from all of the systems in your environment. Here is an example of a MySQL dashboard after adding the MySQL cartridge to an OpenShift application:
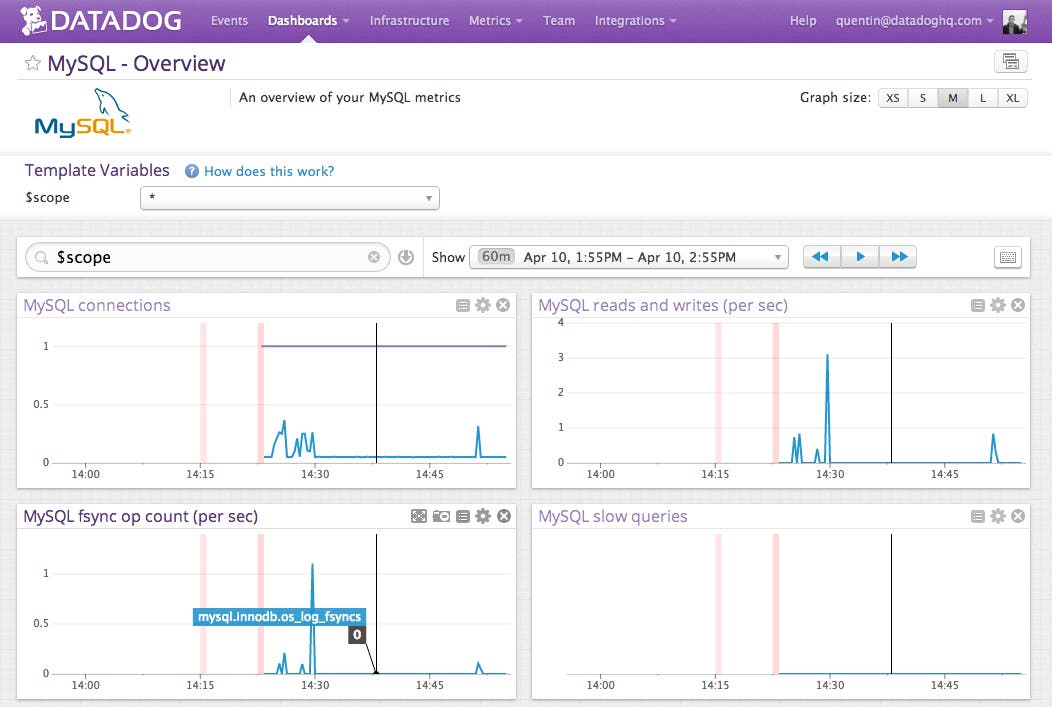
It’s a simple matter of editing a few YAML files in the Agent configuration directory: $OPENSHIFT_DATADOG_DIR/dd-agent/agent/conf.d/.
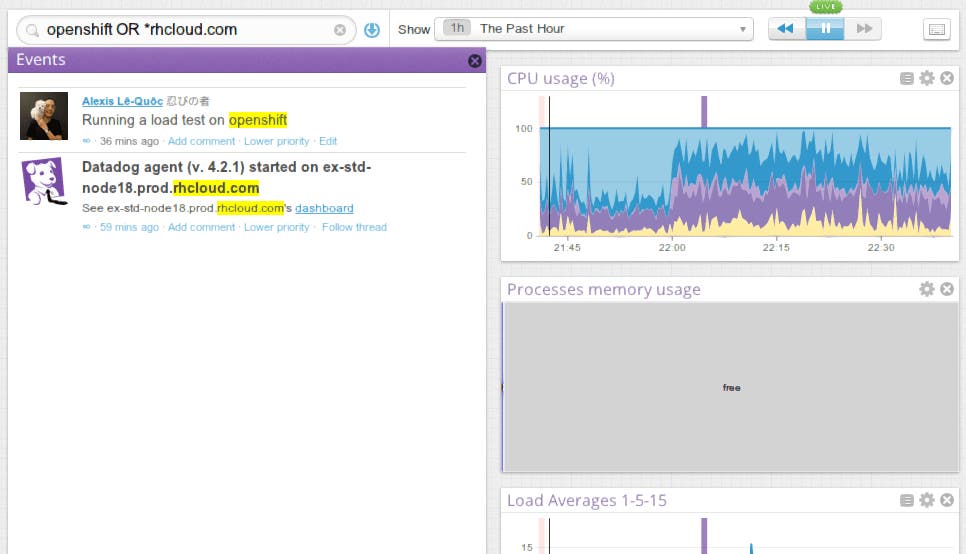
You can also correlate your collected OpenShift performance metrics with events from other systems, to determine whether another system or piece of infrastructure may have impacted OpenShift gears.
For example, here are some graphs from the integration with overlaid events. An event announcing the beginning of the load test is highlighted in purple and overlaid on the graphs:
If you’re running a scalable app, you probably don’t care so much about individual gears. With Datadog, your monitoring will automatically scale with the application because:
The Datadog cartridge is automatically deployed on all your gears
Graphs and dashboards support an arbitrary number of gears
Alerts monitor aggregate performance when you don’t care about specific gears.
For more information about advanced features, please consult our documentation.
The Datadog cartridge lets you install the Datadog Agent on your gears and collect metrics from your apps. This cartridge supports both scalable and non-scalable apps.
An OpenShift v2 app
The OpenShift RHC client tool
A Datadog account - sign up here, it’s free
Get your Datadog API key here and define the DATADOG_API_KEY environment variable in your OpenShift app:rhc set-env DATADOG_API_KEY=your_api_key -a myapp
Add the cartridge to your gear:rhc cartridge-add http://cartreflect-claytondev.rhcloud.com/github/datadog/datadog-openshift -a myapp
ssh to your gear to work with the Agent: ssh XXXXXXXXX@myapp.rhcloud.com. If you have trouble connecting to your gear, read this guide. You can use several commands to interact with the Agent:
$OPENSHIFT_DATADOG_DIR/bin/control start|stop|restart|status|info. Extra configuration files are located at $OPENSHIFT_DATADOG_DIR/dd-agent/agent/conf.d/.
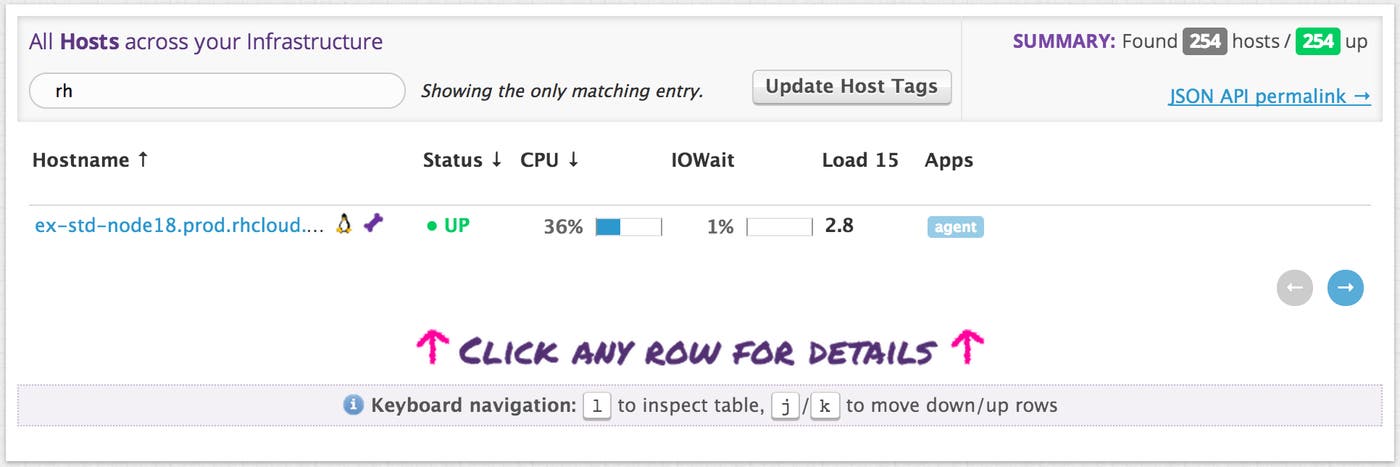
At this point, the Agent should be running on the gear and appear on the Infrastructure Overview:
You can also configure integrations to monitor other important parts of your stack, such as data stores, caches, web servers, and more. Here is the list of the available integrations.
If you’d like to get more visibility into your OpenShift v2 environment, sign up for a 14-day free trial of Datadog, and then install the Datadog Agent on your OpenShift gears. The Agent is completely open source, so you can read through every line of it, before installing it on your OpenShift gears or other servers.
此内容由惯性聚合(RSS阅读器)自动聚合整理,仅供阅读参考。 原文来自 — 版权归原作者所有。