


Endpoints, whether physical devices or cloud resources, are critical targets for potential cyberattacks. SentinelOne is an endpoint detection and response (EDR) solution that provides real-time detection of and response to endpoint threats. Using both static and behavioral detections, SentinelOne Singularity Endpoint helps protect against a range of threats, including malware, zero-day exploits, advanced persistent threats, and more.
In this post, we’ll look at how you can use Datadog Cloud SIEM to get full security visibility into your SentinelOne activity logs, threat detections, and more. With Datadog’s built-in threat detection rules and centralized dashboards, you can easily monitor and surface suspicious activity that SentinelOne detects in your environment in order to stay on top of potential attacks to your endpoints and prioritize remediation.
In order to quickly begin monitoring your SentinelOne telemetry with Datadog Cloud SIEM, you can use the SentinelOne content pack. The content pack provides a centralized place to enable and configure Datadog’s SentinelOne integration, deploy out-of-the-box (OOTB) detection rules, and access the customizable dashboard.

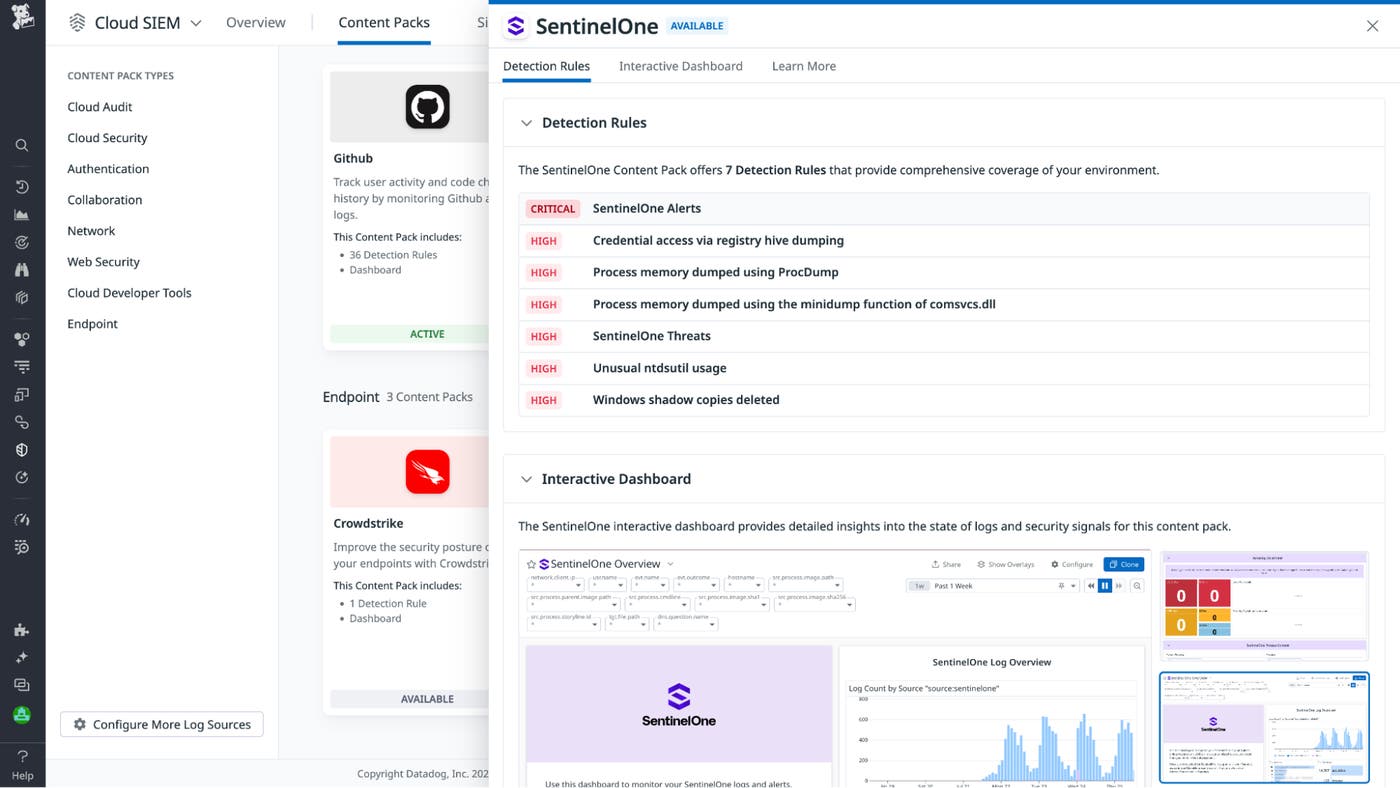
Once you set up the integration, alert, threat, and activity logs from your SentinelOne environment will appear in Datadog. Additionally, by enabling Cloud Funnel Streaming in SentinelOne, you can collect SentinelOne Cloud Funnel telemetry alongside this log data. Cloud Funnel telemetry consists of raw, high-volume endpoint data, including detailed activity logs, behavioral patterns, threat detections, and other security-related events. This granular, real-time data captures every potential threat indicator, providing deeper insights into endpoint behavior. By forwarding telemetry through Cloud Funnel to Datadog, organizations can perform real-time analysis, long-term investigations, threat hunting, and custom detection development.
You can only act on security threats as fast as you’re alerted to them. Datadog continuously scans your SentinelOne events as it ingests and processes them. You can use custom security reference data to enrich them further with additional business-specific context. Built-in detection rules—that are mapped to the MITRE ATT&CK® framework—automatically look for specific threat indicators and stream any generated security signals in a unified explorer, helping to streamline security investigations and threat detection. In addition to generating signals from any alerts and detected threats from SentinelOne, Datadog’s OOTB detection rules look for behavior such as:
Process memory dumped using ProcDump or minidump function of comsvcs.dll
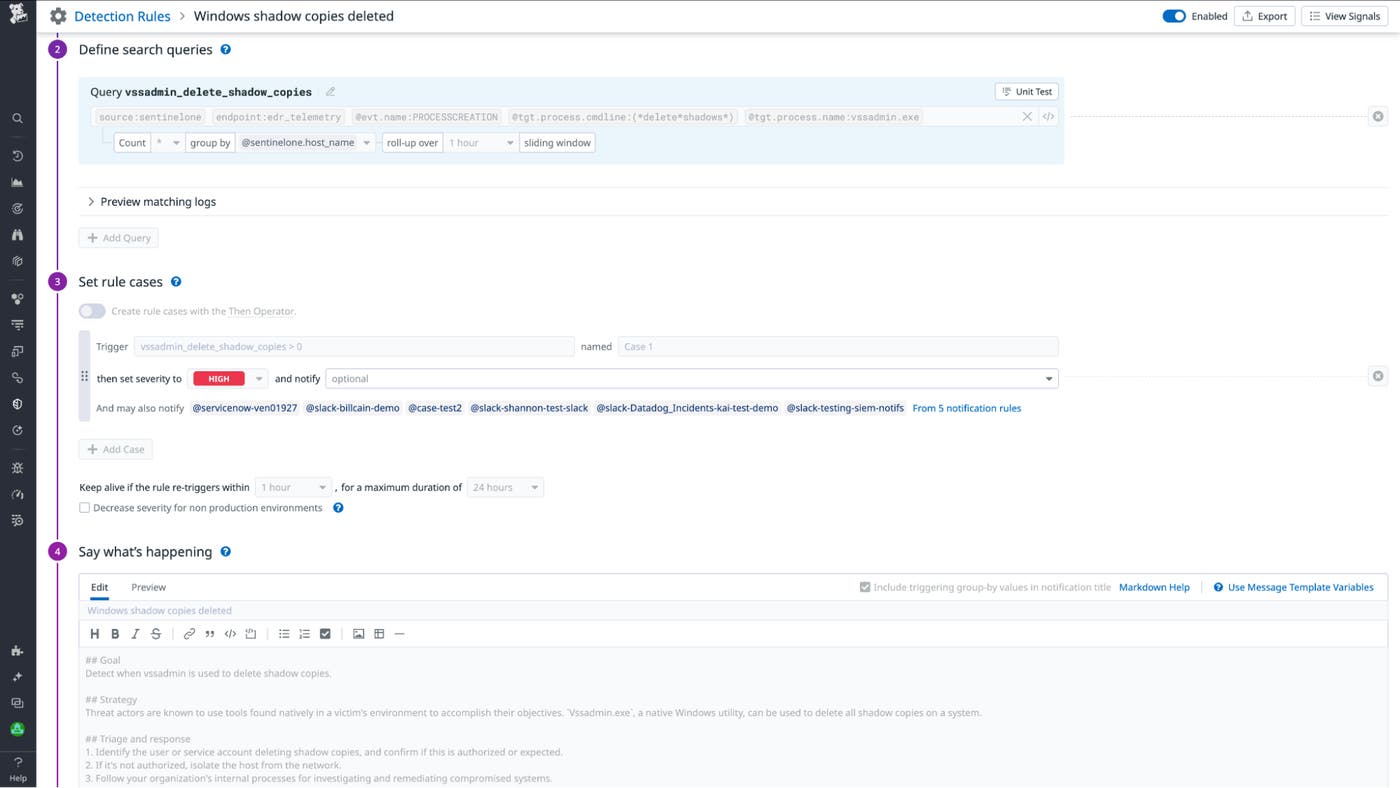
If Datadog detects any of these actions, it automatically generates a security signal that includes additional context around the issue as well as actions and steps to take next. These rules help security teams identify key attack stages, from endpoint threats and credential theft to data extraction and destruction tactics. By monitoring for these specific behaviors, organizations can prevent lateral movement, privilege escalation, and data destruction, while responding quickly to threats like ransomware or directory service compromises.
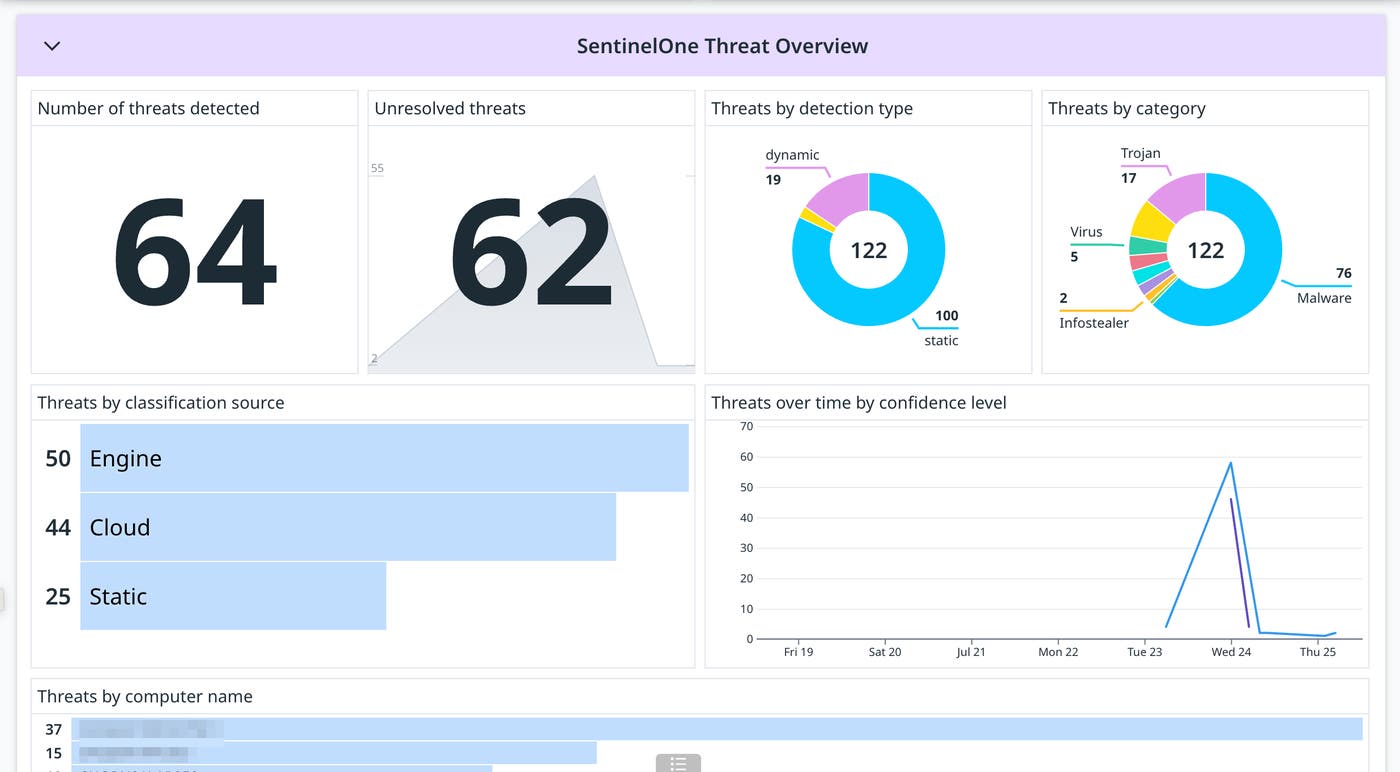
Datadog’s OOTB SentinelOne dashboard visualizes ingested log data so that you can easily track threats over time by confidence level, helping you identify patterns or escalation in threat severity. Additionally, you can track threats across your infrastructure, pinpointing them by computer name and examining a real-time threat log stream for detailed event analysis.
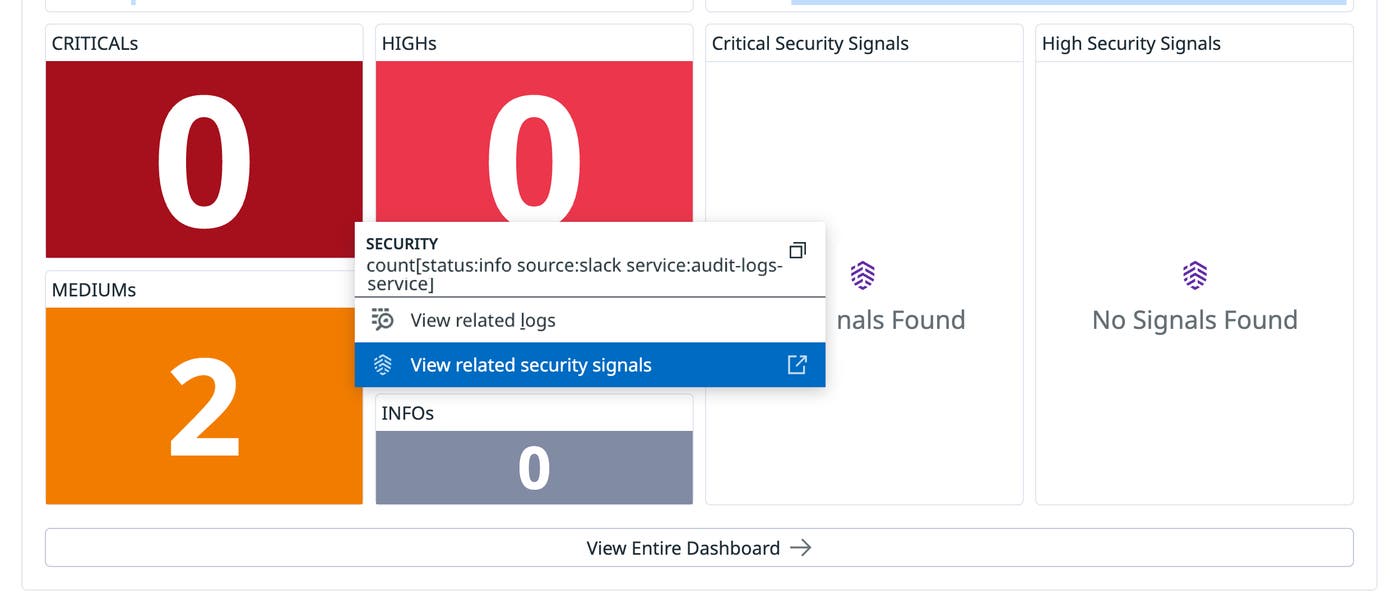
The dashboard also visualizes Cloud SIEM security signals so that you can understand your environment’s security posture at a glance. Seamlessly pivot to relevant security signals in order to better understand where you need to focus remediation efforts.
For deeper context, the SentinelOne process context section displays detailed data on parent processes, process command-line activity, file activity, and even DNS activity, offering rich insights into how a threat is interacting with your systems. This level of granular visibility into process behavior makes it easier to trace back to the root cause of a threat and take targeted action.
With Datadog Cloud SIEM and the SentinelOne integration, organizations can monitor, triage, and respond to threats across both endpoints and cloud environments from a unified platform. This integration ensures seamless monitoring, enabling security teams to respond more effectively to evolving threats and maintain a stronger security posture. If you’re already a Datadog customer, see our documentation and start exploring our SentinelOne content pack now. If you’re not a customer, you can get started today with a 14-day free trial.
此内容由惯性聚合(RSS阅读器)自动聚合整理,仅供阅读参考。 原文来自 — 版权归原作者所有。