


Betsy Sallee

Ben Donnelly
NerdVision, Product Owner
NerdVision is a live debugging platform that enables users to take snapshots of their application’s state at runtime. NerdVision is compatible with .NET, Java, Node.js, Python, and ColdFusion applications—no matter where they are hosted—and doesn’t require any changes to the source code.
The new NerdVision integration, which is available through the Datadog Marketplace, sends all of your NerdVision data to Datadog so you can visualize debugging trends, reduce your MTTR, and correlate code-level insights with monitoring data from your entire tech stack.
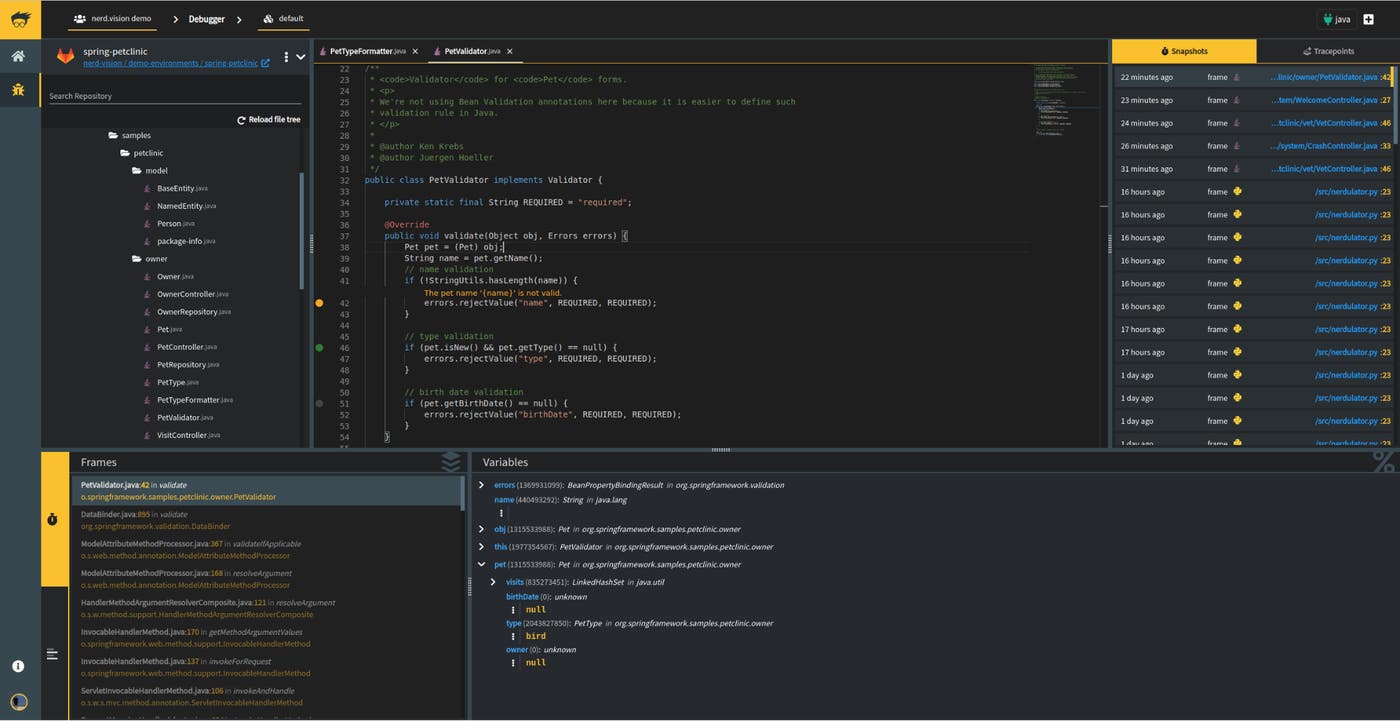
The NerdVision toolbox includes two highly flexible debugging tools that provide deep, code-level visibility into your application’s performance—without any restarts or code changes.
First, NerdVision enables you to install non-blocking tracepoints to specific lines of code, which, when triggered, capture the scope variables and stack trace without disrupting execution. You can configure your tracepoints to capture a single frame or the full stack, and you can also use conditionals to tighten your focus on particular cases that might arise. Watches add another level of control by allowing you to define the specific data you’re interested in seeing when the tracepoint triggers.
NerdVision also allows you to inject log points into your source code, which include dynamic messages that are logged to the standard output of the application. Like tracepoints, log points can be applied to any line with a single click and are highly configurable with rate limits, conditions, and expressions to evaluate inside the log message itself.
Your NerdVision logs and tracepoints will start flowing into Datadog as soon as you enable and configure the integration, so you can start correlating this debugging data with metrics, traces, logs, and code profiles from across your stack.
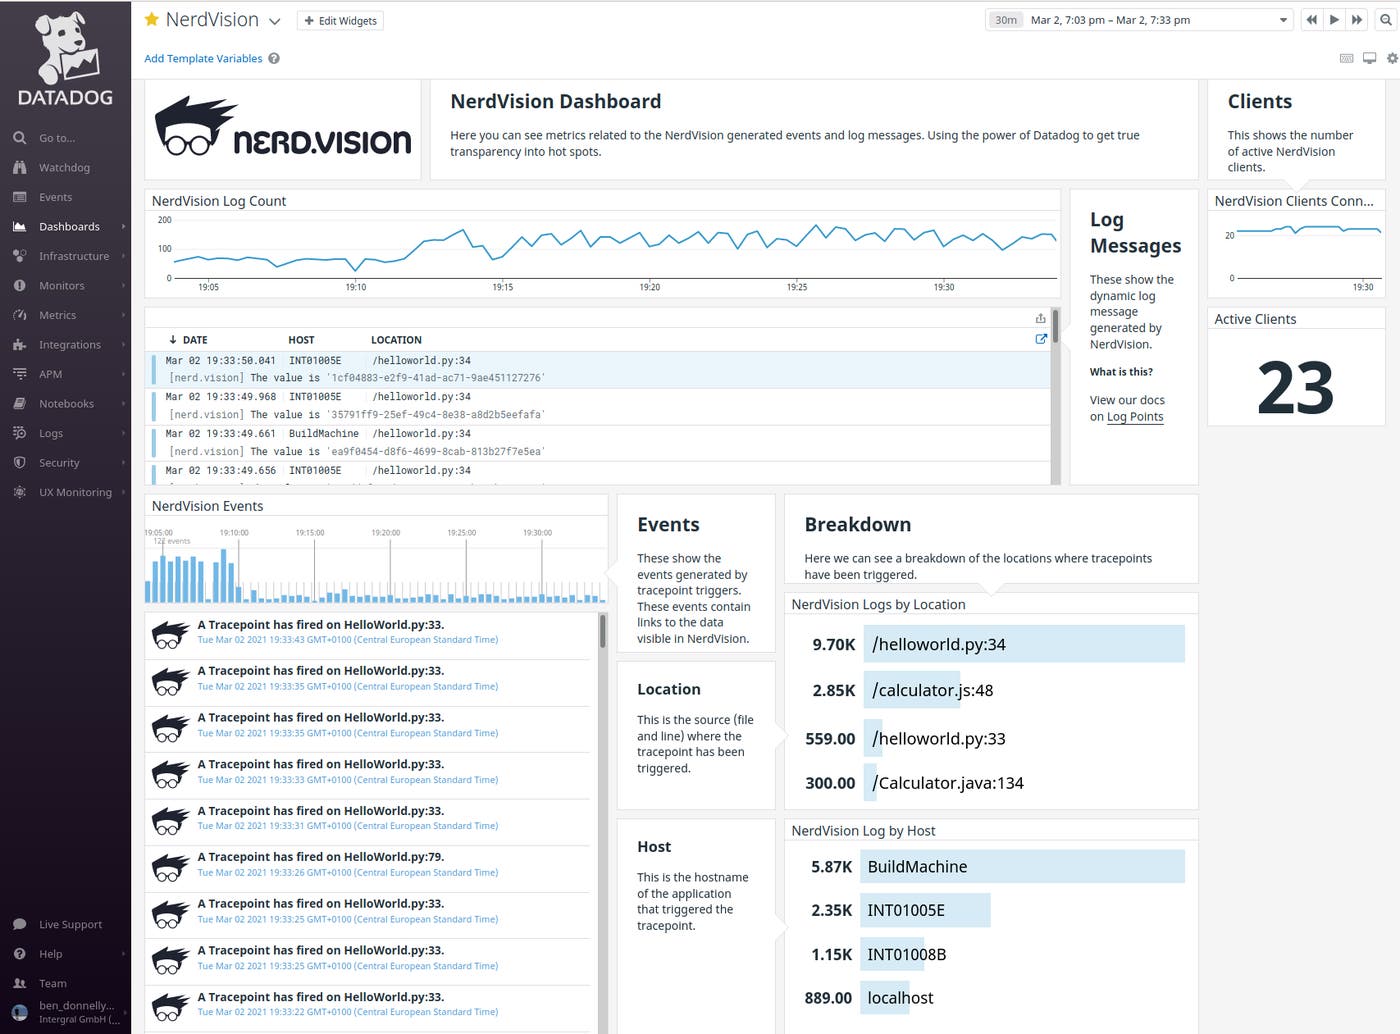
Once you’ve enabled the NerdVision integration, you’ll automatically be able to see your NerdVision tracepoints (which are ingested as events in Datadog), logs, and connected client count on an out-of-the-box dashboard, shown above. This dashboard allows you to view incoming NerdVision tracepoints and logs in real time and provides helpful breakdowns of where your tracepoints and logs are being triggered. This overview of debugging activity makes it easier to identify the areas of code that are most in need of improvements, which can help expedite the development process and reduce technical debt.
You can click on any log in the NerdVision dashboard to pivot to the Log Explorer, where you can view that particular log in context. All NerdVision logs are normalized on ingestion, so you can use standardized tags and facets, such as host and location, to search, filter, and analyze your log data. You can also use Log Patterns to intelligently group your NerdVision logs together, which helps you cut through the noise and identify hot spots in your code.
Some NerdVision logs and tracepoints may be routine, but others may indicate serious code-level problems. You can leverage Datadog monitors to alert you to concerning spikes in specific NerdVision activity, such the rate of tracepoints coming from a particular code location. Monitors can be created for events, logs, and metrics, ensuring full coverage of your NerdVision data.
The NerdVision integration is currently available in the Datadog Marketplace and will soon be expanded to include metrics for variable data in your snapshots, such as HTTP status codes. For more information on configuring the integration, check out the NerdVision documentation. You can also take the integration for a two-week test drive to see your NerdVision debugging data alongside monitoring data from your entire tech stack.
If you’re not yet a Datadog customer, you can learn more about the Datadog Marketplace in our blog post—and sign up for a 14-day free trial.
The ability to promote branded monitoring tools in the Datadog Marketplace is one of the benefits of membership in the Datadog Partner Network. Interested in developing an integration or application for the Datadog Marketplace? Contact us at marketplace@datadog.com.
此内容由惯性聚合(RSS阅读器)自动聚合整理,仅供阅读参考。 原文来自 — 版权归原作者所有。