


Jane Wang

Bo Huang

Steven Pham

David Pointeau
Confluent Cloud is a Kafka–as-a-service solution that simplifies the deployment, scaling, and operation of Kafka clusters. A popular feature is its Apache Kafka connectors, which make it easy to connect your Kafka clusters to any of 120+ third-party streaming data sources and destinations. Connectors allow you to pull data into your pipelines without having to manage your own dedicated service, call any APIs, or integrate your Kafka streams into another system (such as a data warehouse or CRM application).
Datadog offers an integration that collects performance metrics and cost data from your Confluent Cloud accounts. But given that streaming data pipelines are often dependent on Confluent Cloud connectors, teams need to be able to easily see these connectors visualized, read connector status information, and assess related performance issues (such as any latency detected upstream or downstream of the connectors) all within the context of their end-to-end systems. This information is critical to helping engineers proactively identify bottlenecks or other performance problems and ensure the continuous flow of data through these pipelines.
We are pleased to announce that we have expanded the capabilities of Datadog’s Confluent Cloud integration so that it now provides autodiscovery of Confluent Cloud connectors. Additionally, with Datadog Data Streams Monitoring (DSM), you can now monitor connectors, including throughput and status information, within the context of your end-to-end streaming data pipelines.
In this blog post, we will cover how Datadog now allows you to:
Automatically gain visibility into your Confluent Cloud connectors
Monitor connector throughput and status in the context of your entire pipeline with Data Streams Monitoring
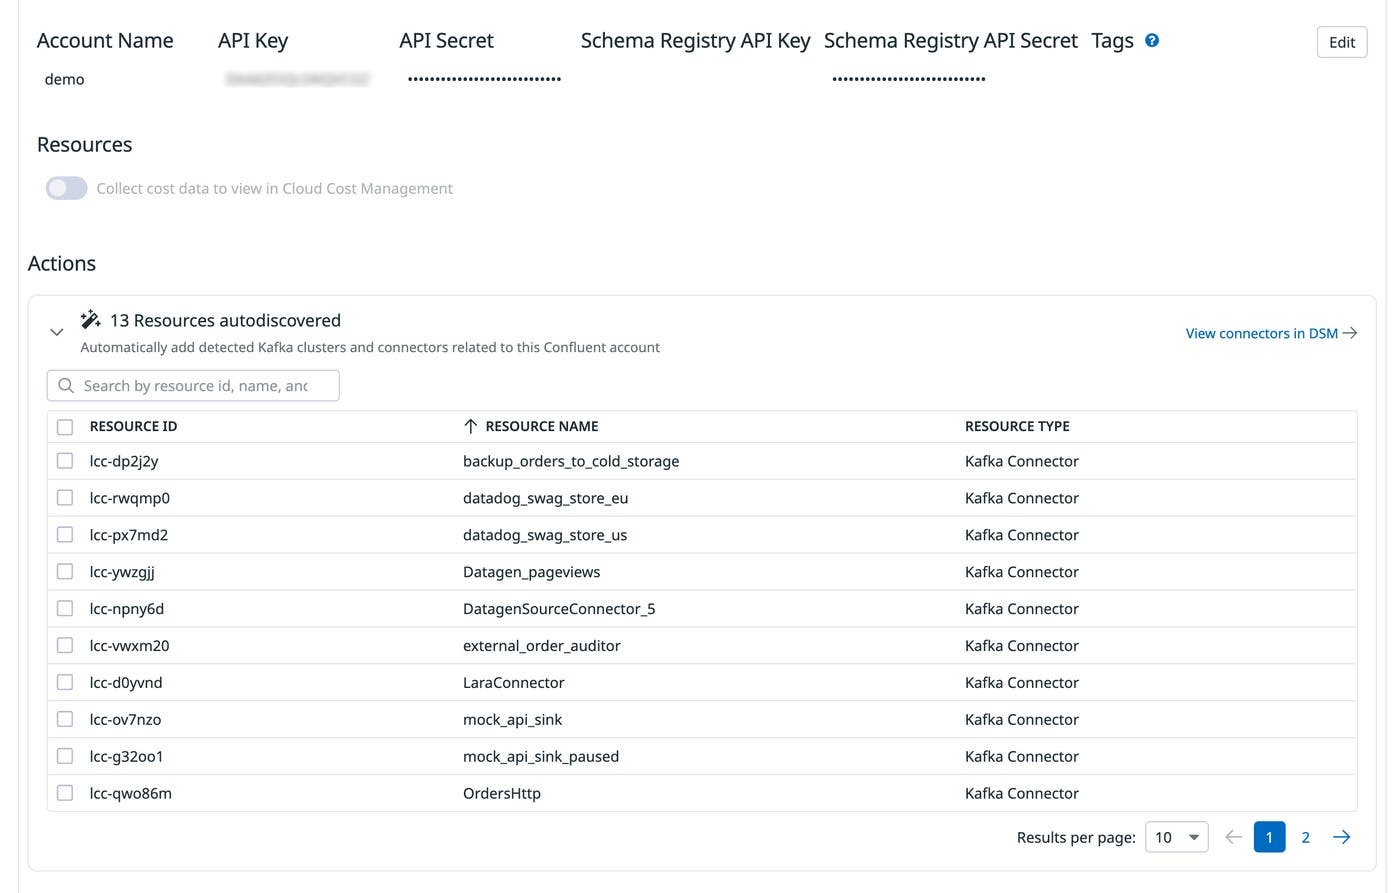
Through its autodiscovery feature, Datadog’s Confluent Cloud integration now automatically discovers Confluent Cloud connectors. For example, in the screenshot below, the Confluent Cloud integration tile shows 10 autodiscovered connectors, identified by resource name and ID. Note that the autodiscovery will attempt to discover new connectors every time you come back to this integration tile—a useful feature when new connectors are added to your Confluent Cloud account. Of the autodiscovered connectors, you can add any or all of them to your monitored Confluent account in Datadog by selecting them and clicking the Add Resources button.
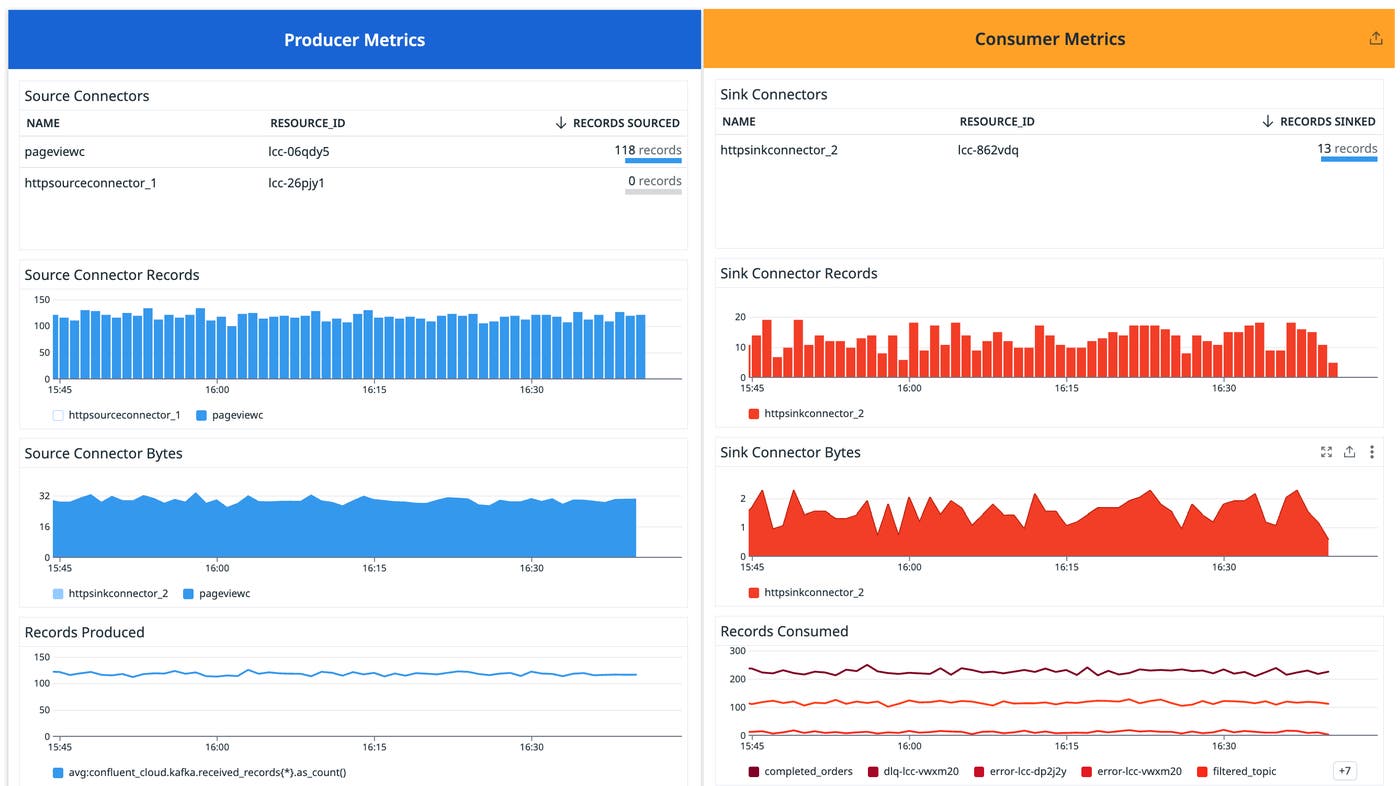
Once the autodiscovered connectors are added, Datadog starts collecting associated metrics, which are displayed on the Confluent Cloud Overview dashboard. This dashboard is available out of the box and requires no additional configuration, saving you time and effort in the setup process. The data collected includes graphs of the throughput for all source or sink connectors, measured in records and bytes, as shown in the screenshot below:
DSM maps your streaming data pipelines and tracks end-to-end performance metrics for your event-driven applications to help you detect and pinpoint the source of delays. The DSM topology map gives you a visual overview that makes it easy to see the flow of data through your system and understand the relationships between services, queues, and connectors—and how all these elements impact performance.
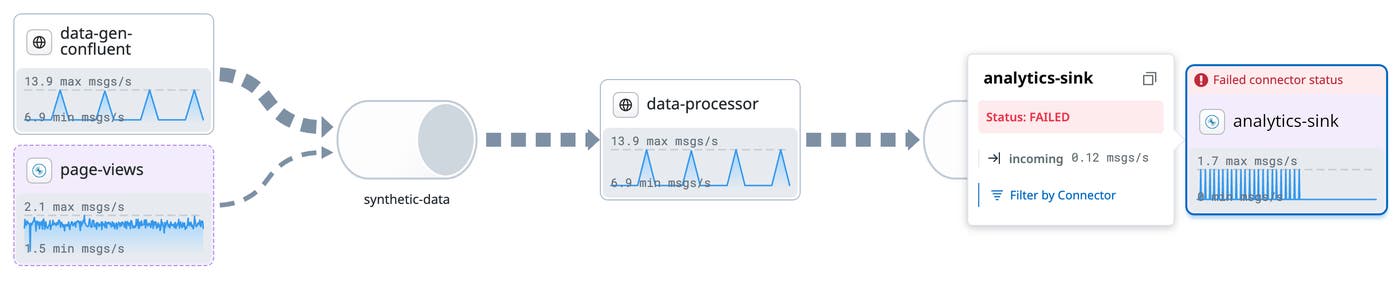
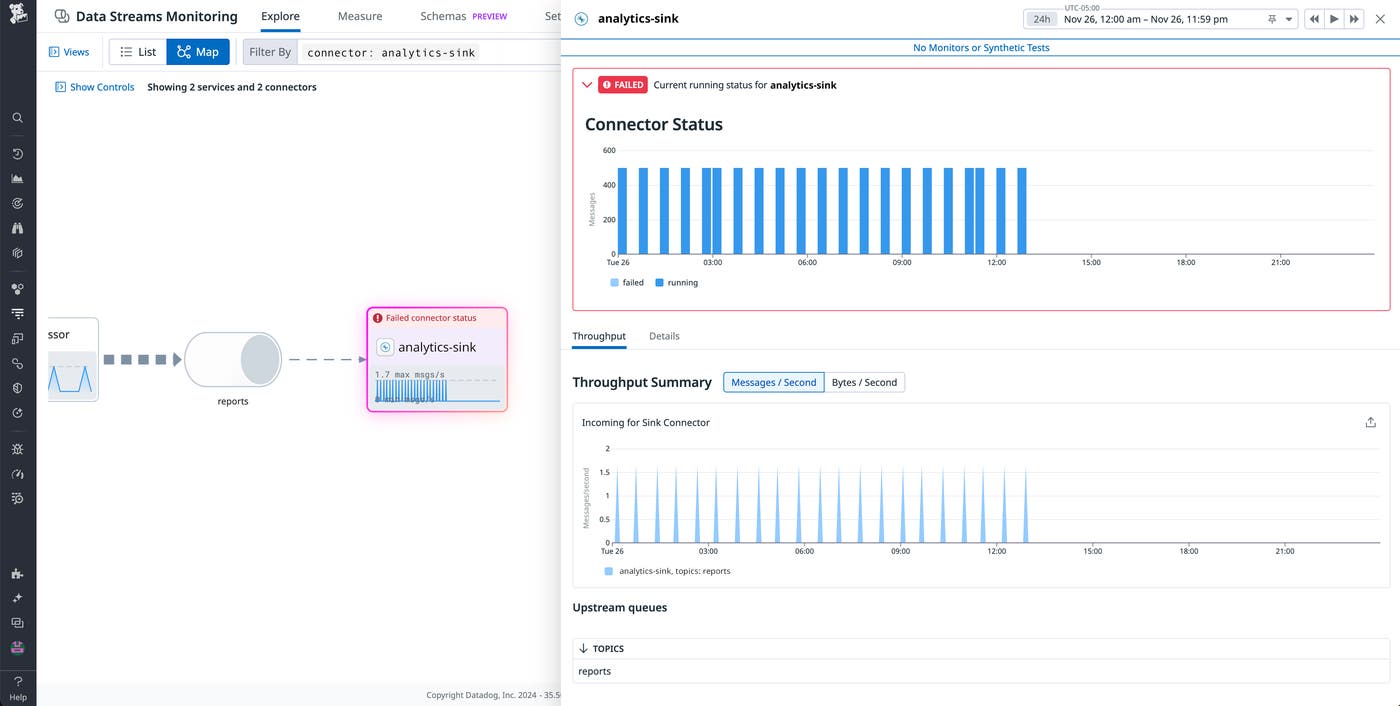
After Datadog autodiscovers your Confluent Cloud connectors, you will see them automatically visualized in the topology map in DSM. Seeing your connectors and associated performance metrics within the context of your end-to-end pipelines helps you identify and diagnose issues. For example, one key benefit is that it helps you easily see dependencies, which in turn allows you to spot the downstream impacts of connector failures, or the upstream root causes of failures. You can also track throughput stats for individual connectors, alongside throughput stats for all services and queues in your pipelines, to see if data is flowing as expected without issues. In addition, you can now monitor the status of connectors so that you can immediately know when they’re running, failed, degraded, or paused.
By including the connectors in its visualizations of streaming data pipelines, DSM allows you to gain full contextual awareness of your pipeline’s topology—including end-to-end telemetry for its components—enabling you to better detect upstream root causes and downstream impacts of pipeline issues. More specifically, monitoring connectors in DSM allows you to:
Understand dependencies and their impacts: Confluent Cloud connectors appear as nodes in the map, identified as either source or sink connectors. With the key addition of the connectors on these maps, you can better detect cause-and-effect relationships and see how your connectors might be impacting your pipeline’s performance.
Monitor throughput and latency: By monitoring the incoming and outgoing throughput metrics for each connector and for your entire pipelines end to end, you can determine the rate at which data is processed, identify anomalies, and help ensure data flows as expected.
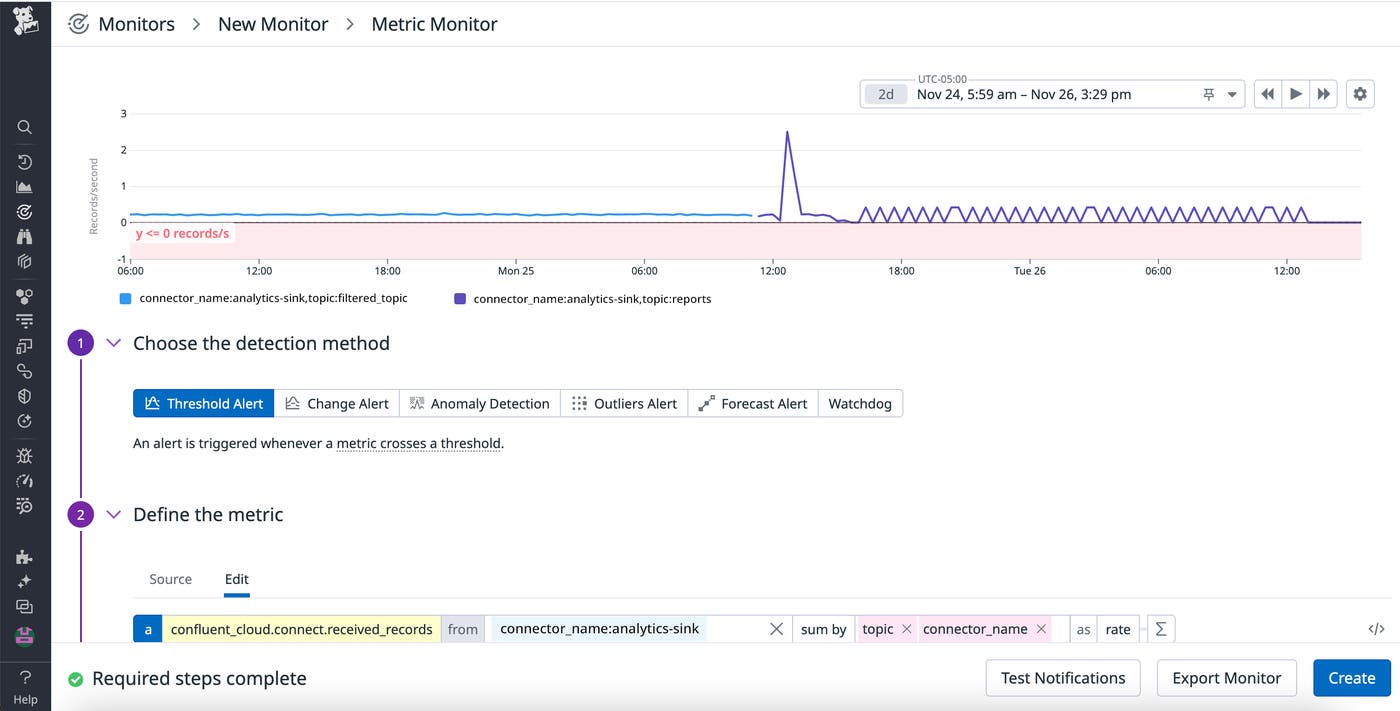
Track connector status: The status of each connector (running, failed, paused, or unassigned) is clearly displayed, allowing you to minimize downtime by quickly identifying any connectors that might be disrupting the flow of data through your pipeline. Additionally, by setting a monitor on connector status, you can proactively verify that all parts of your pipeline are functioning as expected.
The Datadog Confluent Cloud integration now automatically discovers and collects metrics on Confluent Cloud connectors within your applications, displaying graphs of this telemetry in the OOTB dashboard. In addition, with Datadog Data Streams Monitoring you can now visualize these connectors within the context of your streaming data pipelines, alongside information about throughput, latency, and status. With this new visibility, teams can identify and troubleshoot data flow issues faster, maintain consistent performance, and optimize the health of their event-driven systems.
If you’re ready to improve observability for your Confluent Cloud–hosted Kafka clusters, install our Confluent Cloud integration. To get started with Data Streams Monitoring, see our documentation. And if you’re not yet a Datadog customer, sign up for a 14-day free trial.
此内容由惯性聚合(RSS阅读器)自动聚合整理,仅供阅读参考。 原文来自 — 版权归原作者所有。