惯性聚合 高效追踪和阅读你感兴趣的博客、新闻、科技资讯
阅读原文 在惯性聚合中打开

推荐订阅源

Forbes - Security
Forbes - Security
CTFtime.org: upcoming CTF events
F
Fortinet All Blogs
B
Blog
T
The Blog of Author Tim Ferriss
Engineering at Meta
Engineering at Meta
GbyAI
GbyAI
Y
Y Combinator Blog
Microsoft Azure Blog
L
LangChain Blog
Recent Announcements
U
Unit 42
Martin Fowler
Martin Fowler
M
MIT News - Artificial intelligence
让小产品的独立变现更简单 - ezindie.com
The Register - Security
Recorded Future
Recorded Future
C
Check Point Blog
V
V2EX
奇客Solidot–传递最新科技情报
奇客Solidot–传递最新科技情报
Hugging Face - Blog
Hugging Face - Blog
WordPress大学
WordPress大学
Google DeepMind News
酷 壳 – CoolShell
酷 壳 – CoolShell
F
Full Disclosure
小众软件
小众软件
A
About on SuperTechFans
云风的 BLOG
云风的 BLOG
宝玉的分享
宝玉的分享
Last Week in AI
Last Week in AI
有赞技术团队
有赞技术团队
MongoDB | Blog
MongoDB | Blog
爱范儿
爱范儿
P
Proofpoint News Feed
罗磊的独立博客
量子位
D
Docker
博客园_首页
D
DataBreaches.Net
Project Zero
Project Zero
博客园 - 司徒正美
Threat Intelligence Blog | Flashpoint
博客园 - Franky
Security Latest
Security Latest
cs.AI updates on arXiv.org
N
Netflix TechBlog - Medium
K
KPMG report finds enterprise disconnect between AI and its ROI | CIO
博客园 - 三生石上(FineUI控件)
H
Hackread – Cybersecurity News, Data Breaches, AI and More
大猫的无限游戏
大猫的无限游戏

Datadog | The Monitor blog

Introducing our open source AI-native SAST Instrument and monitor Boomi integration flows with OpenTelemetry and Datadog Not all index scans are equal: How we cut query latency by over 99% Platform engineering metrics: What to measure and what to ignore Integrate Recorded Future threat intelligence with Datadog Cloud SIEM CI/CD security: threat modeling using a MITRE-style threat matrix CI/CD security: How to secure your GitHub ecosystem Ingress NGINX is EOL: A practical guide for migrating to Kubernetes Gateway API Operating agentic AI with Amazon Bedrock AgentCore and Datadog LLM Observability: Lessons from NTT DATA Introducing the Datadog Code Security MCP Capture and analyze custom heatmaps in Session Replay Understand session replays faster with AI summaries and smart chapters Monitor ClickHouse query performance with Datadog Database Monitoring How we designed empathetic alert sounds for on-call engineers Search and act across Datadog to resolve issues faster with Bits Assistant Measure the business impact of every product change with Datadog Experiments Analyzing round trip query latency Configuring JavaScript caches for better performance Introducing Bits AI Dev Agent for Code Security Datadog achieves ISO 42001 certification for responsible AI Monitor Nutanix clusters, hosts, and VMs with Datadog Monitor Juniper Mist in Datadog A new Host Map for modern infrastructure Annotate traces to improve LLM quality with Datadog LLM Observability What’s new in Cloud SIEM: AI-powered investigations, enhanced threat intelligence, and scalable security operations Explore Kubernetes with native OpenTelemetry data Monitor Oracle Fusion Cloud Applications with Datadog Announcing the Datadog Terraform provider v4.0.0 Scaling Kubernetes workloads on custom metrics How to design cloud environments for AI-powered threat analysis Monitor Aruba Central in Datadog How we centralize and remediate risks with Datadog Case Management Accelerate incident response with Datadog and ServiceNow Monitor your application and network load balancer logs Understanding Karpenter architecture for Kubernetes autoscaling Tools for collecting metrics and logs from Karpenter Monitor Karpenter with Datadog What your product data is actually saying Key metrics for monitoring Karpenter Securing Datadog’s platform in the AI age: The role of observability data Four ways engineering teams use the Datadog MCP Server to power AI agents Approaching your observability migration with the right mindset Meet the new Bits AI SRE: Deeper reasoning, twice as fast Key learnings from the 2026 State of DevSecOps study Use plain English to query your multi-cloud infrastructure in Resource Catalog Simplifying troubleshooting across the user journey with Datadog Synthetic Monitoring Protect your OCI resources with Datadog Cloud Security This Month in Datadog - February 2026 Amazon EC2 security: How misconfigured and public AMIs expand your cloud attack surface Enable end-to-end visibility into your Java apps with a single command Measure and improve mobile app startup performance with Datadog RUM Evaluating our AI Guard application to improve quality and control cost Identify untested code across every level of your codebase Make use of guardrail metrics and stop babysitting your releases Monitor Versa Networks SD-WAN performance in Datadog Improve performance and reliability with APM Recommendations Remediate transitive vulnerabilities faster with Datadog Software Composition Analysis Generate audit-ready vulnerability and compliance reports with Datadog Sheets Monitor Fortinet FortiManager performance in Datadog Improve test coverage across codebases with Datadog Code Coverage Move fast, don’t break things: Consistent testing standards at scale Enrich logs with ServiceNow CMDB context before routing to any SIEM or logging tool Monitor Lustre with Datadog Make faster, better product decisions with Datadog Product Analytics Surface and remediate runtime posture issues with Workload Protection Findings Protect agentic AI applications with Datadog AI Guard How to optimize JavaScript code with CSS Trace Google Pub/Sub workloads in Cloud Run with Datadog Detect human names in logs with ML in Sensitive Data Scanner How we cut our NLQ agent debugging time from hours to minutes with LLM Observability Debug PostgreSQL query latency faster with EXPLAIN ANALYZE in Datadog Database Monitoring Datadog acquires Propolis Unify and correlate frontend and backend data with retention filters Scale compliance across global frameworks with Datadog Cloud Security Monitor Arista VeloCloud SD-WAN performance with Datadog Building reliable dashboard agents with Datadog LLM Observability Simplify log collection and aggregation for MSSPs with Datadog Observability Pipelines Mitigation for Node.js denial-of-service vulnerability affecting Datadog APM Automate flaky test fixes with the Bits AI Dev Agent and Test Optimization How we built an AI SRE agent that investigates like a team of engineers Datadog integrations 2025 recap: Observability for AI, security, and hybrid cloud Design effective executive dashboards with Datadog Implement dbt data quality checks with dbt-expectations Bring faster visibility into AWS Lambda functions with remote instrumentation Troubleshoot faster with the GitLab Source Code integration in Datadog How Cambia Health Solutions saved $30,000 monthly with Cloud Cost Management and the Datadog Resource Catalog Normalize any logs for Cloud SIEM with Datadog's OCSF processor Optimizing Datadog at scale: Cost-efficient observability at Zendesk Detect, diagnose, and resolve network issues easily with CNM Network Health Connect engineering errors to user impact in early-stage products Cilium configuration for Kubernetes operations at scale Designing feedback loops for progressive delivery Ship features faster and safer with Datadog Feature Flags Choosing the right OpenTelemetry Collector distribution Route your monitor alerts with Datadog monitor notification rules Automate Cloud SIEM investigations with Bits AI Security Analyst Cloud threat detection: How to identify risky activity across control and data planes Collecting Kafka performance metrics Monitoring Kafka with Datadog Monitoring Kafka performance metrics
Optimize SQL Server performance with Datadog Database Monitoring
Bowen Chen, Casey Culligan, Joel Marcotte · 2024-02-21 · via Datadog | The Monitor blog

Microsoft SQL Server is a popular relational database management system that provides a wide range of performance and reliability features (e.g., AlwaysOn availability groups) to support business-critical applications. As your SQL Server workloads scale and increase in complexity, it can be difficult to monitor all of their components and pinpoint the exact issues that are degrading your databases’ performance.

Datadog Database Monitoring (DBM) provides deep visibility into your SQL Server instances so you can drill into slow queries and costly explain plans and then identify how they affect your databases’ performance. We’ve expanded DBM to collect additional telemetry for SQL Server to help you monitor tempdb, index usage, and more. Using DBM, you can inspect your normalized queries and track performance and resource usage trends—and you’re now able to gain similar insights at the stored procedure level.

In this post, we’ll explore how you can use DBM to:

  • Optimize your stored procedures

  • Identify latch contention and deadlocks

  • Monitor tempdb

Optimize SQL Server stored procedures

A stored procedure in SQL Server consists of one or more T-SQL statements that are executed as a single batch of code, which greatly reduces network traffic and execution latency. By creating stored procedures around frequently repeated database operations, you can reuse code and improve the maintainability of your codebase. Stored procedures also abstract permissions away from the object level and leverage parameterized queries to help protect against SQL injection attacks and bolster security. If your applications rely on stored procedures, you’ll need visibility into each procedure’s performance to quickly identify and resolve bottlenecks hampering your applications’ response times.

To address this, we’ve expanded DBM to give you insights into your stored procedures in addition to your normalized query data. You can view the Top Queries tab for your SQL Server instances to identify the queries and procedures contributing the most to database load and, potentially, slowing down your applications. After identifying a costly stored procedure, you can drill into its normalized query components to begin optimizing their performance and overall efficiency.

Analyze your databases’ stored procedures in DBM.

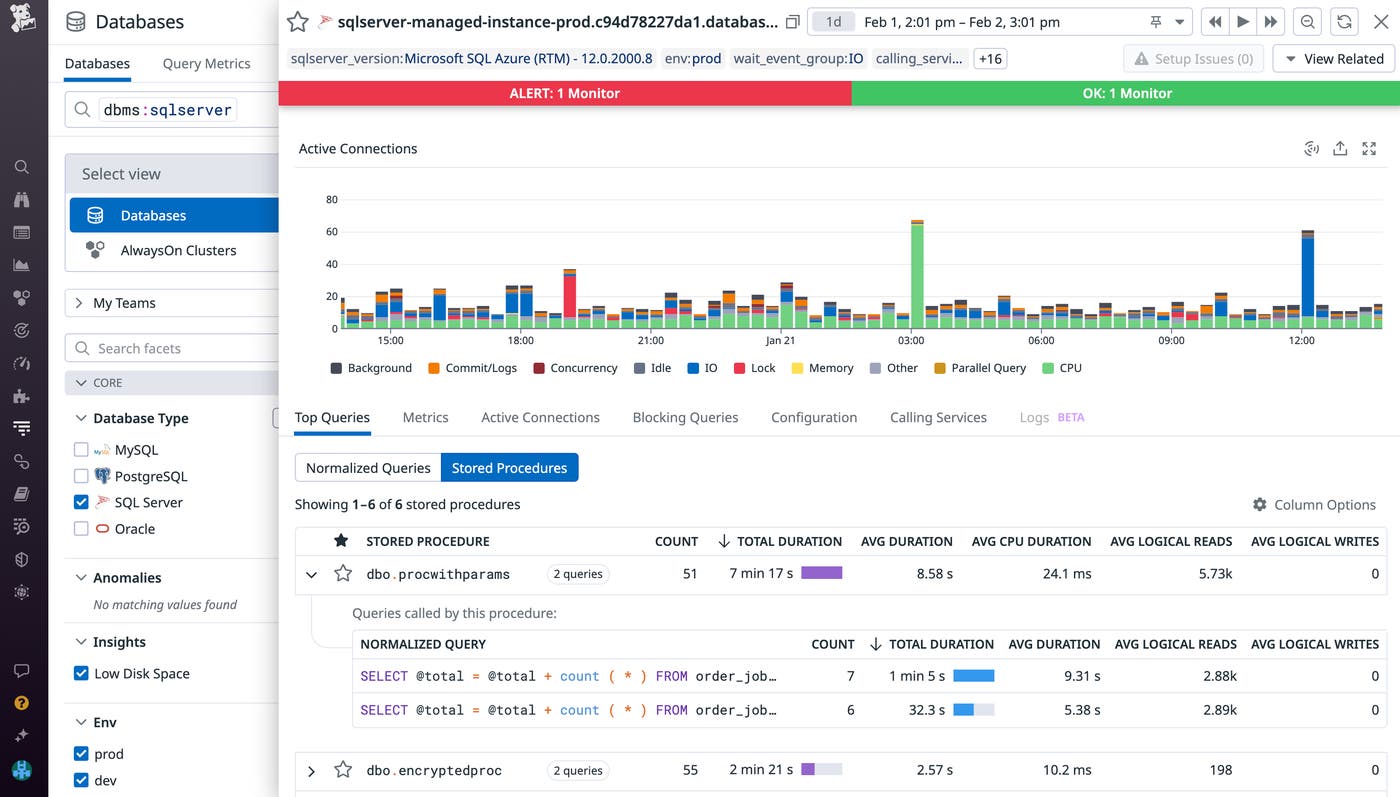
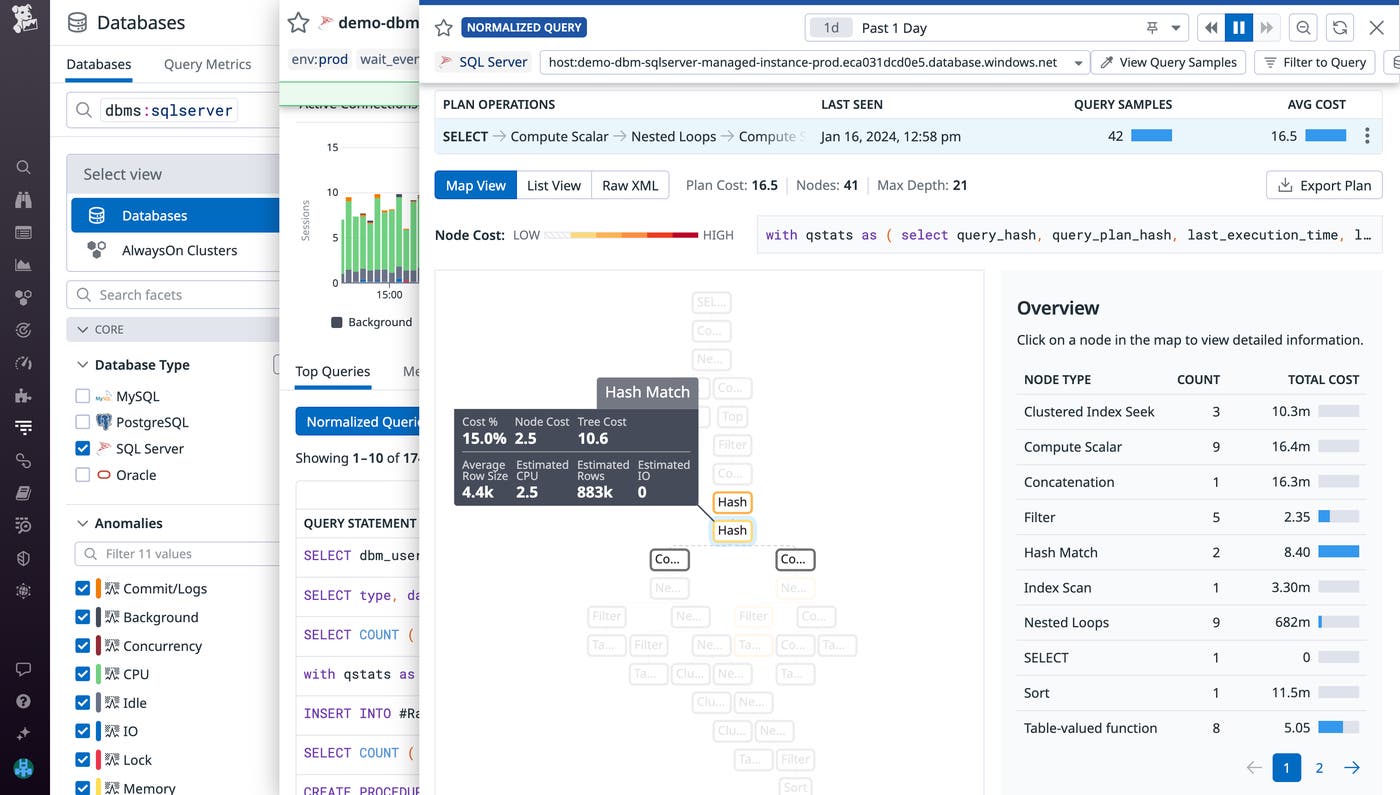
For example, when inspecting a stored procedure, you may notice that a normalized query accounts for the majority of the procedure’s duration. Upon inspecting that query’s explain plans in DBM, you’ll see a breakdown of the query’s steps of operations and their associated costs and row size. This enables you to identify unexpected bottlenecks or high-cost operations (e.g., expensive joins) in your queries. Identifying and configuring your queries to execute more optimal explain plans can greatly improve the performance of the applications that rely on executing any given stored procedure.

Identify costly steps slowing down your queries.

Identify latch contention and deadlocks

As users or applications request access to the same resources in a shared database, latches and locks are imposed to ensure that data and memory remain consistent in high-concurrency environments. Latches help prevent issues like race conditions from occurring in your database’s buffer cache (allocated memory pools) by blocking simultaneous updates to the same buffer. High-concurrency data stores typically experience latch contention whenever multiple requests wait to acquire a latch in order to access a page of data. However, it’s important to monitor the wait times and frequency of latch contention in order to identify when these issues become serious enough to impact throughput and bottleneck your database.

DBM provides metrics that can help you identify latch contention issues, so you can remediate them before they degrade the performance of your database. Using the sqlserver.latches.latch_waits metric, you can identify the number of latch contentions per second. To quickly identify bottlenecks slowing down your server, you can also visualize the average wait times of latches under the Locking section of your database’s Metrics tab (shown below).

Quickly detect the number of deadlocks and blocked processes with DBM metrics.

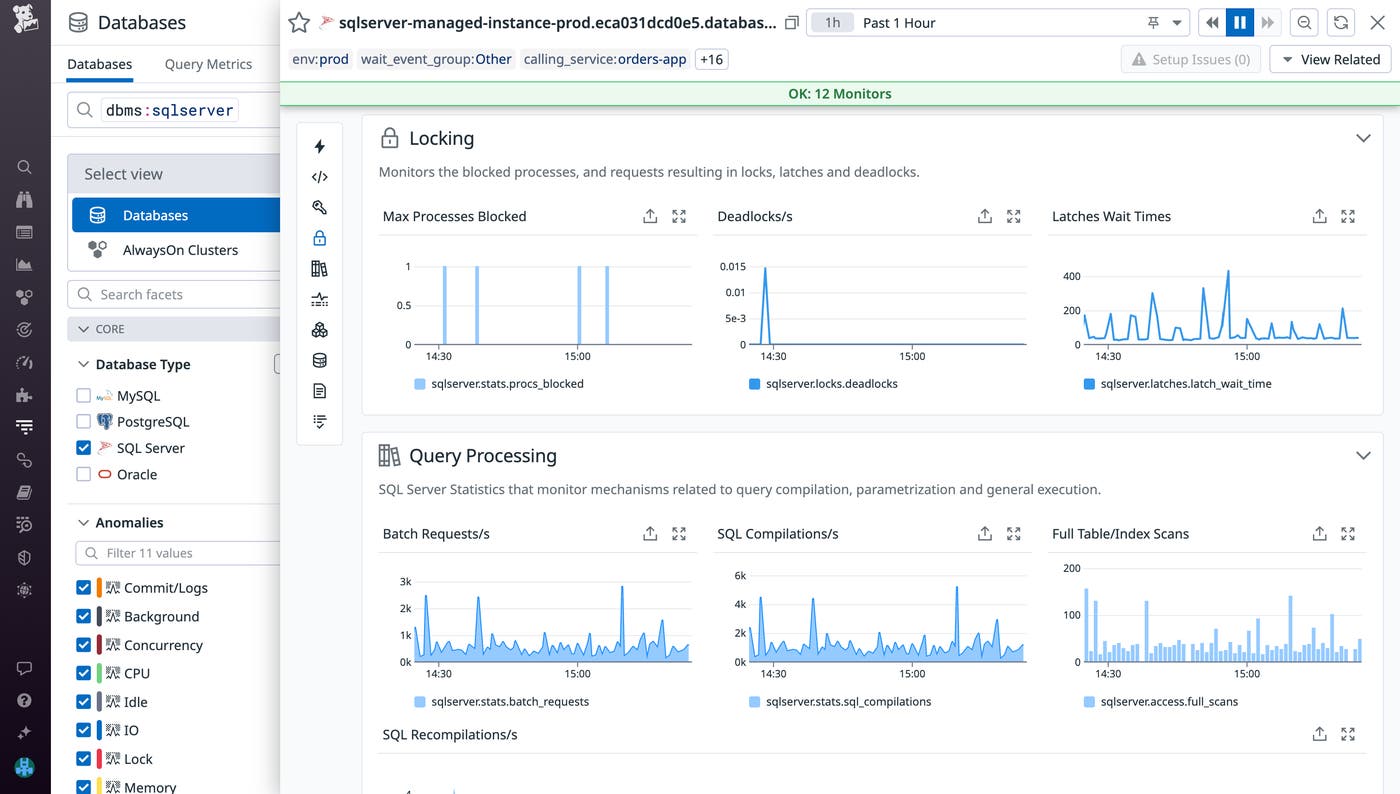
On the other hand, locks ensure data consistency by preventing two transactions from simultaneously accessing the same resource. Normally, a session will acquire the lock it needs once the current session is done accessing the target resource. However, when multiple transactions need exclusive access to the same resources before they can proceed, this creates a cyclic dependency known as a deadlock. SQL Server has a built-in thread to detect and resolve deadlocks, but this thread runs every five seconds and will rerun at least one of the deadlocked transactions. If your database encounters deadlocks at a relatively high-frequency, it can increase your server load and lengthen response times.

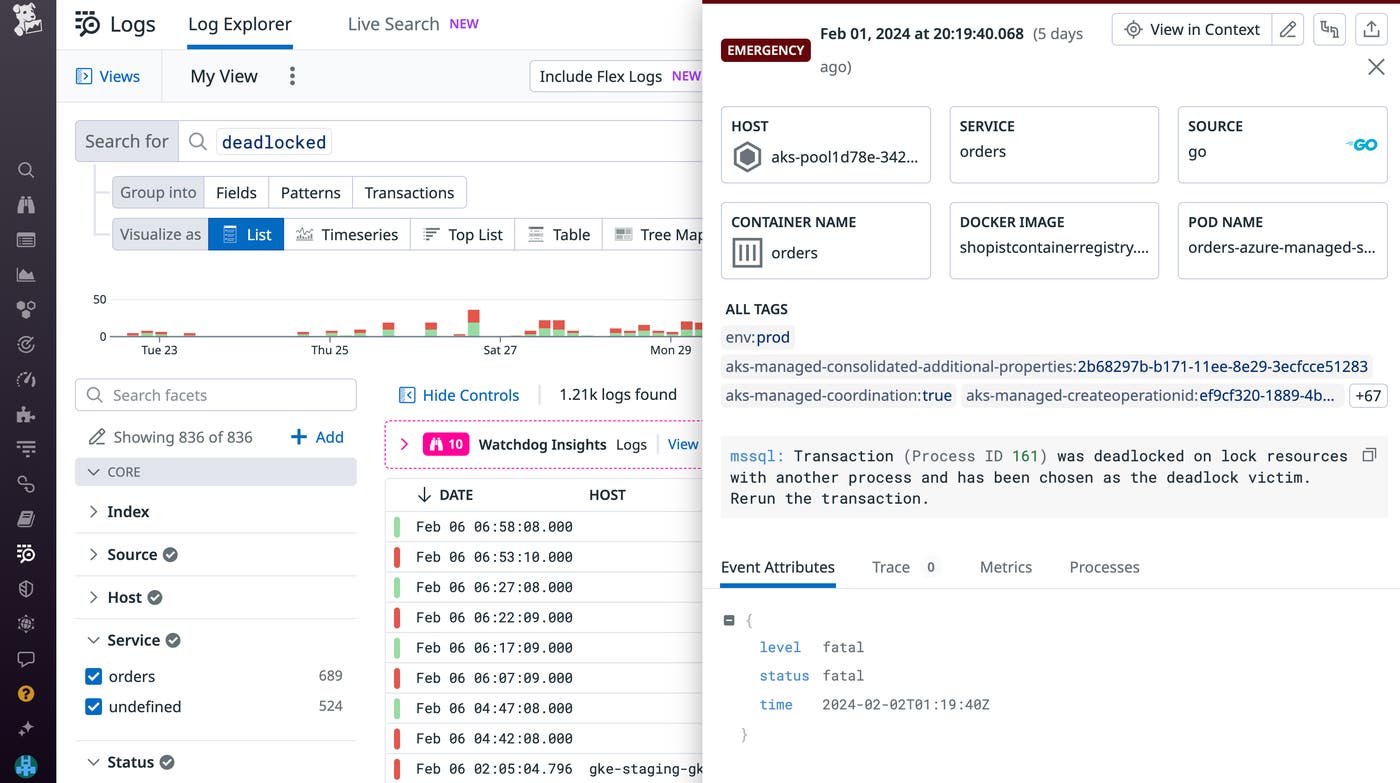
Using the sqlserver.locks.deadlocks metric, you can identify the number of deadlocks occurring per second in your SQL Server instance (you can also visualize the number of deadlocks per second, as shown in the previous screenshot). After detecting a high number of deadlock scenarios, you’ll need to investigate the locks in question. You can identify the processes blocked by deadlocks by installing our SQL Server integration and enabling log collection to view recently returned deadlock error logs. By pinpointing the locked resource (whether it’s an entire table or a single row) or reconfiguring your locks to be compatible, you can resolve recurring deadlocks and keep your databases running smoothly.

Enable SQL Server log collection with our integration for additional context into your deadlocked victim processes.

Monitor tempdb with DBM

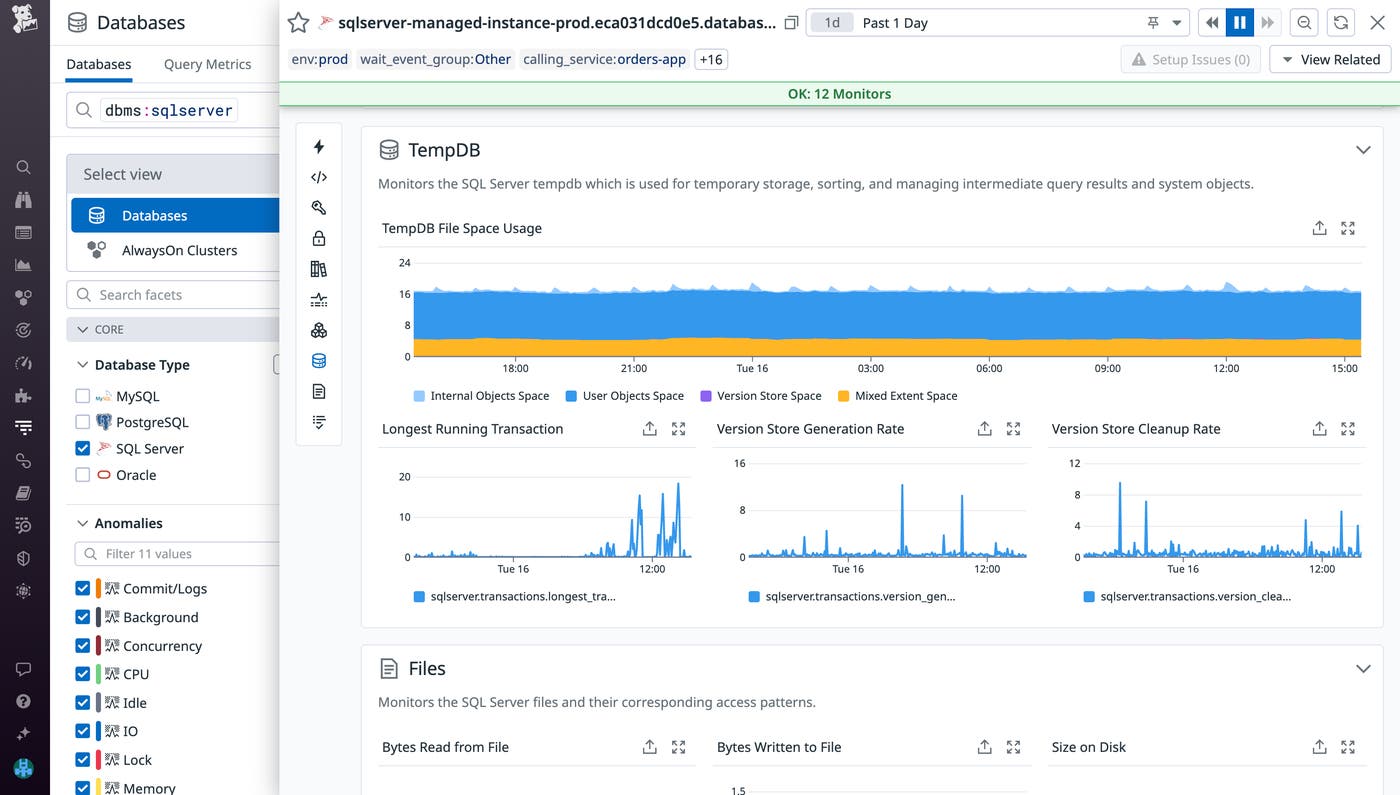
In SQL Server, tempdb is used as a data store for temporary user objects, internal objects generated by the system (such as intermediate work tables and files for hash and sort operations), and version stores that support row versioning features. During heavy periods of traffic, objects are constantly being written to and deleted from tempdb, which may result in unresponsive queries as your service waits for contention issues to resolve.

Using DBM, you can now monitor how tempdb is being used and identify long-running transactions that are consuming excessive space. One key metric you’ll want to monitor is unallocated page space (sqlserver.tempdb.file_space_usage.free_space). This can notify you when tempdb is close to reaching capacity. If this free space metric reaches zero, SQL Server will restrict various actions that rely on tempdb—such as joining tables or system views—until the tempdb size can be adjusted.

Monitor your resource consumption within tempdb.

Excess free space can also be used to increase the concurrency of your database. For example, if you notice that your tempdb has sufficient free space and it experiences allocation contention during periods of heavy load, you can create additional data files to maximize disk bandwidth. Each of the data files will act as an additional global allocation map when processing queries, which can help reduce contention.

Using DBM, you can also ensure that tempdb’s version store is generated and cleaned up at regular intervals. If you notice that version store space is growing linearly in DBM’s tempdb file space usage graph, you can refer to the version store cleanup rate graph to verify that temp is removing old row versions. Because row versions are stored in tempdb as long as an active transaction is accessing them, identifying and terminating long-running transactions can free up space in your version store and ensure that you’re releasing row versions that are no longer needed.

Start monitoring SQL Server with Datadog

With Datadog DBM, you can quickly pinpoint slow queries and other performance issues in your SQL Server instances and troubleshoot them before they affect your users. While this post focused on monitoring tempdb, stored procedures, and locks, DBM also helps you gain comprehensive visibility into SQL Server index usage, memory utilization, performance counters, and more. You can view a full list of available metrics and other relevant info in our documentation.

If you don’t already have a Datadog account, sign up for a free 14-day trial today.