
惯性聚合 高效追踪和阅读你感兴趣的博客、新闻、科技资讯
阅读原文 在惯性聚合中打开

推荐订阅源

酷 壳 – CoolShell
酷 壳 – CoolShell
G
Google Developers Blog
V
V2EX
美团技术团队
H
Help Net Security
月光博客
月光博客
爱范儿
爱范儿
Engineering at Meta
Engineering at Meta
The Cloudflare Blog
U
Unit 42
大猫的无限游戏
大猫的无限游戏
Recent Announcements
A
About on SuperTechFans
博客园 - Franky
The GitHub Blog
The GitHub Blog
N
Netflix TechBlog - Medium
人人都是产品经理
人人都是产品经理
博客园 - 司徒正美
MyScale Blog
MyScale Blog
B
Blog
雷峰网
雷峰网
Y
Y Combinator Blog
云风的 BLOG
云风的 BLOG
T
The Blog of Author Tim Ferriss

Datadog | The Monitor blog

Introducing our open source AI-native SAST Instrument and monitor Boomi integration flows with OpenTelemetry and Datadog Not all index scans are equal: How we cut query latency by over 99% Platform engineering metrics: What to measure and what to ignore Integrate Recorded Future threat intelligence with Datadog Cloud SIEM CI/CD security: threat modeling using a MITRE-style threat matrix CI/CD security: How to secure your GitHub ecosystem Ingress NGINX is EOL: A practical guide for migrating to Kubernetes Gateway API Operating agentic AI with Amazon Bedrock AgentCore and Datadog LLM Observability: Lessons from NTT DATA Introducing the Datadog Code Security MCP Capture and analyze custom heatmaps in Session Replay Understand session replays faster with AI summaries and smart chapters Monitor ClickHouse query performance with Datadog Database Monitoring How we designed empathetic alert sounds for on-call engineers Search and act across Datadog to resolve issues faster with Bits Assistant Measure the business impact of every product change with Datadog Experiments Analyzing round trip query latency Configuring JavaScript caches for better performance Introducing Bits AI Dev Agent for Code Security Datadog achieves ISO 42001 certification for responsible AI Monitor Nutanix clusters, hosts, and VMs with Datadog Monitor Juniper Mist in Datadog A new Host Map for modern infrastructure Annotate traces to improve LLM quality with Datadog LLM Observability What’s new in Cloud SIEM: AI-powered investigations, enhanced threat intelligence, and scalable security operations Explore Kubernetes with native OpenTelemetry data Monitor Oracle Fusion Cloud Applications with Datadog Announcing the Datadog Terraform provider v4.0.0 Scaling Kubernetes workloads on custom metrics How to design cloud environments for AI-powered threat analysis
Monitor AWS VPC with Datadog
Abril Loya McCloud · 2016-06-01 · via Datadog | The Monitor blog

AWS Virtual Private Cloud (VPC) is an on-demand, isolated section of Amazon Web Services (AWS) that allows you to allocate AWS resources within a custom-defined virtual network.

Datadog is happy to announce our AWS VPC integration, which allows you to monitor all components within your AWS VPC alongside your EC2-classic components.

Monitor AWS VPC

VPC is designed to be a highly performant network and its usage provides access to many additional benefits in conjunction with services available in EC2-classic. Some of the most notable benefits of using a VPC include running your instances on single-tenant hardware, more fine-grained egress and ingress filtering, and the ability to add an additional layer of access control to your instances.

AWS has also developed several new types of instances only available for VPC: C4, T2, and M4. To take advantage of these new instances as well as other VPC benefits, read this starter guide provided by AWS for more in-depth instruction on properly setting up your own VPC.

Once you’ve enabled the AWS integration in Datadog, statuses of your VPC services will be collected automatically and displayed alongside metrics from your EC2-classic instances within your dashboard. You can then add a VPC tag to your hosts, and filter by tag in order to visualize your metrics. With these measures in place, you can immediately correlate VPC metrics with metrics from the rest of your infrastructure and gain insight into your app performance.
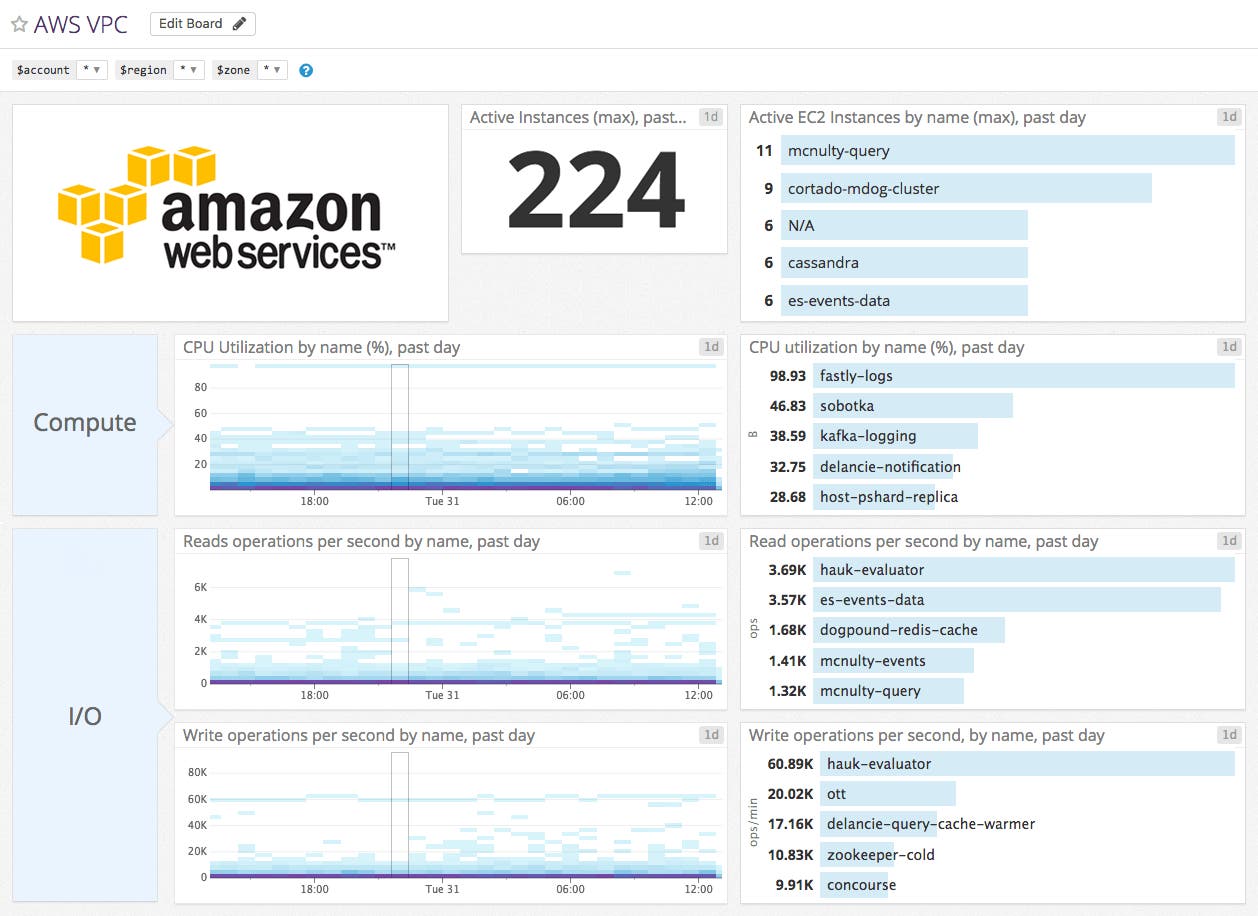
monitor aws vpc image

As with EC2-classic monitoring in Datadog, you can assign additional tags and set custom monitors to alert you when there are status or resource consumption changes within your VPC. Datadog provides customizable, flexible monitoring that is well-suited to the highly configurable nature of VPCs.

Get Started

Datadog customers can start monitoring their VPCs by setting up the AWS integration tile in the integrations list; your VPC components will be crawled automatically. Otherwise, if you’d like to experience running a VPC with a comprehensive monitoring service, sign up for a Datadog trial.