


Charly Fontaine
As containers and orchestrators have surged in popularity, they have created highly dynamic environments with rapidly changing workloads—and the need for equally dynamic ways of monitoring them. After all, orchestration technologies like Kubernetes, DC/OS, and Swarm manage container workloads both at the node level and at the cluster level, which means that you need to gather insights from every layer to fully understand the state of your infrastructure. With that in mind, we are very excited to introduce the Datadog Cluster Agent, which is purpose-built to efficiently gather monitoring data from across an orchestrated cluster.
In order to help illustrate the use case for the Datadog Cluster Agent, let’s take a look at how Datadog users have traditionally collected and aggregated metrics from a Kubernetes cluster. Previously, every worker node in the cluster ran a Datadog Agent that collected data from two sources:
the kubelet, a local daemon that creates the workload on a node
the cluster’s control plane, which consists of the Kubernetes API server, the scheduler, the controller manager, and etcd
You can read more about the each of these components in the official Kubernetes documentation.
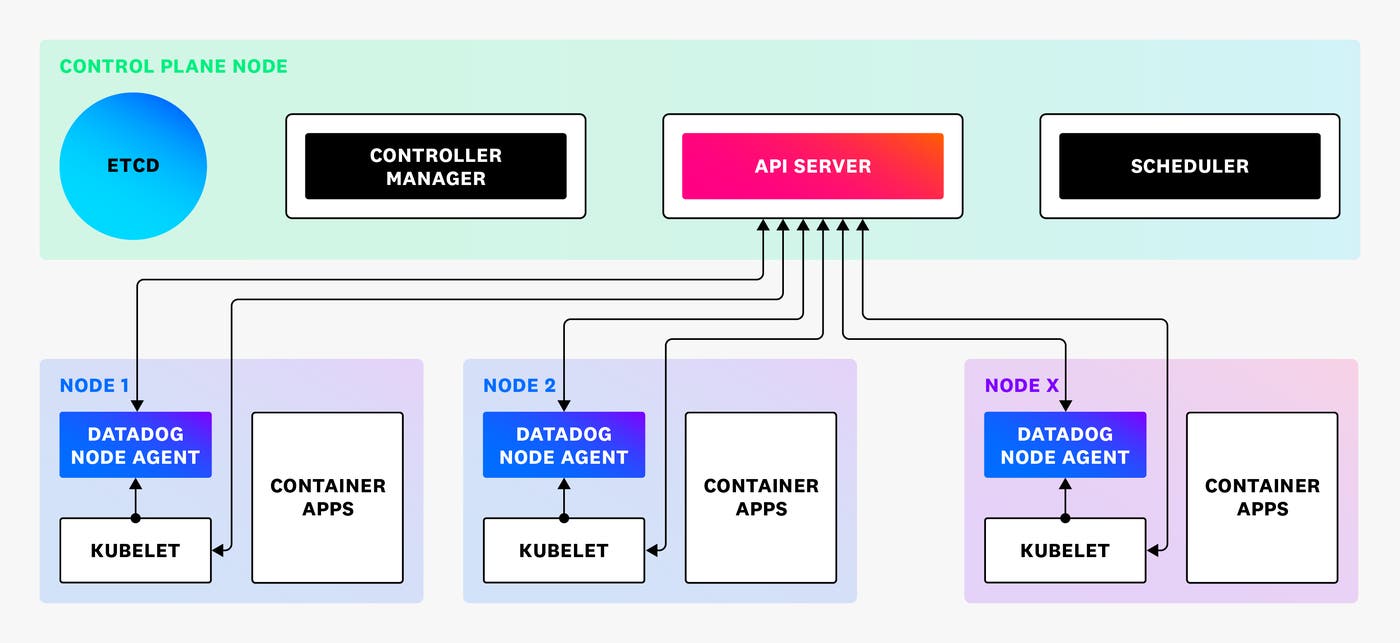
By monitoring the kubelet on each worker node, the Datadog Agent gives you insights into how your containers are behaving and helps you keep track of scheduling-related issues. The Agent also retrieves system-level data and automatically discovers and monitors applications running on the node.
In addition to collecting these node-level metrics, each Datadog Agent individually queries the Kubernetes API server to collect data about the behavior of specific components, as well as to gather key metadata about the cluster as a whole.
Each Agent also retrieves the list of services that target the pods scheduled on that particular node, uses this data to map relevant application metrics to services, and then tags each metric with the appropriate pod name and service. Agents can also be configured to elect a leader that queries the API server regularly to collect Kubernetes events. Although this setup provided visibility into all the layers of your cluster, it put increasing load on the API server and etcd as the size of the cluster increased.
We developed the Datadog Cluster Agent to provide a streamlined, centralized approach to collecting cluster-level monitoring data. This is particularly beneficial for large Kubernetes clusters with hundreds or even thousands of nodes, because it significantly reduces the load on the API server, while still allowing you to surface valuable insights.
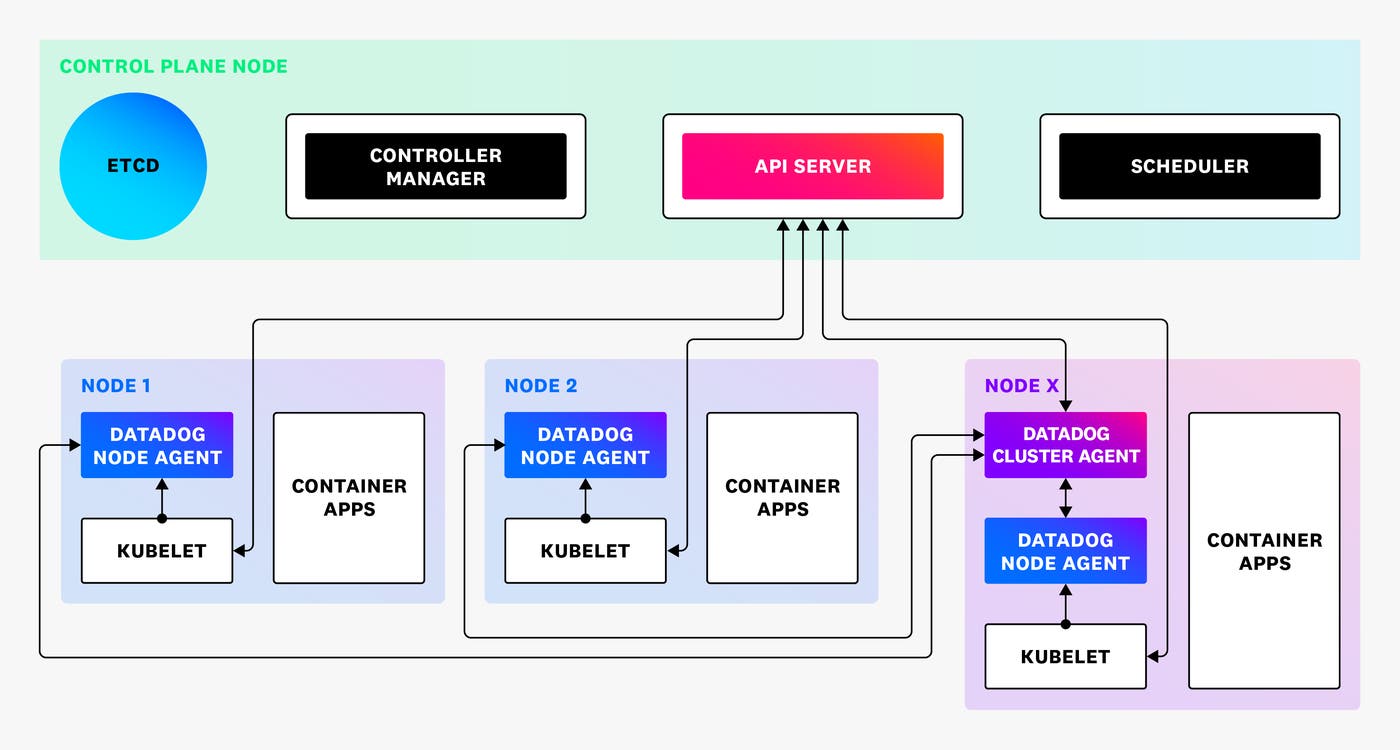
The Cluster Agent acts as a proxy between the API server and the node-based Agents. This not only alleviates the direct load on the API server, but also enables node-based Agents to specifically focus on collecting node-level data, while a dedicated Cluster Agent collects cluster-level data from the control plane. The Cluster Agent relays cluster-level metadata to the node-based Agents, so that they can enrich their locally collected metrics with consistent tags across the cluster. And now that the node-based Agents no longer need to query this data from the API server, you can also reduce their RBAC rules to solely read metrics and metadata from the kubelet.
We’re also excited to share that the Cluster Agent implements the External Metrics Provider interface to expose metrics from your Datadog account to Kubernetes. This gives you a completely automated way to leverage Kubernetes’ Horizontal Pod Autoscaling feature, based on the real-time health and performance data you’re collecting with Datadog (regardless of whether it comes from your cluster or from an external service like AWS ELB). For example, you can create a manifest that autoscales the number of replicas of a web server when the rate of requests per second exceeds a threshold. You can read more about this feature in the dedicated blog post.
While this project was initially driven by the needs of our customers, we have also been testing the Datadog Cluster Agent on our own Kubernetes infrastructure. After deploying the Datadog Cluster Agent on a cluster with hundreds of nodes and more than 20,000 pods and endpoints, we observed a substantial reduction of the load on our API servers.
The Datadog Cluster Agent is now generally available—you can deploy it by following the guidelines in our documentation. If you are already using the Datadog Agent to monitor a Kubernetes cluster, this migration plan can help you roll out the new version of the node-based Agent and benefit from the Cluster Agent.
We would love to hear from you—reach out to our support team with any questions or feedback. As the code for the Cluster Agent is open source, feel free to contribute; instructions to build it can be found in this section of the documentation.
If you aren’t yet a Datadog customer, get started with a two-week, full-featured trial today.
此内容由惯性聚合(RSS阅读器)自动聚合整理,仅供阅读参考。 原文来自 — 版权归原作者所有。