惯性聚合 高效追踪和阅读你感兴趣的博客、新闻、科技资讯
阅读原文 在惯性聚合中打开

推荐订阅源

小众软件
小众软件
N
News and Events Feed by Topic
A
About on SuperTechFans
aimingoo的专栏
aimingoo的专栏
The Cloudflare Blog
H
Heimdal Security Blog
Schneier on Security
Engineering at Meta
Engineering at Meta
Google Online Security Blog
宝玉的分享
宝玉的分享
AI
AI
The GitHub Blog
The GitHub Blog
MongoDB | Blog
MongoDB | Blog
www.infosecurity-magazine.com
The Last Watchdog
The Last Watchdog
T
Troy Hunt's Blog
S
Security @ Cisco Blogs
H
Hacker News: Front Page
F
Fortinet All Blogs
博客园_首页
S
Secure Thoughts
N
News and Events Feed by Topic
P
Proofpoint News Feed
Microsoft Azure Blog
I
InfoQ
Spread Privacy
Spread Privacy
Hacker News - Newest:
Hacker News - Newest: "LLM"
cs.CL updates on arXiv.org
C
Check Point Blog
Hugging Face - Blog
Hugging Face - Blog
Hacker News: Ask HN
Hacker News: Ask HN
C
CXSECURITY Database RSS Feed - CXSecurity.com
酷 壳 – CoolShell
酷 壳 – CoolShell
Stack Overflow Blog
Stack Overflow Blog
L
LINUX DO - 最新话题
Exploit-DB.com RSS Feed
S
Schneier on Security
Know Your Adversary
Know Your Adversary
OSCHINA 社区最新新闻
OSCHINA 社区最新新闻
Scott Helme
Scott Helme
P
Privacy & Cybersecurity Law Blog
S
Securelist
freeCodeCamp Programming Tutorials: Python, JavaScript, Git & More
O
OpenAI News
K
KPMG report finds enterprise disconnect between AI and its ROI | CIO
PCI Perspectives
PCI Perspectives
L
LangChain Blog
雷峰网
雷峰网
Security Archives - TechRepublic
V2EX - 技术
V2EX - 技术

Datadog | The Monitor blog

Introducing our open source AI-native SAST Instrument and monitor Boomi integration flows with OpenTelemetry and Datadog Not all index scans are equal: How we cut query latency by over 99% Platform engineering metrics: What to measure and what to ignore Integrate Recorded Future threat intelligence with Datadog Cloud SIEM CI/CD security: threat modeling using a MITRE-style threat matrix CI/CD security: How to secure your GitHub ecosystem Ingress NGINX is EOL: A practical guide for migrating to Kubernetes Gateway API Operating agentic AI with Amazon Bedrock AgentCore and Datadog LLM Observability: Lessons from NTT DATA Introducing the Datadog Code Security MCP Capture and analyze custom heatmaps in Session Replay Understand session replays faster with AI summaries and smart chapters Monitor ClickHouse query performance with Datadog Database Monitoring How we designed empathetic alert sounds for on-call engineers Search and act across Datadog to resolve issues faster with Bits Assistant Measure the business impact of every product change with Datadog Experiments Analyzing round trip query latency Configuring JavaScript caches for better performance Introducing Bits AI Dev Agent for Code Security Datadog achieves ISO 42001 certification for responsible AI Monitor Nutanix clusters, hosts, and VMs with Datadog Monitor Juniper Mist in Datadog A new Host Map for modern infrastructure Annotate traces to improve LLM quality with Datadog LLM Observability What’s new in Cloud SIEM: AI-powered investigations, enhanced threat intelligence, and scalable security operations Explore Kubernetes with native OpenTelemetry data Monitor Oracle Fusion Cloud Applications with Datadog Announcing the Datadog Terraform provider v4.0.0 Scaling Kubernetes workloads on custom metrics How to design cloud environments for AI-powered threat analysis Monitor Aruba Central in Datadog How we centralize and remediate risks with Datadog Case Management Accelerate incident response with Datadog and ServiceNow Monitor your application and network load balancer logs Understanding Karpenter architecture for Kubernetes autoscaling Tools for collecting metrics and logs from Karpenter Monitor Karpenter with Datadog What your product data is actually saying Key metrics for monitoring Karpenter Securing Datadog’s platform in the AI age: The role of observability data Four ways engineering teams use the Datadog MCP Server to power AI agents Approaching your observability migration with the right mindset Meet the new Bits AI SRE: Deeper reasoning, twice as fast Key learnings from the 2026 State of DevSecOps study Use plain English to query your multi-cloud infrastructure in Resource Catalog Simplifying troubleshooting across the user journey with Datadog Synthetic Monitoring Protect your OCI resources with Datadog Cloud Security This Month in Datadog - February 2026 Amazon EC2 security: How misconfigured and public AMIs expand your cloud attack surface Enable end-to-end visibility into your Java apps with a single command Measure and improve mobile app startup performance with Datadog RUM Evaluating our AI Guard application to improve quality and control cost Identify untested code across every level of your codebase Make use of guardrail metrics and stop babysitting your releases Monitor Versa Networks SD-WAN performance in Datadog Improve performance and reliability with APM Recommendations Remediate transitive vulnerabilities faster with Datadog Software Composition Analysis Generate audit-ready vulnerability and compliance reports with Datadog Sheets Monitor Fortinet FortiManager performance in Datadog Improve test coverage across codebases with Datadog Code Coverage Move fast, don’t break things: Consistent testing standards at scale Enrich logs with ServiceNow CMDB context before routing to any SIEM or logging tool Monitor Lustre with Datadog Make faster, better product decisions with Datadog Product Analytics Surface and remediate runtime posture issues with Workload Protection Findings Protect agentic AI applications with Datadog AI Guard How to optimize JavaScript code with CSS Trace Google Pub/Sub workloads in Cloud Run with Datadog Detect human names in logs with ML in Sensitive Data Scanner How we cut our NLQ agent debugging time from hours to minutes with LLM Observability Debug PostgreSQL query latency faster with EXPLAIN ANALYZE in Datadog Database Monitoring Datadog acquires Propolis Unify and correlate frontend and backend data with retention filters Scale compliance across global frameworks with Datadog Cloud Security Monitor Arista VeloCloud SD-WAN performance with Datadog Building reliable dashboard agents with Datadog LLM Observability Simplify log collection and aggregation for MSSPs with Datadog Observability Pipelines Mitigation for Node.js denial-of-service vulnerability affecting Datadog APM Automate flaky test fixes with the Bits AI Dev Agent and Test Optimization How we built an AI SRE agent that investigates like a team of engineers Datadog integrations 2025 recap: Observability for AI, security, and hybrid cloud Design effective executive dashboards with Datadog Implement dbt data quality checks with dbt-expectations Bring faster visibility into AWS Lambda functions with remote instrumentation Troubleshoot faster with the GitLab Source Code integration in Datadog How Cambia Health Solutions saved $30,000 monthly with Cloud Cost Management and the Datadog Resource Catalog Normalize any logs for Cloud SIEM with Datadog's OCSF processor Optimizing Datadog at scale: Cost-efficient observability at Zendesk Detect, diagnose, and resolve network issues easily with CNM Network Health Connect engineering errors to user impact in early-stage products Cilium configuration for Kubernetes operations at scale Designing feedback loops for progressive delivery Ship features faster and safer with Datadog Feature Flags Choosing the right OpenTelemetry Collector distribution Route your monitor alerts with Datadog monitor notification rules Automate Cloud SIEM investigations with Bits AI Security Analyst Cloud threat detection: How to identify risky activity across control and data planes Collecting Kafka performance metrics Monitoring Kafka with Datadog Monitoring Kafka performance metrics
Expedite infrastructure investigations with Kubernetes Anomalies
Nicholas Thomson, John Kendall, Samir Brizini · 2022-08-03 · via Datadog | The Monitor blog

Modern Kubernetes environments are becoming increasingly complex. In 2021, Datadog analyzed real-world usage data from more than 1.5 billion containers and found that the average number of pods per organization had doubled over the course of two years. Organizations running containers also tend to deploy more monitors than companies that don’t leverage containers, pointing to the increased need for monitoring in these environments.

When platform and application engineers need to investigate incidents within dynamic, containerized environments, finding the most meaningful signals can involve many trial-and-error steps. Now, you can streamline this process with Datadog’s Kubernetes Anomalies, which automatically surfaces anomalies in your Kubernetes clusters. In the Live Containers view, you can filter anomalies based on your current search context, allowing you to accelerate incident investigations, relieve strain on engineers, reduce MTTR, and improve end-user experience.

Quickly detect and investigate anomalies across your Kubernetes environment

Kubernetes helps users automatically schedule and scale containerized applications, but it also introduces ephemerality that presents challenges for monitoring (i.e., pods are frequently launched and restarted across nodes). To help cut through the noise, Watchdog’s Kubernetes Anomalies scans your entire Kubernetes Infrastructure to immediately detect and surface meaningful anomalies, such as:

  • High percentage of unavailable Kubernetes Deployment replicas

  • High percentage of unhealthy nodes

  • High percentage of Pending pods

  • High percentage of OOM-terminated containers

  • High percentage of restarted containers

Watchdog continuously analyzes your infrastructure so it can understand when activity in your containers deviates enough from its historical baseline to be considered anomalous. These anomalies provide immediate insights that can save you valuable time when an issue arises.

Say you are an SRE who recently joined an e-commerce company that runs a number of services on Kubernetes, and you receive a page alerting you to a high number of errors on your site. After verifying that the application team hasn’t recently deployed a new version, you suspect that the issue may be at the infrastructure level. As a new member of the team, you are not yet familiar with the site’s underlying infrastructure, but you navigate to the Live Container view to investigate further. Here, you can see real-time performance data from your Kubernetes workloads and get visibility into every layer of your clusters. You can also see a carousel of anomalies from Watchdog Insights at the top of the page.

View a carousel of anomalies from Watchdog in the Live Containers view

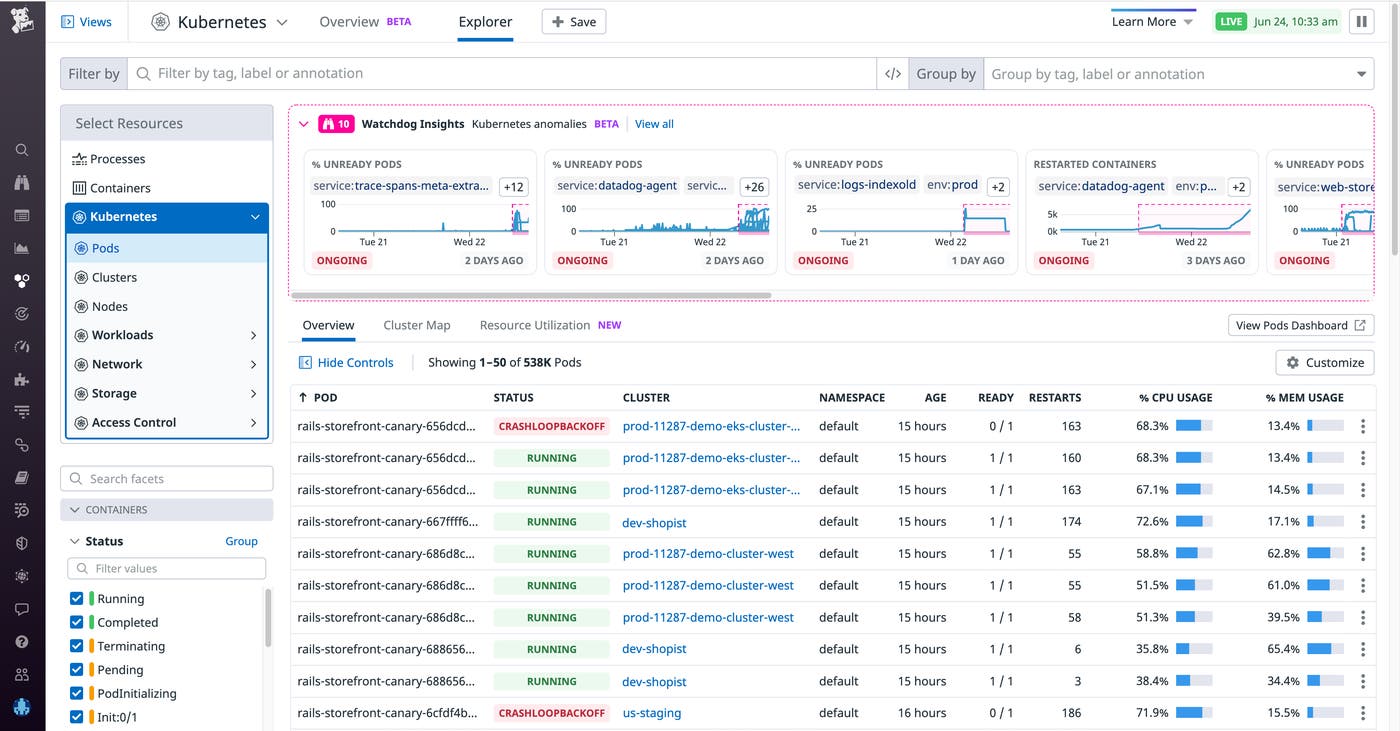
You see an anomalous increase in the number of unready pods and restarted containers. Watchdog Insights prioritizes anomalies based on a number of factors—such as the current state of the anomaly (ongoing or resolved) and its history (i.e., whether it is a new error or an increase in an existing error)—to further guide you in what you should look at first (highest priority on the left side of the carousel). These anomalies are analyzed based on your current search context (e.g., service, env, kube_cluster_name, or kube_namespace). You can narrow down your search context to the service that triggered the alert (e.g., service:web-store) and filter out any anomalies that aren’t relevant to your investigation (e.g., anything detected outside of env:prod) to drill down to the anomaly causing the performance issue.

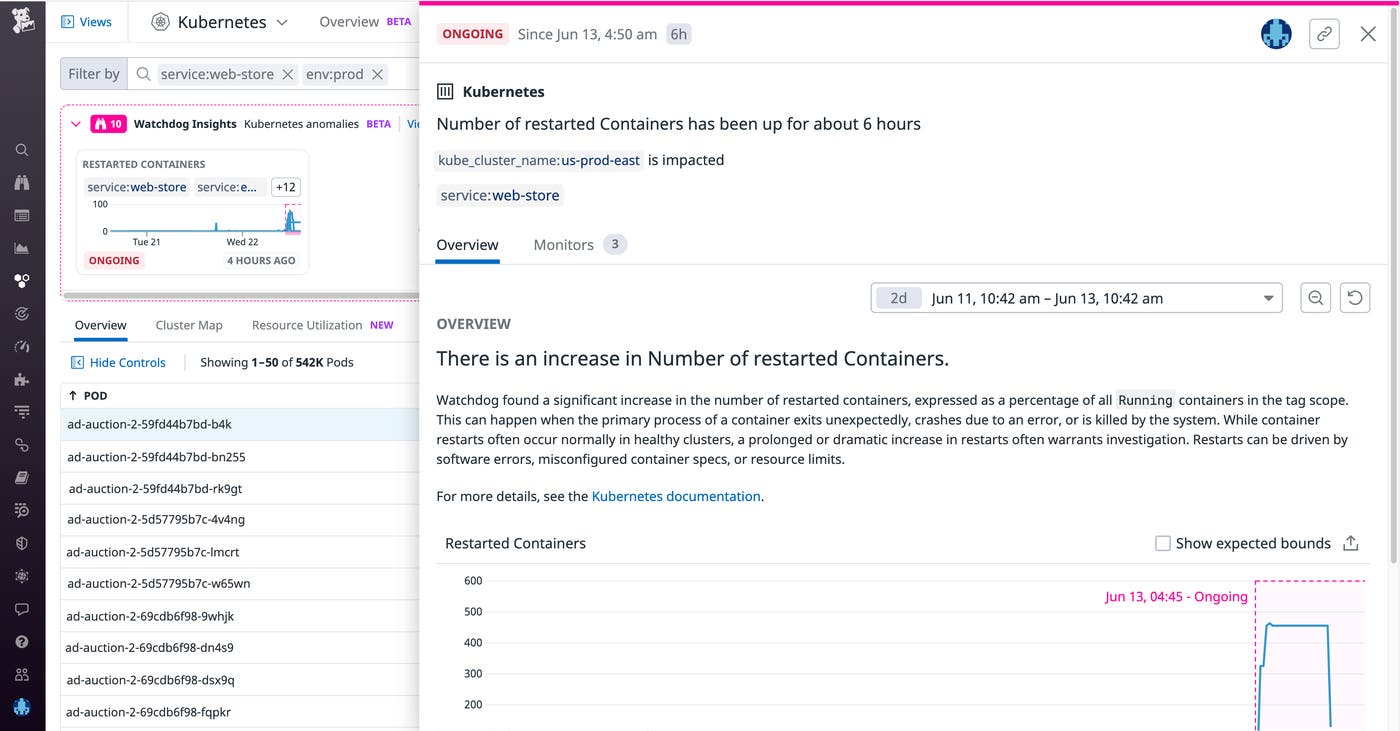
Let’s suppose that, after successfully filtering out unrelated anomalies, you now see just one anomaly in your search context: an elevated number of restarted containers. At a glance, you can gauge the extent of the anomaly: the number of containers affected, when the anomaly started, how it evolved over time, and whether it is still ongoing or not. Tags show you the scope of the anomaly’s impact, including which clusters, services, and namespaces are affected. And the Select Resources call-to-action allows you to scope down your search to show only the underlying resources (pod/cluster/nodes, etc.) relevant to the anomaly you are investigating.

You click on the anomaly to see an in-depth explanation and suggested next steps, which recommend specific tags (in the image below, kube_cluster_name:us-prod-east and service:web-store) to observe logs, traces, and metrics from the relevant pods, nodes, and containers.

Click on an anomaly to view an in-depth explanation of the detection

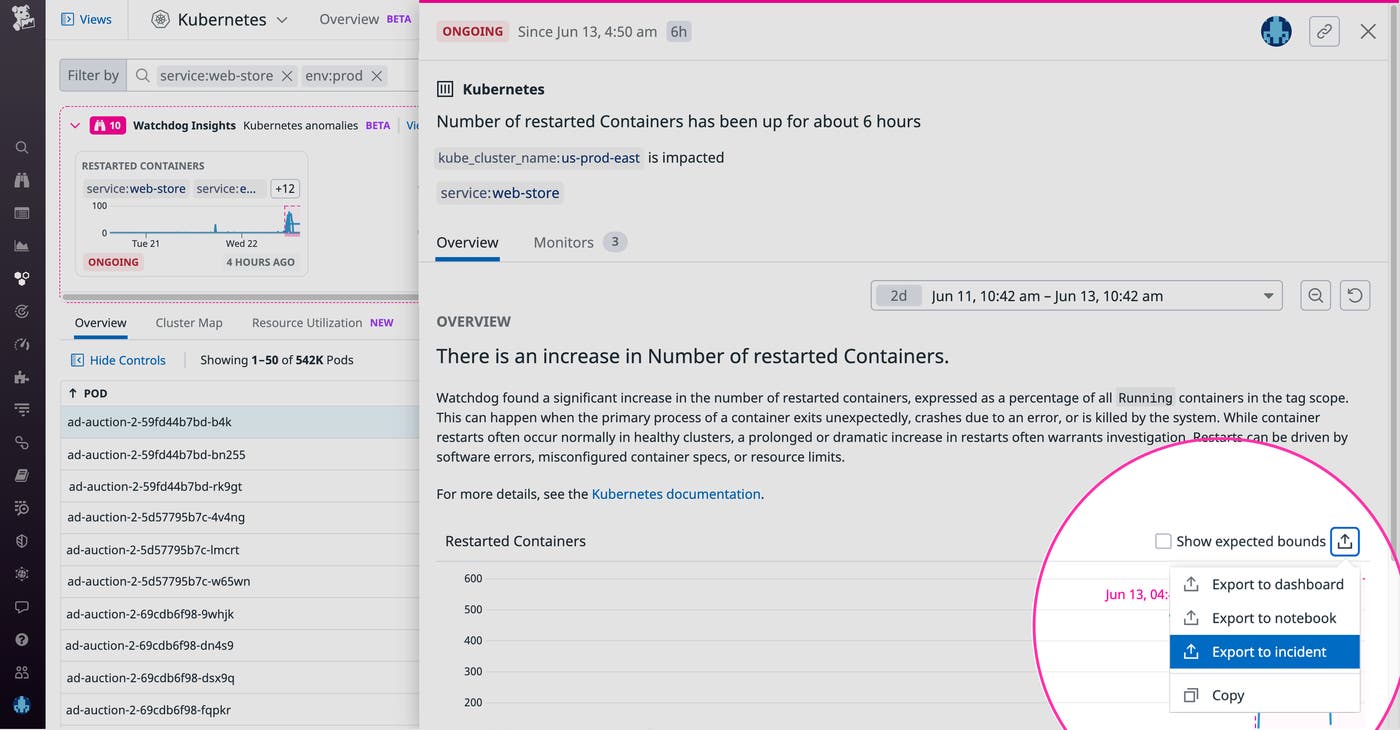
To continue our hypothetical scenario, let’s assume that you then alert a platform engineer to the issue with the us-prod-east cluster. Upon further investigation, the platform engineer finds that the containers are restarting because their memory limit was set too low. Knowing this, the engineer is able to increase the memory limit so that the pods can get rescheduled, eliminating the errors from your customer experience. As in the screenshot below, you can easily export the timeseries to your incident management workflow so that other team members can track this issue’s resolution. Once the issue is resolved, you can add the anomaly to a Notebook to create a postmortem, facilitating cross-team collaboration and the prevention of future incidents.

Easily export an anomaly to a Notebook

Proactively investigate Kubernetes anomalies with Watchdog Insights

Watchdog Insights automates the process of detecting and troubleshooting issues in your Kubernetes clusters. Now, engineers can effectively resolve incidents in far less time, regardless of their prior knowledge of the infrastructure involved. Kubernetes Anomalies complements Datadog’s host of Kubernetes monitoring tools, as well as other Watchdog features such as Root Cause Analysis, Watchdog for Infra, Log Anomaly Detection, and Watchdog Insights. If you’re new to Datadog, sign up for a 14-day free trial to start detecting anomalies across all your services automatically.