


For engineers in charge of supporting Go applications, diagnosing and resolving memory issues such as OOM kills or memory leaks can be a daunting task. Practical and easy-to-understand information about Go memory metrics is hard to come by, so it’s often challenging to reconcile your system metrics—such as process resident set size (RSS)—with the metrics provided by the old runtime.MemStats, with the newer runtime/metrics, or with profiling data.
If you’ve been looking for this kind of information, then you’re in luck. This blog post aspires to be the missing “Go memory metrics primer” that can help you in your troubleshooting efforts. It will cover the following:
An overview of Go application memory
How to analyze Go memory usage
New APM runtime metrics dashboards
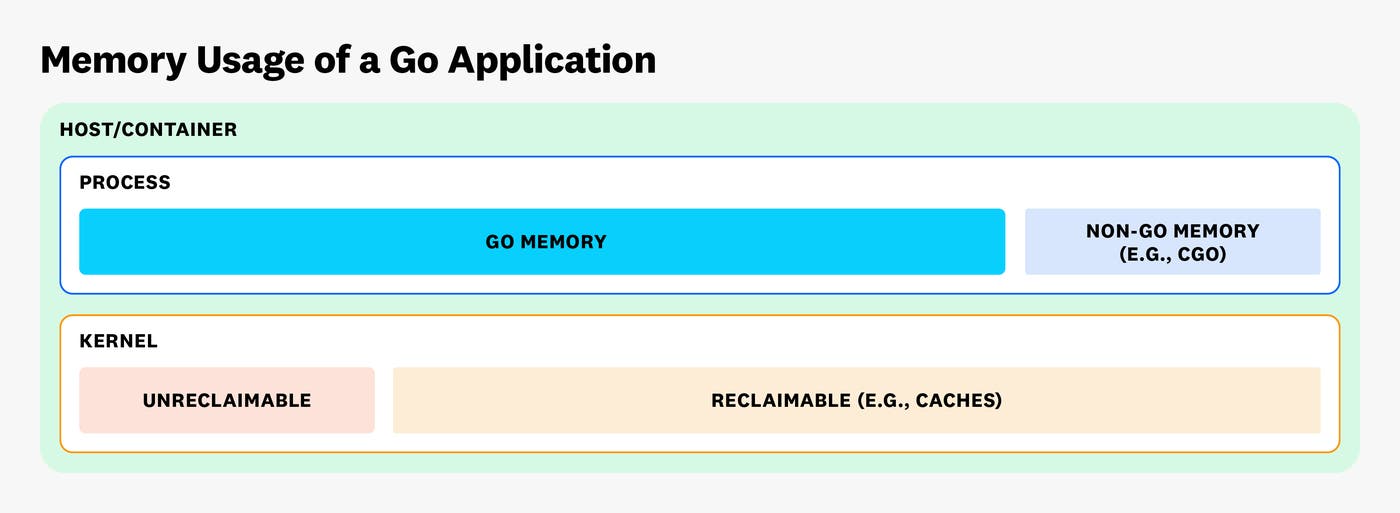
A Go program’s memory usage can be broken down into process memory and kernel memory. Process memory consists of both Go memory (managed by the Go runtime) and non-Go memory (allocated using either cgo or syscalls like mmap, loaded binaries, etc.). The kernel memory breaks down into unreclaimable memory as well as reclaimable memory (e.g., caches) that can be freed up under memory pressure.
In this article we’ll focus specifically on memory that is managed by the Go runtime. However, it’s important to keep the bigger picture of memory usage in mind because the OOM killer in the Linux kernel also takes non-Go memory and kernel memory into consideration.
Let’s start with an important nugget of information that’s found in the documentation for the runtime/debug package (with credit to Michael Knyszek at Google for pointing this out):
[T]he following expression accurately reflects the value the runtime attempts to maintain as the limit: `runtime.MemStats.Sys − runtime.MemStats.HeapReleased` or in terms of the runtime/metrics package: `/memory/classes/total:bytes − /memory/classes/heap/released:bytes`
What might not be obvious here is that this value is also the runtime’s best estimate for the amount of physical Go memory that it is managing. And though this last statement is a bit imprecise (see the next section to find out why), for now, you should take away the following: If this estimate is close to the process RSS number reported by your OS, then your program’s memory usage is probably dominated by Go memory. This would be good news for you: it would mean that you should be able to use runtime metrics, profiling, and garbage collector (GC) tuning to address any issues you might have. (Note that the topic of GC tuning is generally beyond the scope of this article, but you can consult the Go documentation for in-depth information about this topic.)
When you see a number that is much higher than the RSS reported by the OS, continue to the next section below, “Virtual Go memory.” There might still be hope that you can estimate Go memory usage accurately enough to diagnose the memory issues with your application.
However, if you find that this number is much lower than the RSS reported by the OS, your program is probably using a lot of non-Go memory, typically from using cgo or mmap. You can estimate how much of this memory you need to hunt down by taking your process RSS usage and subtracting the Go memory value from above. That being said, debugging non-Go memory problems is tricky and unfortunately out of scope for this article.
Now let’s talk about the technical imprecision alluded to in the previous section. The physical Go memory estimate above is actually calculated out of virtual memory metrics. For example, let’s say you include these lines in your program:
const GiB = 1024*1024*1024
data := make([]byte,10*GiB)
You might assume that this code will use 10 GiBs of physical memory. However, in reality, it will only increase your virtual memory usage (MemStats.Sys or /memory/classes/total:bytes). Physical memory will only be used when you fill the slice with data.
Unfortunately, in other words, the Go runtime tracks only virtual memory. So from this perspective, you can’t completely trust any runtime metrics when it comes to understanding physical memory usage. But despite this caveat, the lack of any direct reporting on physical memory from the Go runtime is usually not a problem in practice. Unless you’re using some old GC hacks (as opposed to setting a soft memory limit, which is preferable in most situations today), you can assume that essentially all of your Go memory is backed by physical memory.
Now that you can estimate your physical Go memory usage, let’s explore the options for breaking it down. This will allow you to diagnose the memory problems you might be facing.
The runtime/metrics package that was introduced in Go 1.16 makes it easy to get started on this task. We basically only need to stack all /memory/classes/ metrics except heap/released:bytes and total:bytes on a graph.
However, these metrics provide so much detail that it could overwhelm busy practitioners. In the table below we have simplified these metrics into a few categories that are easier to understand. Relying on information in the Go source code, we have also mapped the newer metrics to the older MemStats metrics (if you are still collecting them for legacy reasons).
Note: This list is accurate as of Go 1.21. New memory metrics might be added in the future.
| runtime/metrics | MemStats | Category |
|---|---|---|
| /memory/classes/heap/objects:bytes | HeapAlloc | Heap Live & Dead Objects |
| /memory/classes/heap/free:bytes | HeapIdle - HeapReleased | Heap Reserve |
| /memory/classes/heap/unused:bytes | HeapInuse - HeapAlloc | Heap Reserve |
| /memory/classes/heap/stacks:bytes | StackInuse | Goroutine Stacks |
| /memory/classes/os-stacks:bytes | StackSys - StackInuse | OS Thread Stacks |
| /memory/classes/metadata/other:bytes | GCSys | GC Overhead |
| /memory/classes/metadata/mspan/inuse:bytes | MSpanInuse | Allocator Overhead |
| /memory/classes/metadata/mspan/free:bytes | MSpanSys - MSpanInuse | Allocator Overhead |
| /memory/classes/metadata/mcache/inuse:bytes | MCacheInuse | Allocator Overhead |
| /memory/classes/metadata/mcache/free:bytes | MCacheSys - MCacheInuse | Allocator Overhead |
| /memory/classes/other:bytes | OtherSys | Runtime Overhead |
| /memory/classes/profiling/buckets:bytes | BuckHashSys | Profiler Overhead |
In the image below, you can see how this might look on a graph for a real-world application. The dotted line on top, representing Go Total, is revealing the Go memory value calculated by using the arithmetic expression in the quoted section above. The lower dotted line, representing Heap Total, is computed by adding the Heap Live & Dead Objects and Heap Reserve values. The sawtooth pattern of the line representing Heap Live & Dead Objects is caused by the GC, but it might look different for you depending on how your metric aggregation windows line up with your GC cycles. For your own applications you’ll probably also see less memory usage in Goroutine Stacks than you do in this example because this particular program happens to use a lot of goroutines.
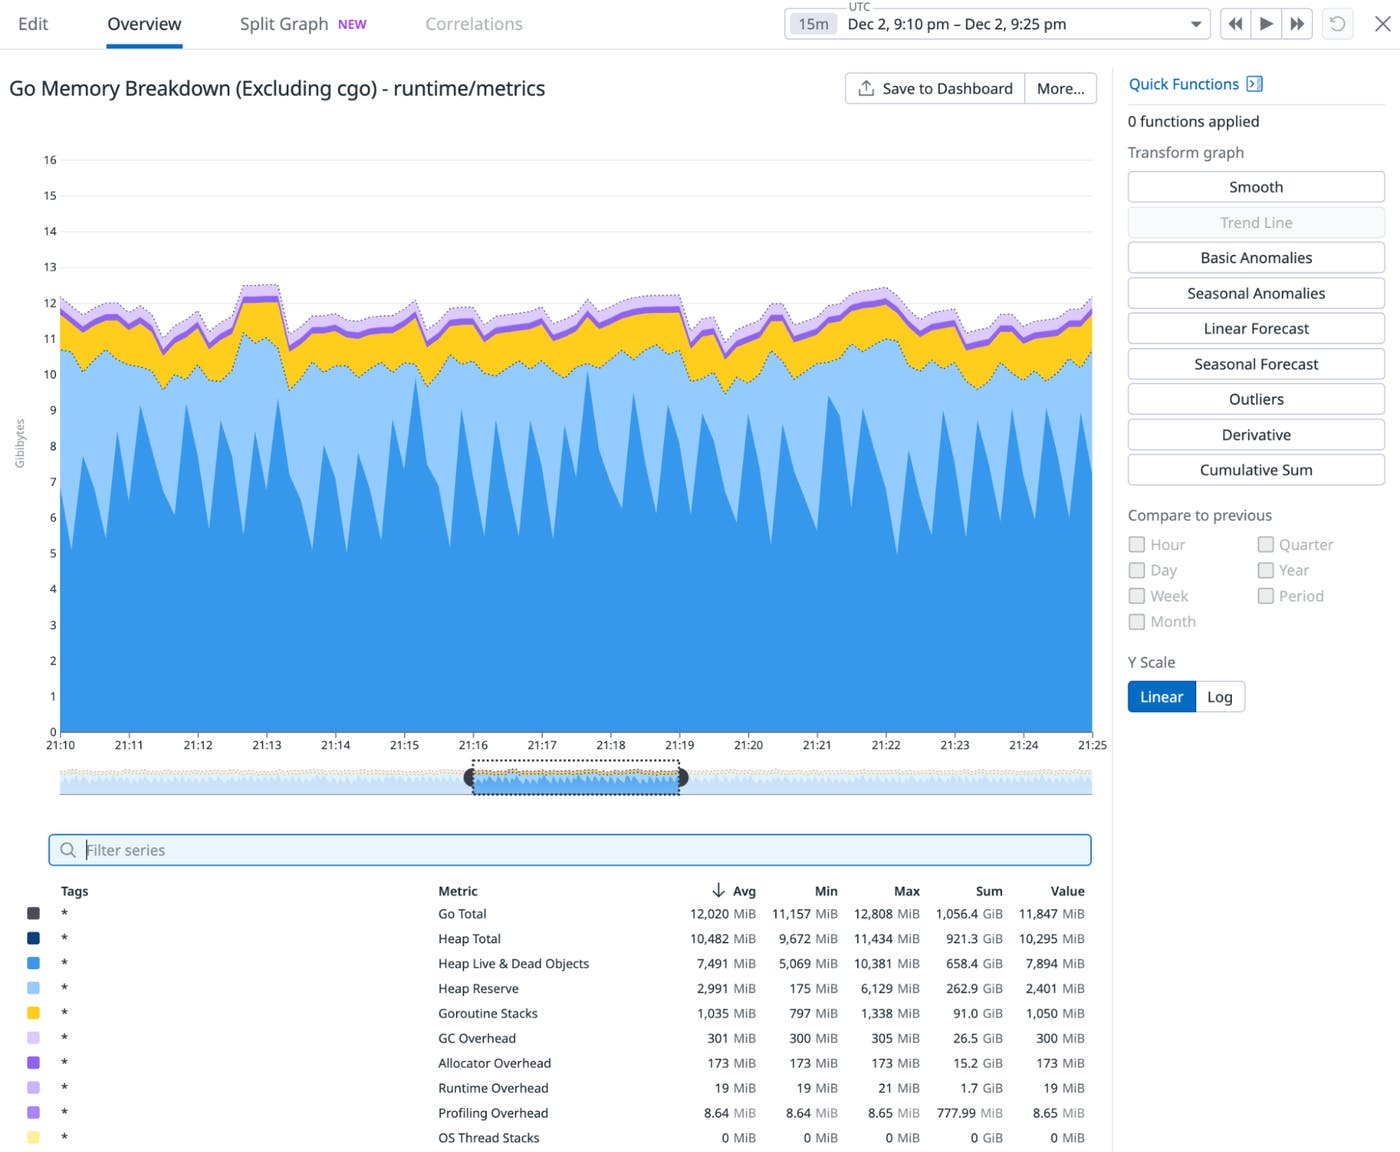
Now let’s talk about how you can use this breakdown. If you see the Heap Total number trending up under steady load, you probably have a memory leak. If you also see Goroutine Stacks trending up, this might be caused by a goroutine leak. In both cases, continue with profiling. If instead those numbers are merely spiky—but occasionally enough to cause OOMs—you might also be interested in GC tuning (especially by setting a soft memory limit).
The best way to break down your heap usage is to use Go’s built-in heap profiler. (See a description of the heap profile and other predefined profiles here.) If you’re using go tool pprof, select the inuse_space sample type, as shown below. This will show you the allocations made by your application that were reachable during the most recent GC cycle. (Note also that the official GC guide refers to this inuse_space as “live heap memory.”)
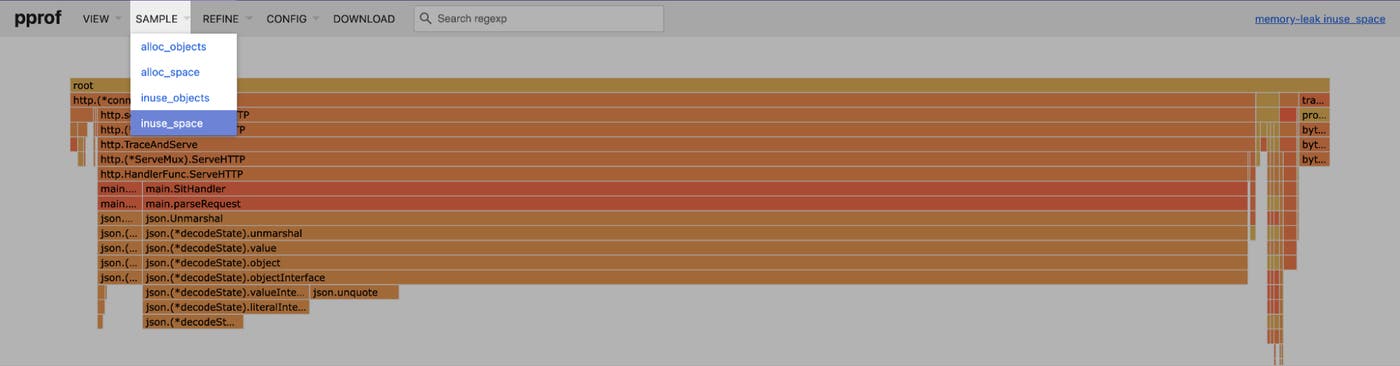
If you’re using Go’s heap profiler for the first time, it might surprise you to discover that it reports less than half of your process’s actual memory usage. The reason for this is that the profiler measures the heap’s low watermark right after a GC cycle (a.k.a. /gc/heap/live:bytes since Go 1.21). The GC uses this value to calculate the heap target, which dictates when the next GC cycle will occur. This calculation depends on GOGC, and the default of 100% allows the heap to double in size before the next GC cycle. For this reason, you should multiply the numbers you see in heap profiles by two to roughly estimate true memory usage.
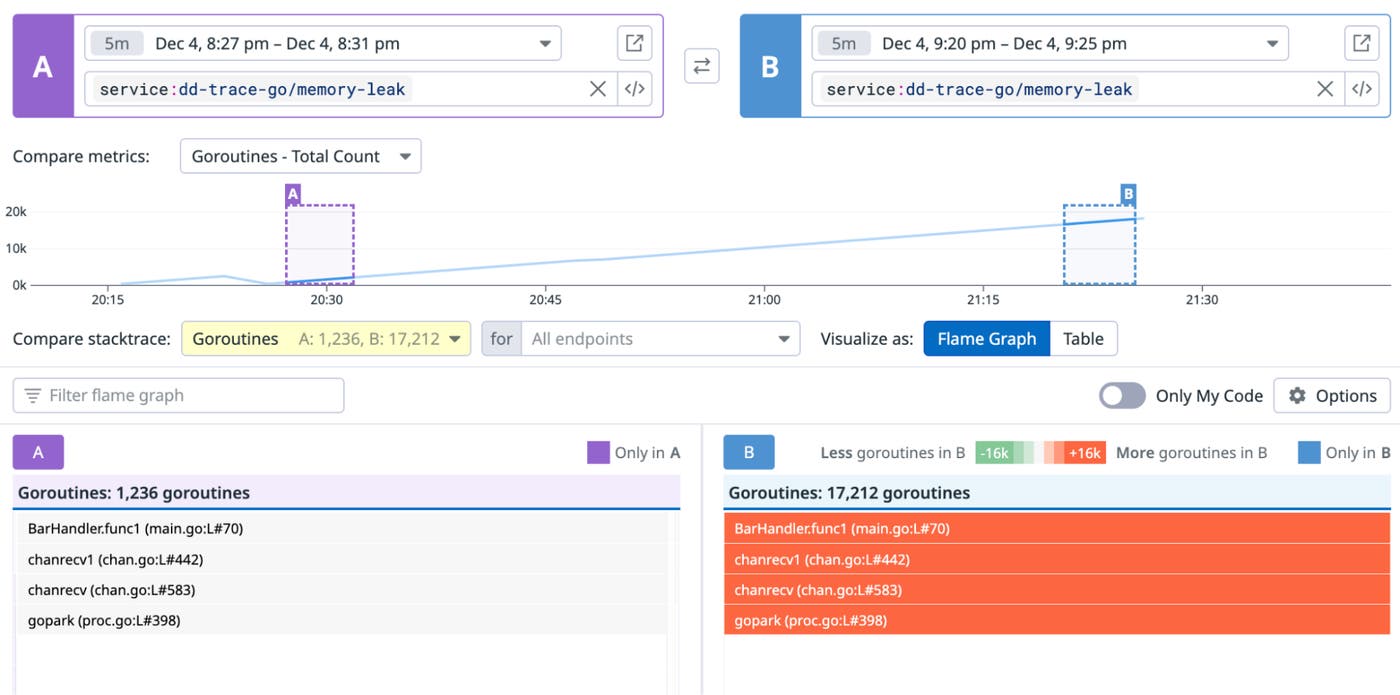
If you’re dealing with a memory leak, you should try to diff two heap profiles that were taken some time apart. You can do this by using pprof with the -diff_base or -base flag. Or, as a Datadog customer, you can use our comparison view as shown in the following image:
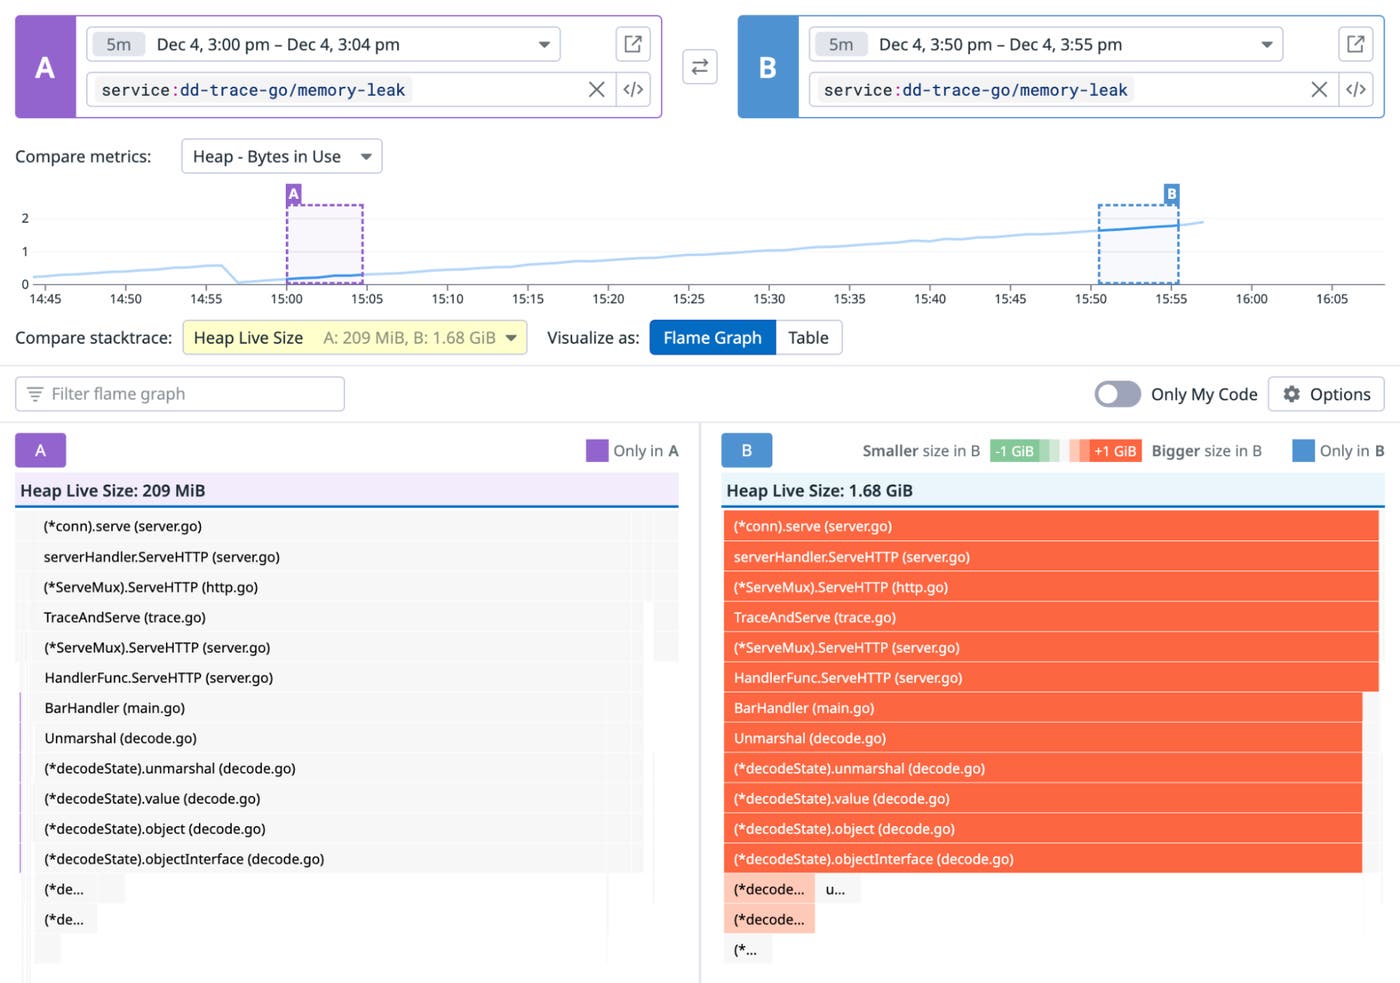
This comparison view will help reveal the allocation origin of the memory you are leaking. It will also often allow you to identify the goroutines or global data structures that keep the memory alive.
If you see a high amount of memory usage in the Goroutine Stacks metric, the goroutine profile can help you by letting you break down your goroutines by stack trace. Through this functionality, you can also identify oversized goroutine pools and similar issues.
In case of a goroutine leak, you can also diff your goroutine profiles to determine which goroutines are leaking, and why. For example, the comparison view below reveals that about 16 thousand BarHandler.func1 goroutines have leaked because they are stuck on a channel receive operation in main.go on line 70.
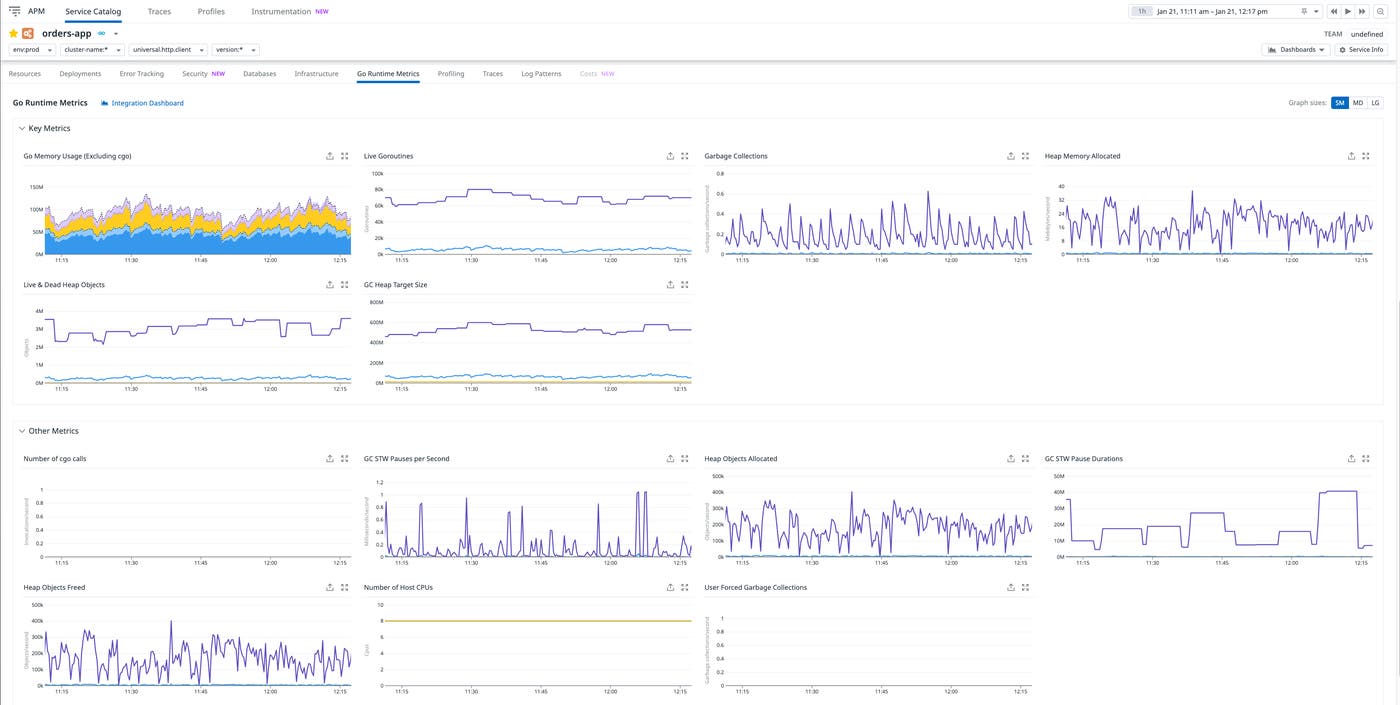
To help you with application monitoring and diagnostics, we at Datadog have recently revamped our APM runtime metrics dashboards—including those for Go applications. So if you’re a customer and have Go runtime metrics enabled, you will now get a Go Runtime Metrics built-in dashboard with a memory usage breakdown and many other helpful metrics:
Go’s runtime metrics can give you great visibility into the Go memory usage of your program. Here are the main tips for using these metrics to help you resolve memory issues:
Estimate your Go memory usage arithmetically by using the expression “/memory/classes/total:bytes − /memory/classes/heap/released:bytes,” and then break it down as described in this article.
Estimate your non-Go memory usage (e.g., cgo) arithmetically by using the formula “Process RSS − Go memory,” but be aware that it’s tricky to break this non-Go memory usage down any further.
Use profiling to break down your heap memory usage. Multiply the numbers by two in your head to align with process RSS.
Don’t forget to also look at kernel memory usage when diagnosing memory issues.
Armed with this knowledge, you should be able to reconcile the numbers reported by your OS with the metrics provided by the runtime.
For more information about Go garbage collection and memory optimization, see the official documentation. And to get started with Datadog, you can sign up for our 14-day free trial.
此内容由惯性聚合(RSS阅读器)自动聚合整理,仅供阅读参考。 原文来自 — 版权归原作者所有。