


Thomas Sobolik
Senior Technical Content Writer

Ashwin Gandhi
Azure AI Search is Microsoft Azure’s managed search service. In addition to tackling traditional search use cases, Azure AI Search also includes AI-powered features to make it a fully capable document catalog, search engine, and vector database. AI Search is highly interoperable—it can use models created in Azure OpenAI Service, Azure AI Studio, or Azure ML.
With full visibility into over 60 related Azure services, including Azure CosmosDB, Azure Kubernetes Service, and Azure App Service, Datadog makes it easier to deliver optimal performance across both internal and customer-facing LLM applications. We’re pleased to announce that Datadog now also integrates with Azure AI Search, enabling you to track the performance and usage of your AI Search services with Datadog dashboards and monitors.
In this post, we will discuss how you can monitor your Azure AI Search services with Datadog to analyze query performance and track outages.
Once you’ve set up the integration, you can ingest a number of key metrics from Azure AI Search into Datadog. The out-of-the-box dashboard provides a high-level overview of this data. For example, you can monitor query throughput and latency for each search service in your environment by using the “Queries Per Second by Service” and “Search Latency by Service” widgets. Query throughput and latency will determine the responsiveness of your search service for users, so it’s important to ensure these metrics are behaving as expected, without any sudden or unexplained throughput decreases or latency spikes.
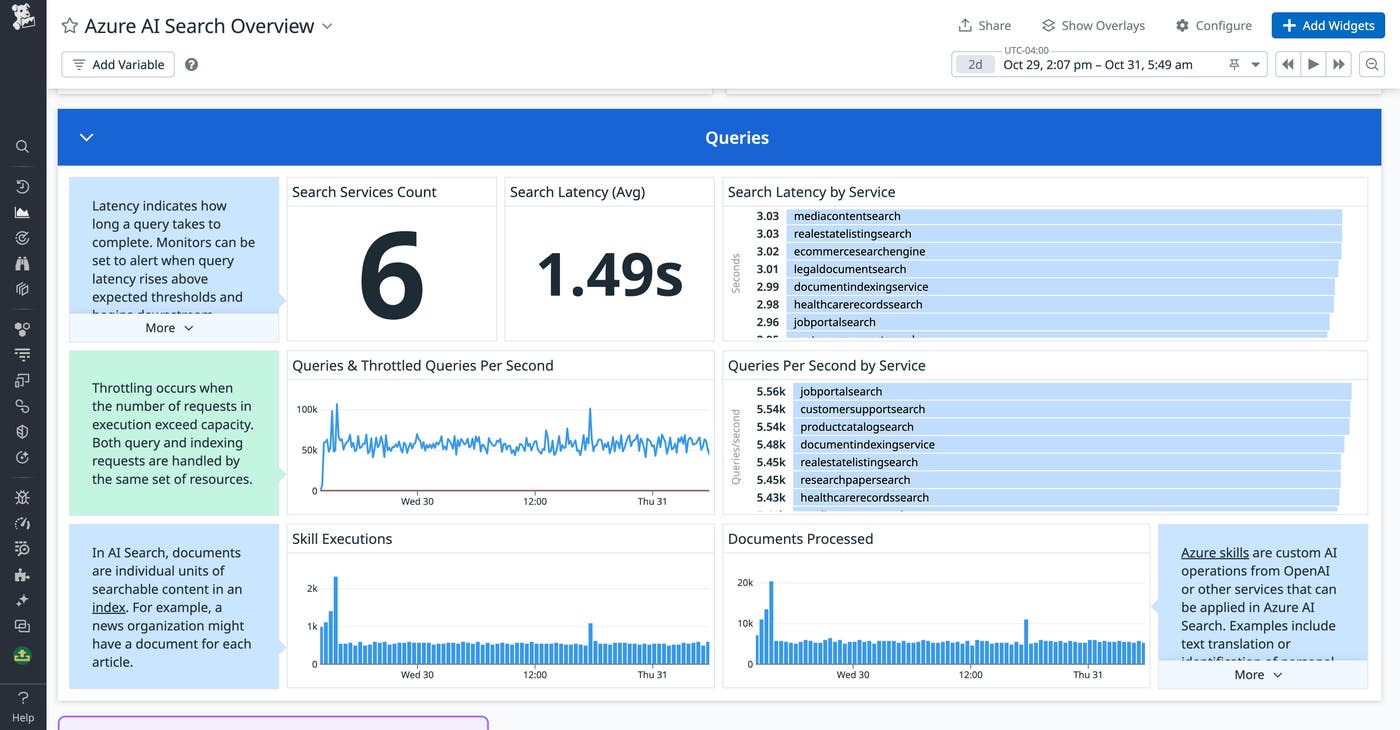
Additionally, you can track the executions of skills, which are custom AI operations—such as text translation or identification of personal information—used to assist in searches. By using the dashboard to analyze query performance, you can spot issues including low throughput, elevated search latency, and throttled queries. These issues can cause a slow search experience and failed searches, so it’s important to continually track them and quickly escalate them to responders.
The integration also includes an out-of-the-box monitor to give responders timely notifications when the throttled_search_queries_percentage metric reaches a problematic threshold (over 10 percent). High query throttling indicates that the search service is at capacity and cannot accept any more requests.
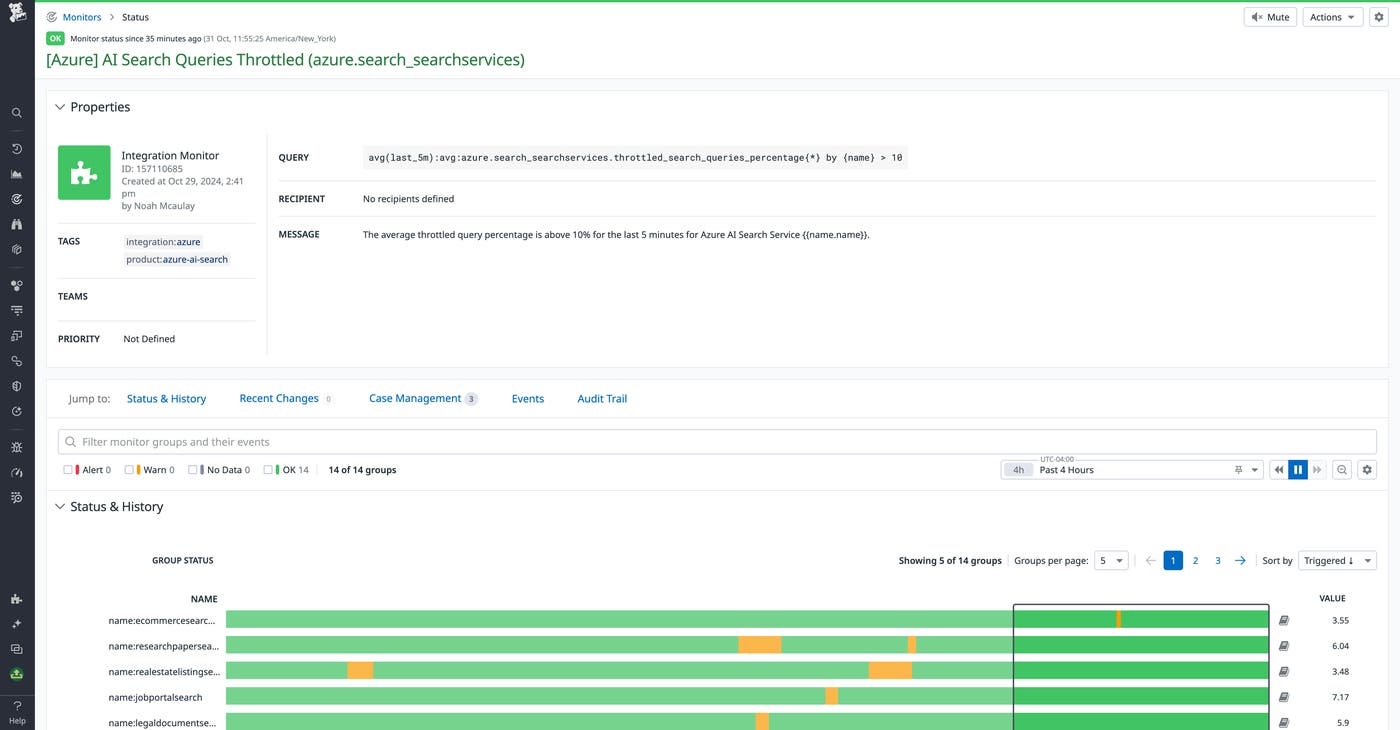
By alerting your engineers when query throttling is high, this monitor helps them quickly scale out their search services to prevent a significant number of dropped queries that could cause an outage and affect downstream services.
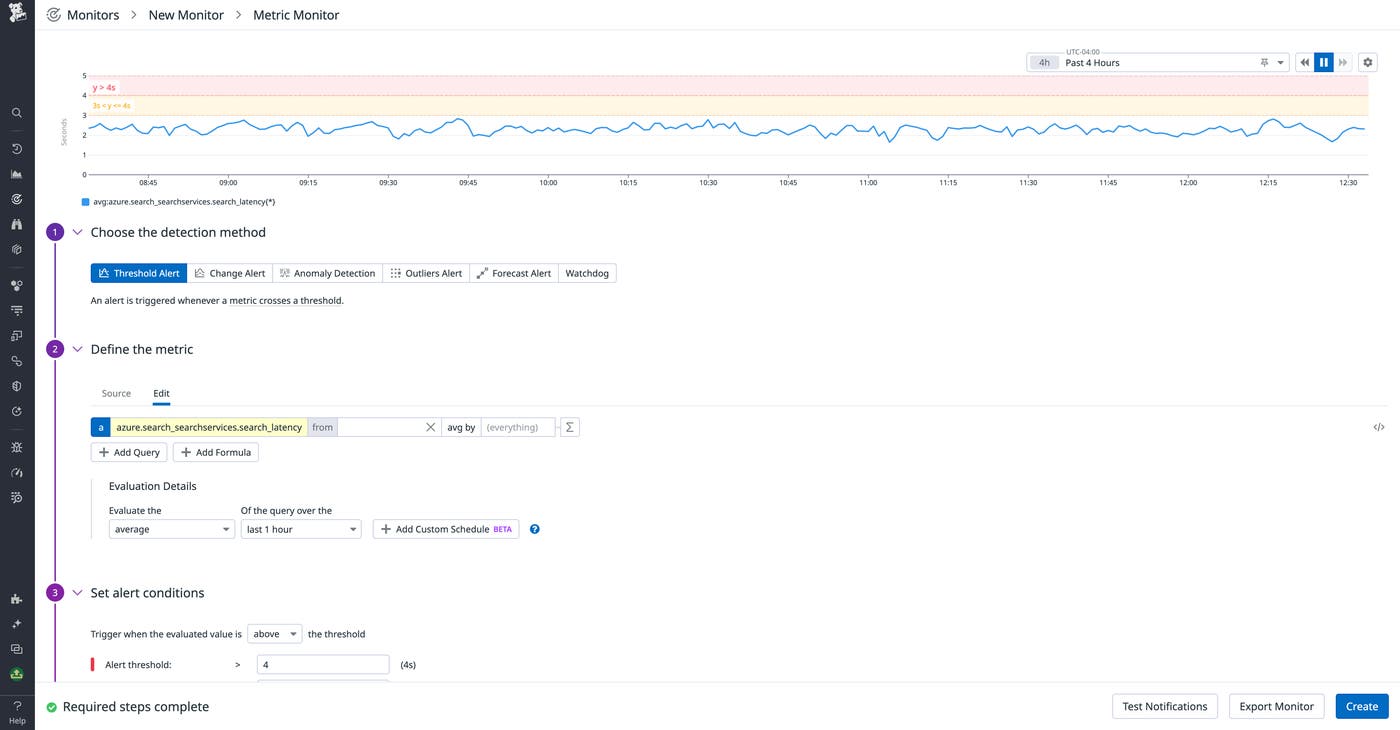
You can also create your own custom monitors for any of the other out-of-the-box Azure AI Search metrics. For example, you might create a monitor for search latency to indicate when the search experience for a particular service becomes degraded. Once you’ve been alerted to elevated search latency, you can scale out the service or investigate slow queries to see if they can be optimized.
Datadog’s Azure AI Search integration lets you track the health and performance of your Azure AI Search services alongside the rest of your Azure infrastructure and application stack. This way, you can quickly spot and remediate issues affecting your search experience and mitigate the customer impact.
The integration is now generally available for all Datadog customers—see our documentation for more information about how to get started. If you’re brand new to Datadog, sign up for a free trial to get started.
此内容由惯性聚合(RSS阅读器)自动聚合整理,仅供阅读参考。 原文来自 — 版权归原作者所有。