








A concise multiplatform language developed by JetBrains
Introducing Tracy: The AI Observability Library for Kotlin
Read this post in other languages:
Tracy is an open-source Kotlin library that adds production-grade observability to AI-powered applications in minutes. It helps you debug failures, measure execution time, and track LLM usage across model calls, tool calls, and your own custom application logic. Ultimately, comprehensive observability ensures you have the exact data needed to understand real-world application behavior, analyze performance from high-level trends down to granular traces, and power comprehensive online and offline evals.
It works seamlessly with common Kotlin/LLM stacks (including OkHttp and Ktor clients, as well as OpenAI, Anthropic, and Gemini ones) while relying on OpenTelemetry under the hood. This architecture guarantees complete flexibility over your trace data, enabling both standard exporting to any compatible backend (like Jaeger, Zipkin, or Grafana) and direct integration with dedicated LLM engineering platforms like Langfuse and W&B Weave.
While full-fledged AI frameworks like Spring AI or Koog provide built-in observability, LLM calls must be made exclusively through their framework APIs to be traced, and they do not provide an easy way to trace the internal application flow. In contrast, Tracy helps you monitor LLM usage through API or HTTP client instrumentation. It also helps you unwind the timing of and causal relationships between AI components or internal AI-agent states by annotating Kotlin functions or blocks of code.
By making Tracy open-source, we invite you to help extend its functionality – whether by requesting new integrations for AI backends and API clients, or by submitting pull requests to implement them.
Components of AI observability and how Tracy helps
As engineers, whether we’re adding observability to an existing application or building a new one from scratch, we want to trace, store, and analyze the following:
- LLM call metadata, including the API being called, the model, and its parameters. Optionally, we may want to track LLM inputs and outputs during development for debugging, while ensuring they are not traced in production.
- Application logic flow that leads to and from LLM calls – where a certain call originates and which tools are involved.
Imagine a very simple LLM chat application that greets the user, employing tools to make the greeting more personal. Using the OpenAI client, the application code might look like this:
/** Interface for LLM tool */
interface Tool<T> {
   /** Tool call */
   fun execute(): T
}

/** Gets the current user's name from the system */
class GetUserName() : Tool<GetUserName.UserNameResult> { ... }

/** Gets the current date and time */
class GetCurrentDateTime() : Tool<GetCurrentDateTime.DateTimeResult> { ... }

fun main() {
   // Create OpenAI-client using environment variables
   val client: OpenAIClient = OpenAIOkHttpClient.fromEnv()
   ...
   val params = ResponseCreateParams.builder()
       .model(ChatModel.GPT_4O_MINI)
       .maxOutputTokens(2048)
       .addTool(GetUserName::class.java)
       .addTool(GetCurrentDateTime::class.java)
       .input(ResponseCreateParams.Input.ofResponse(inputs))
       .build()

   // Get the response.
   // In a real application, it would use a loop to process tool calls.
   val response: Response = client.responses().create(params)
   ...
   println(finalGreeting)
}
The important things to trace here are:
- The fact that the greeting agent was called.
- The LLM calls.
- The tool executions.
We could use the basic OpenTelemetry SDK, but that would require us to add instrumentation code manually, and it would lead to code repetition for tool call traces.
In an ideal scenario, we would be able to configure tool tracing once and have all implementations traced automatically, ensuring we never end up in a situation where newly added tools go untraced. Tracy makes this scenario a reality.
Adding observability with Tracy
Tracy provides three high-level APIs that help us fully cover our chat application with tracing.
Scoped spans
The withSpan API allows you to create scoped spans. These spans automatically activate when a block starts and end when the block finishes, ensuring correct nesting and timing.
fun main() {
   // Encapsulation into withSpan ensures that all nested events will be
   // traced as part of the greeting agent’s work.
   withSpan("Greeting agent") {
       ...
   }
}
LLM client instrumentation
LLM calls are a crucial part of any AI agent. They define the cost, latency, and efficiency of the application, and they are the first things to be investigated if something goes wrong. That’s why adding observability to an LLM client should be straightforward and require minimal changes to the codebase. For example, adding instrumentation to your OpenAI client is as easy as:
val client = OpenAIOkHttpClient.fromEnv()
// All calls made with the instrumented client are traced.
instrument(client)
By default, client instrumentation traces metadata only. To trace LLM inputs and outputs, which may contain sensitive data, you must explicitly enable this programmatically with:
TracingManager.traceSensitiveContent()
Alternatively, you can enable it at runtime by setting the TRACY_CAPTURE_INPUT and TRACY_CAPTURE_OUTPUT environment variables to true.
Tool calls and function tracing
LLMs love tools: They help the LLMs effectively complete deterministic tasks, save tokens, and interact with the environment they operate in. As developers, we love tools as well, but adding observability for each and every LLM tool in the codebase is a mundane task that is easy to forget.
While decorators shine for such scenarios in Python frameworks, Kotlin developers previously could only look on with envy. Tracy changes things for the better. With annotation-based tracing, you simply have to add the @Trace annotation to an interface method to enable tracing in all implementing classes. If you have an isolated method you want to trace, it’s just as easy. The @Trace annotation works on individual methods or functions as well.
/** Interface for LLM tool */
interface Tool<T> {
   // All tool calls are now traced
   @Trace(name = "Tool Call")
   fun execute(): T
}
Bringing it all together
Capturing telemetry from the application is only half the battle. The other half is routing it to a proper backend where it can be stored and analyzed. While we definitely recommend using observability solutions that target LLM tracing specifically, and provide support for Langfuse and W&B Weave out of the box, Tracy also offers effortless ways to send traces to any OpenTelemetry-compatible backend, file, or console. The repository contains a number of examples, and the complete code for the example from this article is available here.
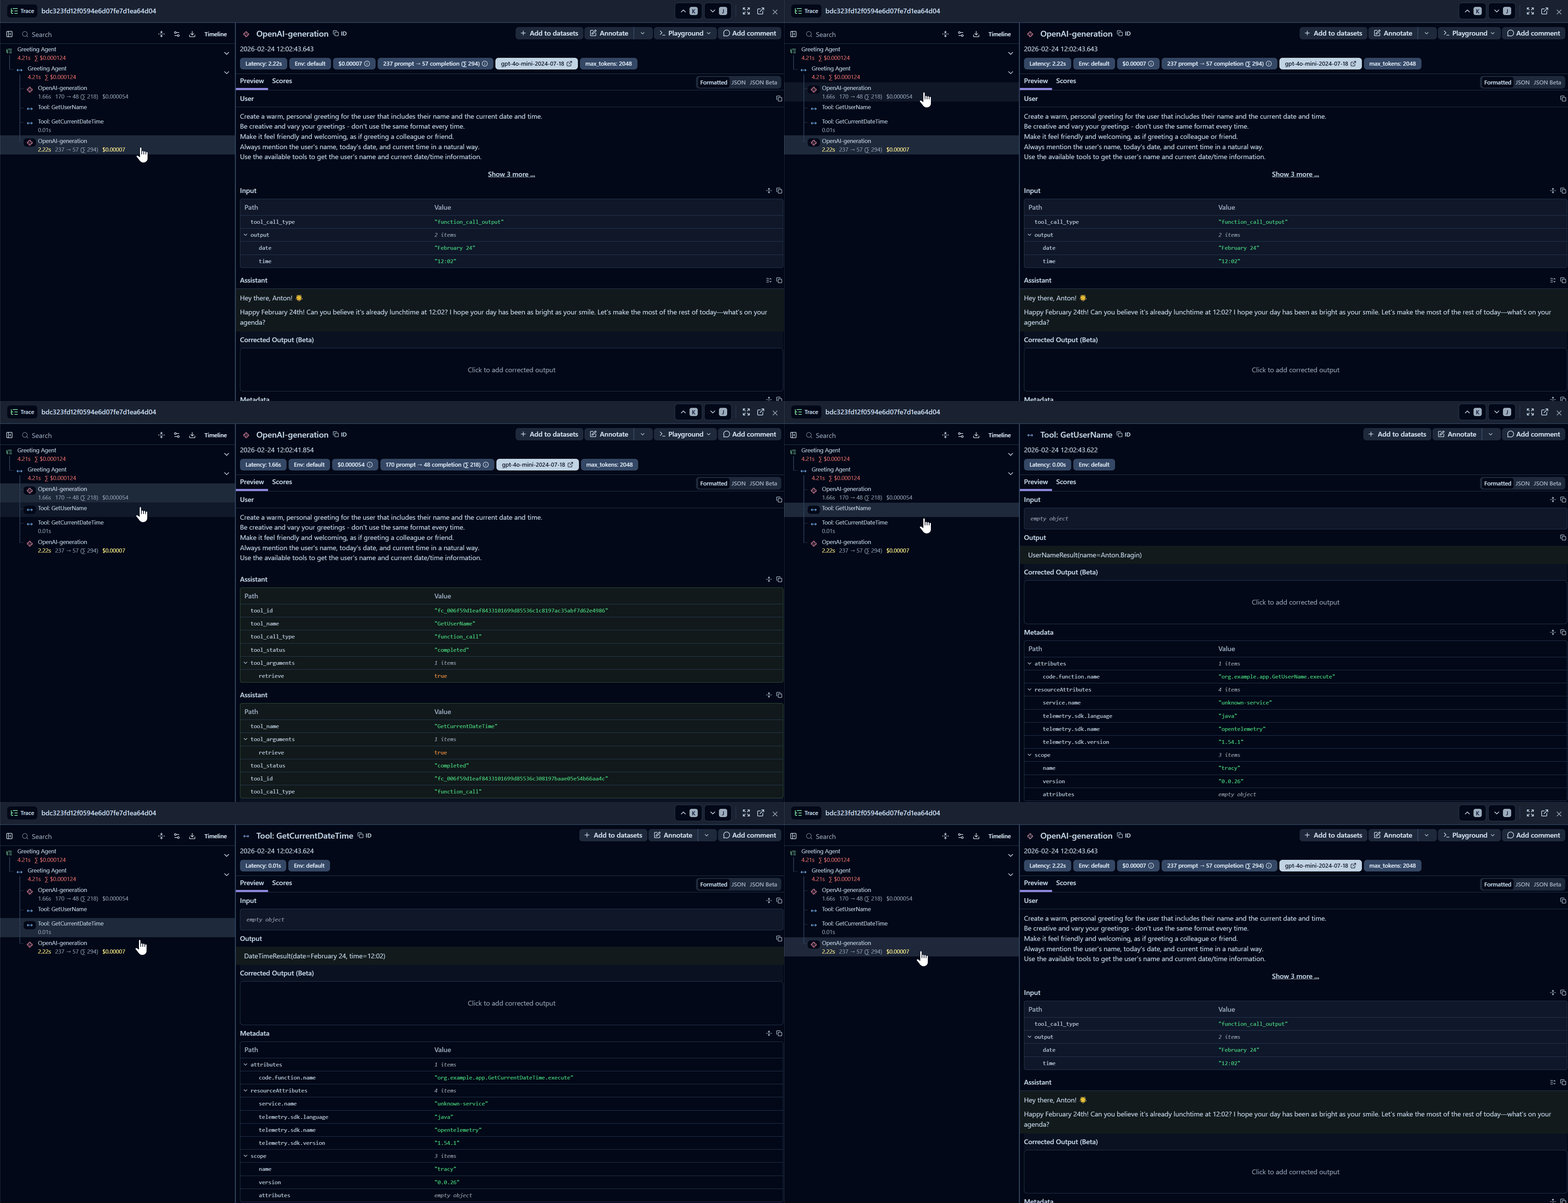
Configuring telemetry export to Langfuse takes seconds with Tracy. As a result, you get a hierarchical application trace with both LLM and tool calls captured.
What’s next
We truly believe that regardless of the pace of LLM progress in the coming years, observability will remain a cornerstone of effective and reliable AI engineering. No matter how good the underlying LLMs become, the applications using them must still be debugged and evaluated – both during development and in the field. We created Tracy in response to this demand, aiming to bring production-grade AI observability to the Kotlin ecosystem.
And we are just getting started! You can contribute to the growth of the Kotlin AI ecosystem by filing issues, submitting pull requests, or simply by trying Tracy in your projects and sharing your feedback. Let’s trace together!