


It's 3 AM. Your phone starts buzzing with alerts, and you stumble to your laptop only to be greeted by a dashboard that looks like the control panel of a nuclear reactor in meltdown: Red lights everywhere. Numbers that should be green are decidedly not green. And your brain, still foggy from sleep, is asking the most fundamental question in all of IT operations: "Okay, yes, there's clearly a problem... but, now what?"
Anyone who's ever been responsible for keeping digital services running has asked that question at one time or another. Whatever time of day it happens, the effect is the same: your system is down and you need answers fast. But here's the uncomfortable truth we don't often admit out loud: even the best monitoring tools, for all their sophistication and insight-generating prowess, can be frustratingly unintuitive and overwhelming in the heat of an incident.
Look, we've built an incredibly powerful Internet Performance Monitoring (IPM) platform. We can tell you with surgical precision exactly what's happening across your entire Internet stack, from synthetic transactions to real user monitoring, from BGP routing to DNS resolution times. We can show you dependency maps of every DNS, CDN, and API connection in your service delivery chain.
But here's what we've realized from listening to our customers: knowing what is broken and knowing what to do about it are two entirely different things.
It's like having the world's most detailed medical diagnostic equipment that can tell you exactly which cells in your body are misbehaving, but then leaving you to figure out whether you need aspirin or emergency surgery. The data is there. The insights are there. But the bridge between "here's what's wrong" and "here's how you fix it" more often than not, has been built by tribal knowledge, experience, and a lot of frantic Slack messages to whoever's been around long enough to remember the last time this particular flavor of chaos occurred.
This gap is exactly what we set out to close with our latest platform enhancements: AI-powered Root Cause Analysis (RCA) and Advisor.
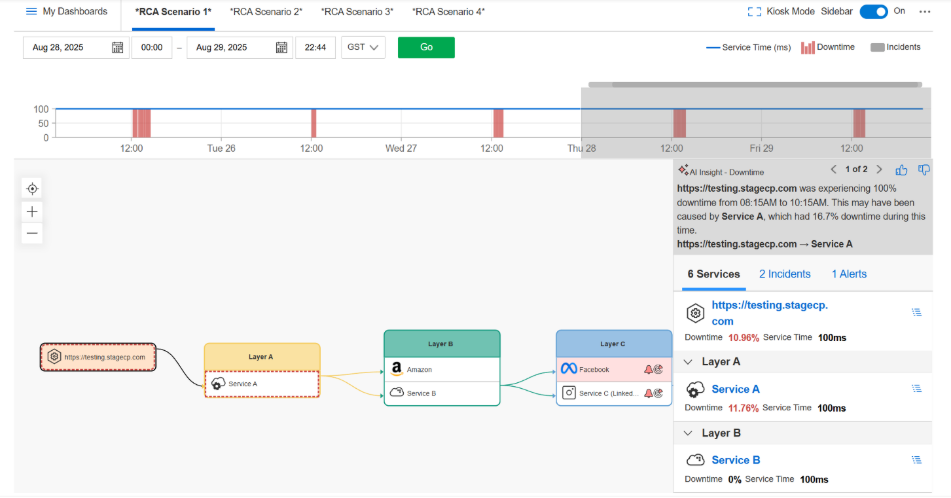
Our new RCA capability quickly identifies outages and pinpoints the primary service responsible for an issue. Think of it as your middle-of-the-night detective. When everything's on fire and your brain is running on caffeine and adrenaline, RCA cuts through the noise to tell you, in plain English, what's actually causing the problem. No more manually inspecting every dependency in your service chain. No more playing "guess the culprit" while your users are getting error pages.
It leverages Internet Stack Map — the family tree of all your digital dependencies — and combines that with event intelligence to automatically analyze backend waterfall data. The result? When something breaks, you don't just know that it's broken, you know what's breaking it.
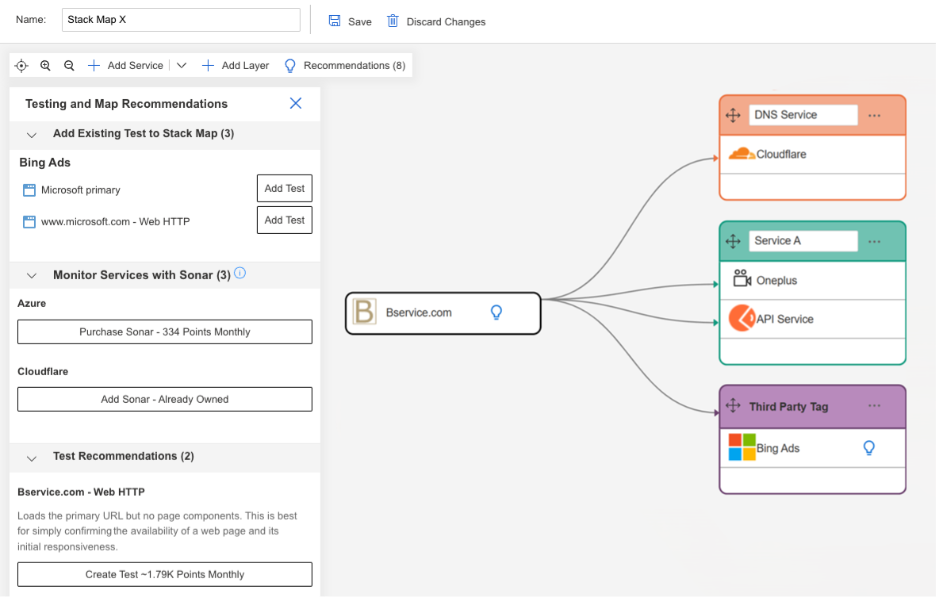
Catchpoint Advisor is like having that one senior engineer who's been around forever and somehow always knows exactly where the skeletons are buried, which wire to jiggle, and how to keep the show rolling. In this context, it looks at your monitoring setup and makes intelligent recommendations about coverage gaps, suggests additional tests, and even pre-configures them for you.
Both Root Cause Analysis and Advisor work contextually within your existing Stack Map. The AI isn't making wild guesses based on generic patterns - it's analyzing the specific services in your environment, during your timeline, using your actual data.
When RCA kicks in, it's examining waterfall data to determine whether a service outage is actually impacting your primary service. It only surfaces root causes that are relevant to what you're looking at, when you're looking at it. That means less noise and fewer false positives.
The Advisor recommendations are equally precise. They suggest adding existing – or new - tests you might have overlooked, recommend Internet Sonar services for dependencies you're not yet monitoring, and can even pre-configure new tests with alerts already set up. We're talking about HTTP, Chrome browser tests, SSL checks, traceroutes, DNS monitoring, and more.
And here's the kicker: these aren't buried in some separate AI dashboard you'll never remember to check. They appear automatically in your Stack Map interface when you have relevant data. No special enablement requests, no additional costs beyond what you're already using Stack Map for.
This is where I need to be crystal clear about something: we're not jumping on the AI bandwagon because it's trendy. As our CEO Mehdi Daoudi put it, "AI should remove complexity, not add to it." And our Chief Product Officer Matt Izzo was even more direct: "There is a lot of AI-washing in the industry, we do not want to add AI capabilities just to check the box."
Our new enhancements exist because our customers were telling us that they needed help making sense of what their monitoring data was actually telling them. They also aren’t our first rodeo with practical AI. In November 2023, we announced a raft of AI capabilities that solve real problems, including:
In July 2025, we took another major step forward with two new solutions designed for the age of AI-driven workflows:
RCA and Advisor are the next logical enhancements to our IPM platform, guiding you after detection by pinpointing the cause and recommending what to do about it.
Look, every monitoring vendor is talking about AI these days. Most of them are adding chatbots that can summarize your dashboards or generate reports that look impressive in PowerPoint presentations. That's not what we're doing here.
What we're doing is solving the fundamental problem that keeps SREs, DevOps engineers, and IT ops teams awake at night: the gap between detection and resolution. The space between "I see the problem" and "I know what to do about it." The difference between mean time to detect and mean time to repair.
The AI capabilities we've built so far represent the foundation of something bigger – a monitoring platform that doesn't just tell you what's happening, but helps you understand what it means and guides you toward resolution, especially when you're tired, stressed, and needing answers fast.
The 3 AM call will always be part of running Internet-scale services. What’s changing is our ability to answer the question that comes right after: “What’s wrong, and what do we do about it?”
At Catchpoint, our answer increasingly is: "Here's exactly what's wrong, and here's exactly what you should do about it."
And honestly? That feels like progress.
Explore our interactive tours and see how Catchpoint can help you bridge the gap between detection and resolution.
Monitoring tools often overwhelm teams with data but fail to bridge the gap between detection and resolution. Catchpoint’s new AI-powered Root Cause Analysis (RCA) and Advisor close that gap by pinpointing the exact cause of outages and recommending next steps. Unlike generic AI add-ons, these features analyze real service dependencies within your Internet Stack Map, cut noise, reduce false positives, and surface actionable insights right where teams work. This continues Catchpoint’s push to make monitoring not just powerful, but practical—helping IT teams go from “What’s wrong?” to “Here’s how to fix it” faster, even at 3 AM.
It's 3 AM. Your phone starts buzzing with alerts, and you stumble to your laptop only to be greeted by a dashboard that looks like the control panel of a nuclear reactor in meltdown: Red lights everywhere. Numbers that should be green are decidedly not green. And your brain, still foggy from sleep, is asking the most fundamental question in all of IT operations: "Okay, yes, there's clearly a problem... but, now what?"
Anyone who's ever been responsible for keeping digital services running has asked that question at one time or another. Whatever time of day it happens, the effect is the same: your system is down and you need answers fast. But here's the uncomfortable truth we don't often admit out loud: even the best monitoring tools, for all their sophistication and insight-generating prowess, can be frustratingly unintuitive and overwhelming in the heat of an incident.
Look, we've built an incredibly powerful Internet Performance Monitoring (IPM) platform. We can tell you with surgical precision exactly what's happening across your entire Internet stack, from synthetic transactions to real user monitoring, from BGP routing to DNS resolution times. We can show you dependency maps of every DNS, CDN, and API connection in your service delivery chain.
But here's what we've realized from listening to our customers: knowing what is broken and knowing what to do about it are two entirely different things.
It's like having the world's most detailed medical diagnostic equipment that can tell you exactly which cells in your body are misbehaving, but then leaving you to figure out whether you need aspirin or emergency surgery. The data is there. The insights are there. But the bridge between "here's what's wrong" and "here's how you fix it" more often than not, has been built by tribal knowledge, experience, and a lot of frantic Slack messages to whoever's been around long enough to remember the last time this particular flavor of chaos occurred.
This gap is exactly what we set out to close with our latest platform enhancements: AI-powered Root Cause Analysis (RCA) and Advisor.
Our new RCA capability quickly identifies outages and pinpoints the primary service responsible for an issue. Think of it as your middle-of-the-night detective. When everything's on fire and your brain is running on caffeine and adrenaline, RCA cuts through the noise to tell you, in plain English, what's actually causing the problem. No more manually inspecting every dependency in your service chain. No more playing "guess the culprit" while your users are getting error pages.
It leverages Internet Stack Map — the family tree of all your digital dependencies — and combines that with event intelligence to automatically analyze backend waterfall data. The result? When something breaks, you don't just know that it's broken, you know what's breaking it.
Catchpoint Advisor is like having that one senior engineer who's been around forever and somehow always knows exactly where the skeletons are buried, which wire to jiggle, and how to keep the show rolling. In this context, it looks at your monitoring setup and makes intelligent recommendations about coverage gaps, suggests additional tests, and even pre-configures them for you.
Both Root Cause Analysis and Advisor work contextually within your existing Stack Map. The AI isn't making wild guesses based on generic patterns - it's analyzing the specific services in your environment, during your timeline, using your actual data.
When RCA kicks in, it's examining waterfall data to determine whether a service outage is actually impacting your primary service. It only surfaces root causes that are relevant to what you're looking at, when you're looking at it. That means less noise and fewer false positives.
The Advisor recommendations are equally precise. They suggest adding existing – or new - tests you might have overlooked, recommend Internet Sonar services for dependencies you're not yet monitoring, and can even pre-configure new tests with alerts already set up. We're talking about HTTP, Chrome browser tests, SSL checks, traceroutes, DNS monitoring, and more.
And here's the kicker: these aren't buried in some separate AI dashboard you'll never remember to check. They appear automatically in your Stack Map interface when you have relevant data. No special enablement requests, no additional costs beyond what you're already using Stack Map for.
This is where I need to be crystal clear about something: we're not jumping on the AI bandwagon because it's trendy. As our CEO Mehdi Daoudi put it, "AI should remove complexity, not add to it." And our Chief Product Officer Matt Izzo was even more direct: "There is a lot of AI-washing in the industry, we do not want to add AI capabilities just to check the box."
Our new enhancements exist because our customers were telling us that they needed help making sense of what their monitoring data was actually telling them. They also aren’t our first rodeo with practical AI. In November 2023, we announced a raft of AI capabilities that solve real problems, including:
In July 2025, we took another major step forward with two new solutions designed for the age of AI-driven workflows:
RCA and Advisor are the next logical enhancements to our IPM platform, guiding you after detection by pinpointing the cause and recommending what to do about it.
Look, every monitoring vendor is talking about AI these days. Most of them are adding chatbots that can summarize your dashboards or generate reports that look impressive in PowerPoint presentations. That's not what we're doing here.
What we're doing is solving the fundamental problem that keeps SREs, DevOps engineers, and IT ops teams awake at night: the gap between detection and resolution. The space between "I see the problem" and "I know what to do about it." The difference between mean time to detect and mean time to repair.
The AI capabilities we've built so far represent the foundation of something bigger – a monitoring platform that doesn't just tell you what's happening, but helps you understand what it means and guides you toward resolution, especially when you're tired, stressed, and needing answers fast.
The 3 AM call will always be part of running Internet-scale services. What’s changing is our ability to answer the question that comes right after: “What’s wrong, and what do we do about it?”
At Catchpoint, our answer increasingly is: "Here's exactly what's wrong, and here's exactly what you should do about it."
And honestly? That feels like progress.
Explore our interactive tours and see how Catchpoint can help you bridge the gap between detection and resolution.
此内容由惯性聚合(RSS阅读器)自动聚合整理,仅供阅读参考。 原文来自 — 版权归原作者所有。