
惯性聚合 高效追踪和阅读你感兴趣的博客、新闻、科技资讯
阅读原文 在惯性聚合中打开

推荐订阅源

V
Visual Studio Blog
阮一峰的网络日志
阮一峰的网络日志
博客园_首页
奇客Solidot–传递最新科技情报
奇客Solidot–传递最新科技情报
Last Week in AI
Last Week in AI
罗磊的独立博客
freeCodeCamp Programming Tutorials: Python, JavaScript, Git & More
博客园 - 【当耐特】
T
Tailwind CSS Blog
美团技术团队
Y
Y Combinator Blog
I
InfoQ
C
Check Point Blog
Microsoft Security Blog
G
Google Developers Blog
Google DeepMind News
博客园 - Franky
Cyber Security Advisories - MS-ISAC
G
GRAHAM CLULEY
爱范儿
爱范儿
CTFtime.org: upcoming CTF events
Google DeepMind News
F
Fortinet All Blogs
A
Arctic Wolf
Hugging Face - Blog
Hugging Face - Blog
S
Security Affairs
cs.CV updates on arXiv.org
钛媒体:引领未来商业与生活新知
钛媒体:引领未来商业与生活新知
小众软件
小众软件
云风的 BLOG
云风的 BLOG
酷 壳 – CoolShell
酷 壳 – CoolShell
Recent Announcements
H
Heimdal Security Blog
博客园 - 司徒正美
Latest news
Latest news
H
Hacker News: Front Page
H
Help Net Security
Know Your Adversary
Know Your Adversary
让小产品的独立变现更简单 - ezindie.com
S
Secure Thoughts
AWS News Blog
AWS News Blog
V
Vulnerabilities – Threatpost
NISL@THU
NISL@THU
C
Cyber Attacks, Cyber Crime and Cyber Security
L
LangChain Blog
The GitHub Blog
The GitHub Blog
有赞技术团队
有赞技术团队
The Cloudflare Blog
I
Intezer
N
News and Events Feed by Topic

Catchpoint Blog

SRE Report: AI optimism and the economics of effort SRE Report: Why fast is what users trust SRE Report 2026: What surprised us, what didn't, and why the gaps matter most The SRE Report 2026: Defensible Ns Why Synthetic Tracing Delivers Better Data, Not Just More Data A New Chapter: LogicMonitor + Catchpoint – A Personal Note from Mehdi Mezmo + Catchpoint deliver observability SREs can rely on The four pillars holding up your digital business, and what happens when they crumble When payments pause: lessons from a global payments outage Observability 2025 Decoded: What the DZone Report Means for SLO-Driven Ops The next evolution of WebPageTest has arrived, and it’s a game-changer The Monitoring Blind Spot That Could Cost You Black Friday Powering Mexico’s Digital Future: Expanded Internet Observability with Catchpoint The Next Chapter of WebPageTest: Your New Experience Starts Soon SRE Report Retrospectives — Have AIOps Predictions Held Up? When BGP becomes UX: The inside story of a SaaS routing decision gone wrong (or right) Session Replay explained: A guide to seeing digital experience through your user’s eyes Making the invisible visible: Are your cloud firewalls and DDoS protection really working? Why it’s time to move beyond APM: Monitoring from the user’s perspective When metrics mislead: Inside the 2025 Retail Web Performance Benchmark The vendor trap: why your next outage won’t be your fault—but will be your problem LLMs don’t stand still: How to monitor and trust the models powering your AI Semantic Caching: What We Measured, Why It Matters The Annual SRE Survey Is Open—We Want to Hear from You Observability isn’t about the tool. It’s about the truth Invisible dependencies, visible impact: Lessons from the Google Cloud outage Real-time detection of BGP blackholing and prefix hijacks Leading analyst firm reveals the real cost of internet disruptions The Power of Over 3000 Intelligent Observability Agents Monitoring in the Age of Complexity: 5 Assumptions CIOs Need to Rethink Why Intelligent Traffic Steering is Critical for Performance and Cost Optimization Retail digital performance event recap: Key insights from IBM & Catchpoint Zendesk outage: A case for proactive monitoring and faster incident response Silence during chaos: Why the X outage is a call to arms for proactive monitoring The $1 Million Lesson: Building a Culture of Quality Through SLAs When AI tools fail: How to map your AI dependencies for proactive visibility Why Super Bowl 2025 was a triumph for Internet Resilience Why Internet Performance Monitoring is the new health check for IT organizations Why use Playwright in Catchpoint for synthetic monitoring Introducing WebPageTest Expert Plan: Real-Time Insights, Synthetic + RUM together in One Platform The shift to digital: How businesses are reshaping their priorities for 2025 The SRE Report 2025's Call to Action Monitoring in the Age of the Internet: DEM, IPM, and APM—What You Need to Know SSL Monitoring, Trust, and McLOVIN Performing for the holidays: Look beyond uptime for season sales success Lessons from Microsoft’s office 365 Outage: The Importance of third-party monitoring Web Performance Experts Look into the Future of Web Performance The hidden challenges of Internet Resilience: Key insights from 2024 report When SSL Issues aren’t just about SSL: A deep dive into the TIBCO Mashery outage The curious case of Marriott and the untold impact of web performance on revenue Preparing for the unexpected: Lessons from the AJIO and Jio Outage It’s time to stop neglecting the elephant in the room: Performance Matters! The Need for Speed: Highlights from IBM and Catchpoint’s Global DNS Performance Study Learnings from ServiceNow’s Proactive Response to a Network Breakdown Webinar Recap: Taking Web Performance to the Next Level Use the Catchpoint Terraform Provider in your CI/CD workflows Is the Internet ready for L4S? Takeaways from the CrowdStrike outage: third-parties can pose risk July 19th global IT outage reminds us of digital complexity 5 Actions you can take to improve digital performance 2024: A banner year for Internet Resilience APM vs Observability: Both-and, not either-or AppAssure: Ensuring the resilience of your Tier-1 applications just became easier APM vs observability: why your definitions are broken APM vs Observability: What comes next? APM vs Observability: Observing beyond APM Achieving stability with agility in your CI/CD pipeline AWS Outage: How do you prepare for the failure of your own safety net? Agentic AI: Powerful But Fragile—What You Need to Know Catch frustration before it costs you: New tools for a better user experience Catchpoint Expands Observability Network to Barcelona: A Growing Internet Hub Catchpoint Peak Performance Summit 2025: Redefining Observability for the Outcome Economy Catchpoint named a leader in the 2024 Gartner® Magic Quadrant™ for Digital Experience Monitoring Consolidation and Modernization in Enterprise Observability Connected Devices: Unlocking the next frontier of Internet Performance Monitoring Cloud Monitoring's Blind Spot: The User Perspective Cloudflare’s Resolver Outage: More Than Just DNS Cloudflare outage: another wake-up call for resilience planning Demystifying API Monitoring and Testing with IPM Creating the IPM Category: Catchpoint’s Journey to Leadership and the LogicMonitor Era Critical Requirements for Modern API Monitoring Customer Survey 2024: Unveiling insights and impact Did Delta's slow web performance signal trouble before CrowdStrike? Diagnosing Wi-Fi failures that traditional tools miss: a case study DNS misconfiguration can happen to anyone - the question is how fast can you detect it? ECN explained: Navigate congestion for faster, smoother data delivery Don’t get caught in the dark: Lessons from a Lumen & AWS micro-outage Escalating risk, shrinking margins: The 2025 Internet Resilience Report From refresh to results: the metrics that shaped Election Day 2024 coverage Fast and furious: The importance of performance in the digital age Getting Started with Traceroute From the source to the edge: the six agent types you can’t ignore From SEO to AEO: Why Web Performance Is the Key to AI Search Success Going for gold: Testing the resilience of Olympic websites Here’s the proof: What the fastest sites on the web have in common Google’s Agent-to-Agent (A2A) Protocol is here—Now Let’s Make it Observable How IPM helped a top tech brand catch an OpenAI outage before it became a crisis How AI Turns Monitoring From “What Now?” Into “What’s Next?” How SAP achieved world-class uptime through modern observability
How to Monitor AI Agents in Commerce Systems
2026-05-31 · via Catchpoint Blog

in this blog post

Artificial intelligence (AI) isn’t just writing text or generating images anymore. It’s starting to make real-world decisions. Now, with agentic systems, we’re entering an era where AI models don’t just respond; they act autonomously, buying, booking, and negotiating on behalf of users.

That may sound promising, but those of us in the trenches of reliability know that progress always comes with trade-offs. Make no mistake, this shift fundamentally changes how observability works.

The technology: how agentic commerce works

Google’s Agentic Payments Protocol (AP2) is one of the first open frameworks designed to enable AI agents to handle end-to-end commerce transactions from product discovery to checkout.

Instead of a human clicking through a shopping cart, an AI agent (powered by Gemini) can:

  • Interpret a natural-language intent: “Help me buy a coffee maker from Amazon”
  • Search merchant catalogues through APIs
  • Fetch user credentials from a secure wallet service
  • Initiate and confirm payment, all through machine-to-machine communication

Behind this, a network of microservices, including merchant, payment, and credential agents, coordinates the transaction

Each agent communicates over JSON-RPC(Remote Procedure Call), using the AP2 spec to ensure trust and interoperability between systems. Essentially, all agents in AP2 act like modular teammates that “speak the same language” (JSON-RPC) and follow a shared playbook (the AP2 spec).

This lets a shopping assistant, merchant, and payment provider coordinate securely, even if they’re built by different companies or run in different environments. By enabling coordination across organizations, AP2 shows how AI can now not only guide but also perform commercial transactions.

The problem: visibility collapses when logic moves to AI

That new autonomy comes with a price: blind spots. Traditional synthetic tests assume deterministic logic. You click, the app calls an API, and you measure latency and response codes.

But in an agentic architecture:

  • The logic is non-deterministic (driven by model reasoning)
  • The execution chain spans multiple networks, LLM APIs, merchant systems, CDNs, and payment processors
  • Failures are contextual, not just code-based (e.g., “Gemini throttled this request” might look like a 200 OK)

In other words, once AI starts making the decisions, traditional visibility breaks down — you lose the map. How do you monitor a system that decides, learns, and acts dynamically across infrastructure you don’t fully control?

Our setup: recreating the agentic stack

To answer that question, we built a functioning AP2 environment using Google’s open-source agentic-commerce/AP2 repository.

Here’s what we stood up locally:

  • Frontend: The AP2 Dev UI, hosted behind Cloudflare CDN (simulating public access)
  • Origin: A tunnelled environment representing an AWS backend (FastAPI services)
  • Backend Agents:
  • Merchant Agent – processes shopping queries
  • Credentials Provider – stores payment credentials
  • Payment Processor – handles mandate creation and transaction flow
  • AI Brain: Gemini 2.5 Flash, invoked via Google’s Generative Language API

In short, a complete AI-driven commerce stack, from intent to reasoning to payment initiation, running autonomously. At that point, we leveraged Catchpoint Internet Performance Monitoring (IPM) tools to measure performance, track latency, and identify failures across the system.  

A screenshot of a computerDescription automatically generated

Catchpoint’s Internet Stack Map  

Monitoring the agentic commerce stack

We modelled the system using Internet Stack Map to visualize and test every layer.

Layer What It Represents Monitoring Method
DNS (Cloudflare) DNS resolution and routing for the domain DNS Monitor
CDN (Cloudflare Edge) Edge delivery, caching, and TLS CDN/HTTP Monitor
Origin (AWS) FastAPI service entry point Web Object Monitor
Backend (AP2 Agents) Merchant, Payment, and Credentials microservices API Monitors
AI Layer (Gemini) Generative reasoning endpoint API Monitor with response validation
UI (AP2 Dev Interface) Frontend experience and intent submission Full Browser Test & Transaction Tests with response validation

To connect these layers, we used Catchpoint’s global variable extraction to capture the session ID generated in the UI synthetic test and reuse it across multiple backend API tests. Tests ran every 5 minutes from global agents.

The UI synthetic flow traces a user journey from the browser prompt (“Help me buy a coffee maker”) through the multi-agent orchestration, cart creation, payment mandate signing, and final payment receipt. Using Catchpoint synthetic E2E flow testing and Internet Stack Map, we get the following:

Transaction correctness: verifies that intent → cart → payment_mandate → signed_mandate → payment_result flows and that the transaction state is persisted across agents.
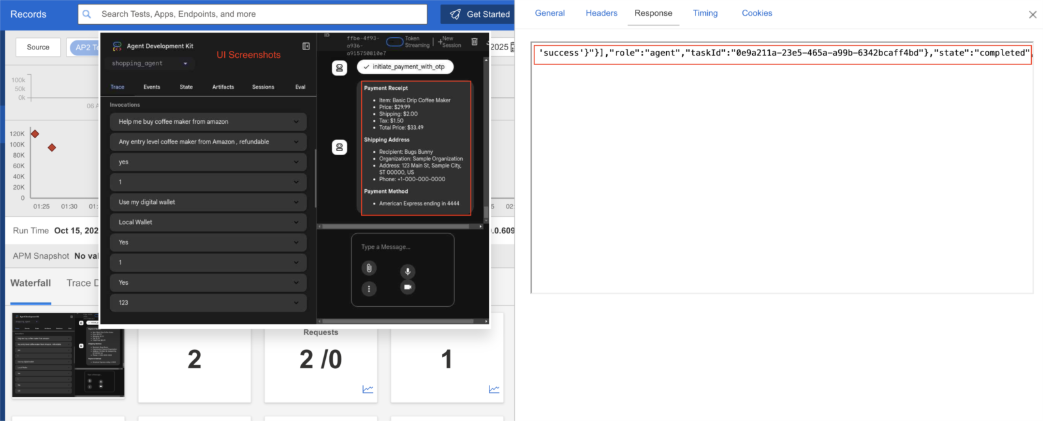
Dashboard showing successful synthetic test run on with header level detail showing successful transaction

Per-service performance: measures response time for each service / agent (create_intent_mandate, find_products, create_cart_mandate, get_payment_methods, create_payment_mandate, sign_mandates_on_user_device, initiate_payment). This converts “who’s slowing down the transaction” from guesswork to data.  

In the example below, we see find products alone took 13 seconds to fetch all product SKUs.
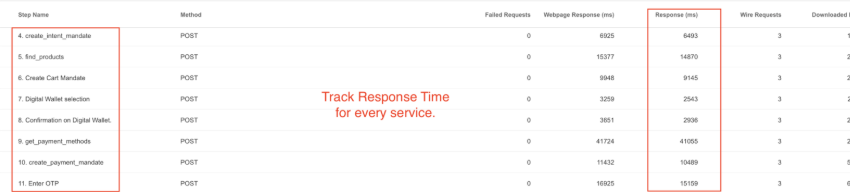
A screenshot of a phoneDescription automatically generated

Dashboard correlating Waterfall and Explorer views, illustrating response times and performance metrics for each agentic service and API call

Token consumption visibility: tracks model token usage (prompt, completion, total) per run so you can spot cost anomalies or prompt drift.

Screenshot showing various token usage metrics over time

Waterfall & Explorer insights: waterfall traces and explorer request/response bodies surface the exact failing/requesting call and payload, enabling fast RCA

Stack map correlation: connects failing runs to observed infrastructure components (CDN, edge, middleware, origin) to locate the root cause quickly.

Key blind spots we found

Catchpoint’s end-to-end AI commerce monitoring surfaced a few real-world failures that would otherwise appear as generic “assistant unresponsive” events.

1. Gemini errors

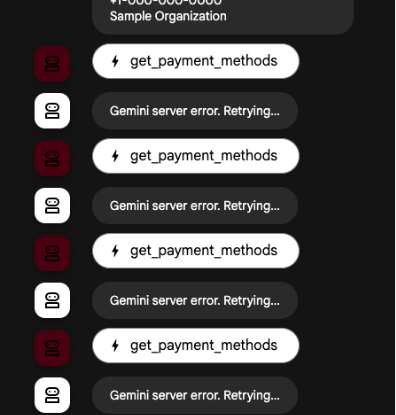
When we began testing, the system looked healthy and all endpoints returned 200 OK. But deeper inspection revealed Gemini 429 errors hidden within successful responses.

A screenshot of a chatDescription automatically generated

A failed synthetic test run, with Waterfall and request-level data pinpointing the source and details of the transaction error

2. UI stuck due to merchant service timeout

  • The front-end chat interface froze after create_intent_mandate
  • Catchpoint Explorer and Timing breakdown revealed a connection timeout (~10s) while waiting on the merchant agent service
  • The delay was isolated at the connect phase, confirming that the issue occurred before payload transfer—likely a temporary connectivity or backend overload condition
  • Stack Map correlation showed this hop passing through Cloudflare → Apigee → Merchant microservice, pinpointing the bottleneck to the merchant layer.

A failed synthetic test run, with Waterfall data revealing the connection timeout and the precise service layer responsible for the issue

3. UI Down – 530 error from Cloudflare

  • Synthetic UI tests later reported complete inaccessibility with an HTTP 530 (Origin Error) response
  • The error originated at the CDN edge (Cloudflare), meaning requests never reached the origin host
  • Catchpoint’s full waterfall and DNS tracing confirmed normal DNS resolution and SSL handshake, isolating the fault to Cloudflare’s route-to-origin link
  • Because the 530 surfaced at the UI layer, RUM or browser logs alone would have masked it as “page load failed”

A screenshot of a phone numberDescription automatically generated

A screenshot of a phoneDescription automatically generated

AI assistants are multi-layered systems where a “slow model” isn’t always the problem. By combining synthetic testing, end-to-end performance tracing, and cross-layer correlation, teams can pinpoint exactly which agent or network segment caused a stall—whether it’s a Gemini model delay, a merchant service timeout, or a CDN origin error.

Evolving observability for AI-driven systems

As AI systems begin to transact independently, observability must extend beyond servers and APIs into the logic that drives decisions. With IPM, organizations can now monitor AI commerce environments across both the infrastructure and reasoning layers, ensuring reliability in this new class of intelligent systems and provide teams with visibility into:

  • What the AI decided
  • What it executed
  • And where it broke

Agentic systems like AP2 are early prototypes of a broader shift, where applications become autonomous agents orchestrating workflows in real time. When that happens, performance data will no longer be just about page loads or API speeds. It will be about intent execution, the AI’s ability to fulfil a task successfully across systems. At Catchpoint, that’s the challenge we’re already preparing for: extending observability from systems to intelligent decision flows.

See it in action: good vs bad agentic outcomes

Below are real interactions highlighting both a smooth and an error-prone client experience in agentic commerce.

Learn more about AI monitoring

Summary

When AI agents buy, book, and negotiate autonomously, observability must evolve. Using Google’s AP2 framework and Gemini model, we built a full agentic commerce stack and instrumented it end to end. The findings reveal where visibility breaks across LLM reasoning, microservices, and networks, and how synthetic testing and Stack Map restore traceability and root-cause insight.

Artificial intelligence (AI) isn’t just writing text or generating images anymore. It’s starting to make real-world decisions. Now, with agentic systems, we’re entering an era where AI models don’t just respond; they act autonomously, buying, booking, and negotiating on behalf of users.

That may sound promising, but those of us in the trenches of reliability know that progress always comes with trade-offs. Make no mistake, this shift fundamentally changes how observability works.

The technology: how agentic commerce works

Google’s Agentic Payments Protocol (AP2) is one of the first open frameworks designed to enable AI agents to handle end-to-end commerce transactions from product discovery to checkout.

Instead of a human clicking through a shopping cart, an AI agent (powered by Gemini) can:

  • Interpret a natural-language intent: “Help me buy a coffee maker from Amazon”
  • Search merchant catalogues through APIs
  • Fetch user credentials from a secure wallet service
  • Initiate and confirm payment, all through machine-to-machine communication

Behind this, a network of microservices, including merchant, payment, and credential agents, coordinates the transaction

Each agent communicates over JSON-RPC(Remote Procedure Call), using the AP2 spec to ensure trust and interoperability between systems. Essentially, all agents in AP2 act like modular teammates that “speak the same language” (JSON-RPC) and follow a shared playbook (the AP2 spec).

This lets a shopping assistant, merchant, and payment provider coordinate securely, even if they’re built by different companies or run in different environments. By enabling coordination across organizations, AP2 shows how AI can now not only guide but also perform commercial transactions.

The problem: visibility collapses when logic moves to AI

That new autonomy comes with a price: blind spots. Traditional synthetic tests assume deterministic logic. You click, the app calls an API, and you measure latency and response codes.

But in an agentic architecture:

  • The logic is non-deterministic (driven by model reasoning)
  • The execution chain spans multiple networks, LLM APIs, merchant systems, CDNs, and payment processors
  • Failures are contextual, not just code-based (e.g., “Gemini throttled this request” might look like a 200 OK)

In other words, once AI starts making the decisions, traditional visibility breaks down — you lose the map. How do you monitor a system that decides, learns, and acts dynamically across infrastructure you don’t fully control?

Our setup: recreating the agentic stack

To answer that question, we built a functioning AP2 environment using Google’s open-source agentic-commerce/AP2 repository.

Here’s what we stood up locally:

  • Frontend: The AP2 Dev UI, hosted behind Cloudflare CDN (simulating public access)
  • Origin: A tunnelled environment representing an AWS backend (FastAPI services)
  • Backend Agents:
  • Merchant Agent – processes shopping queries
  • Credentials Provider – stores payment credentials
  • Payment Processor – handles mandate creation and transaction flow
  • AI Brain: Gemini 2.5 Flash, invoked via Google’s Generative Language API

In short, a complete AI-driven commerce stack, from intent to reasoning to payment initiation, running autonomously. At that point, we leveraged Catchpoint Internet Performance Monitoring (IPM) tools to measure performance, track latency, and identify failures across the system.  

A screenshot of a computerDescription automatically generated

Catchpoint’s Internet Stack Map  

Monitoring the agentic commerce stack

We modelled the system using Internet Stack Map to visualize and test every layer.

Layer What It Represents Monitoring Method
DNS (Cloudflare) DNS resolution and routing for the domain DNS Monitor
CDN (Cloudflare Edge) Edge delivery, caching, and TLS CDN/HTTP Monitor
Origin (AWS) FastAPI service entry point Web Object Monitor
Backend (AP2 Agents) Merchant, Payment, and Credentials microservices API Monitors
AI Layer (Gemini) Generative reasoning endpoint API Monitor with response validation
UI (AP2 Dev Interface) Frontend experience and intent submission Full Browser Test & Transaction Tests with response validation

To connect these layers, we used Catchpoint’s global variable extraction to capture the session ID generated in the UI synthetic test and reuse it across multiple backend API tests. Tests ran every 5 minutes from global agents.

The UI synthetic flow traces a user journey from the browser prompt (“Help me buy a coffee maker”) through the multi-agent orchestration, cart creation, payment mandate signing, and final payment receipt. Using Catchpoint synthetic E2E flow testing and Internet Stack Map, we get the following:

Transaction correctness: verifies that intent → cart → payment_mandate → signed_mandate → payment_result flows and that the transaction state is persisted across agents.

Dashboard showing successful synthetic test run on with header level detail showing successful transaction

Per-service performance: measures response time for each service / agent (create_intent_mandate, find_products, create_cart_mandate, get_payment_methods, create_payment_mandate, sign_mandates_on_user_device, initiate_payment). This converts “who’s slowing down the transaction” from guesswork to data.  

In the example below, we see find products alone took 13 seconds to fetch all product SKUs.
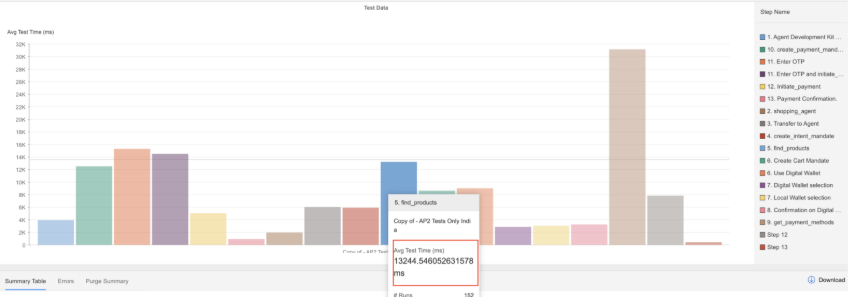
A screenshot of a phoneDescription automatically generated

Dashboard correlating Waterfall and Explorer views, illustrating response times and performance metrics for each agentic service and API call

Token consumption visibility: tracks model token usage (prompt, completion, total) per run so you can spot cost anomalies or prompt drift.
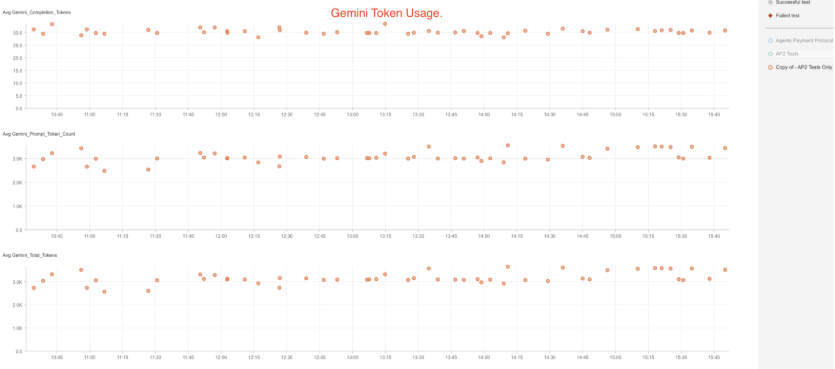

Screenshot showing various token usage metrics over time

Waterfall & Explorer insights: waterfall traces and explorer request/response bodies surface the exact failing/requesting call and payload, enabling fast RCA

Stack map correlation: connects failing runs to observed infrastructure components (CDN, edge, middleware, origin) to locate the root cause quickly.

Key blind spots we found

Catchpoint’s end-to-end AI commerce monitoring surfaced a few real-world failures that would otherwise appear as generic “assistant unresponsive” events.

1. Gemini errors

When we began testing, the system looked healthy and all endpoints returned 200 OK. But deeper inspection revealed Gemini 429 errors hidden within successful responses.

A screenshot of a chatDescription automatically generated

A failed synthetic test run, with Waterfall and request-level data pinpointing the source and details of the transaction error

2. UI stuck due to merchant service timeout
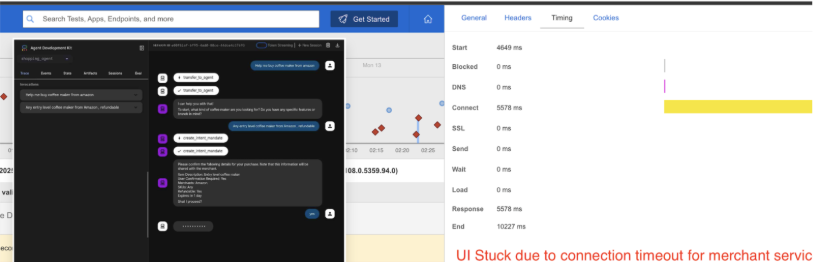
  • The front-end chat interface froze after create_intent_mandate
  • Catchpoint Explorer and Timing breakdown revealed a connection timeout (~10s) while waiting on the merchant agent service
  • The delay was isolated at the connect phase, confirming that the issue occurred before payload transfer—likely a temporary connectivity or backend overload condition
  • Stack Map correlation showed this hop passing through Cloudflare → Apigee → Merchant microservice, pinpointing the bottleneck to the merchant layer.

A failed synthetic test run, with Waterfall data revealing the connection timeout and the precise service layer responsible for the issue

3. UI Down – 530 error from Cloudflare

  • Synthetic UI tests later reported complete inaccessibility with an HTTP 530 (Origin Error) response
  • The error originated at the CDN edge (Cloudflare), meaning requests never reached the origin host
  • Catchpoint’s full waterfall and DNS tracing confirmed normal DNS resolution and SSL handshake, isolating the fault to Cloudflare’s route-to-origin link
  • Because the 530 surfaced at the UI layer, RUM or browser logs alone would have masked it as “page load failed”

A screenshot of a phone numberDescription automatically generated

A screenshot of a phoneDescription automatically generated

AI assistants are multi-layered systems where a “slow model” isn’t always the problem. By combining synthetic testing, end-to-end performance tracing, and cross-layer correlation, teams can pinpoint exactly which agent or network segment caused a stall—whether it’s a Gemini model delay, a merchant service timeout, or a CDN origin error.

Evolving observability for AI-driven systems

As AI systems begin to transact independently, observability must extend beyond servers and APIs into the logic that drives decisions. With IPM, organizations can now monitor AI commerce environments across both the infrastructure and reasoning layers, ensuring reliability in this new class of intelligent systems and provide teams with visibility into:

  • What the AI decided
  • What it executed
  • And where it broke

Agentic systems like AP2 are early prototypes of a broader shift, where applications become autonomous agents orchestrating workflows in real time. When that happens, performance data will no longer be just about page loads or API speeds. It will be about intent execution, the AI’s ability to fulfil a task successfully across systems. At Catchpoint, that’s the challenge we’re already preparing for: extending observability from systems to intelligent decision flows.

See it in action: good vs bad agentic outcomes

Below are real interactions highlighting both a smooth and an error-prone client experience in agentic commerce.

Learn more about AI monitoring

This is some text inside of a div block.

You might also like

SRE Report: Why fast is what users trust

SRE Report 2026: What surprised us, what didn't, and why the gaps matter most

The SRE Report 2026: Defensible Ns