
惯性聚合 高效追踪和阅读你感兴趣的博客、新闻、科技资讯
阅读原文 在惯性聚合中打开

推荐订阅源

GbyAI
GbyAI
V
Visual Studio Blog
美团技术团队
L
LINUX DO - 最新话题
Last Week in AI
Last Week in AI
雷峰网
雷峰网
博客园_首页
腾讯CDC
博客园 - Franky
大猫的无限游戏
大猫的无限游戏
cs.CV updates on arXiv.org
钛媒体:引领未来商业与生活新知
钛媒体:引领未来商业与生活新知
人人都是产品经理
人人都是产品经理
cs.AI updates on arXiv.org
J
Java Code Geeks
W
WeLiveSecurity
Apple Machine Learning Research
Spread Privacy
Spread Privacy
博客园 - 聂微东
量子位
Recent Announcements
S
Schneier on Security
O
OpenAI News
PCI Perspectives
PCI Perspectives
H
Heimdal Security Blog
T
Tailwind CSS Blog
S
Security Affairs
Y
Y Combinator Blog
P
Privacy International News Feed
Hacker News: Ask HN
Hacker News: Ask HN
Stack Overflow Blog
Stack Overflow Blog
Application and Cybersecurity Blog
U
Unit 42
Webroot Blog
Webroot Blog
Vercel News
Vercel News
Simon Willison's Weblog
B
Blog RSS Feed
S
Secure Thoughts
Microsoft Azure Blog
N
Netflix TechBlog - Medium
V
V2EX
Threat Intelligence Blog | Flashpoint
D
DataBreaches.Net
月光博客
月光博客
博客园 - 三生石上(FineUI控件)
L
LangChain Blog
S
Security @ Cisco Blogs
The Hacker News
The Hacker News
The GitHub Blog
The GitHub Blog
C
CERT Recently Published Vulnerability Notes

Catchpoint Blog

SRE Report: AI optimism and the economics of effort SRE Report: Why fast is what users trust SRE Report 2026: What surprised us, what didn't, and why the gaps matter most The SRE Report 2026: Defensible Ns Why Synthetic Tracing Delivers Better Data, Not Just More Data A New Chapter: LogicMonitor + Catchpoint – A Personal Note from Mehdi Mezmo + Catchpoint deliver observability SREs can rely on The four pillars holding up your digital business, and what happens when they crumble When payments pause: lessons from a global payments outage Observability 2025 Decoded: What the DZone Report Means for SLO-Driven Ops The next evolution of WebPageTest has arrived, and it’s a game-changer The Monitoring Blind Spot That Could Cost You Black Friday Powering Mexico’s Digital Future: Expanded Internet Observability with Catchpoint The Next Chapter of WebPageTest: Your New Experience Starts Soon SRE Report Retrospectives — Have AIOps Predictions Held Up? When BGP becomes UX: The inside story of a SaaS routing decision gone wrong (or right) Session Replay explained: A guide to seeing digital experience through your user’s eyes Making the invisible visible: Are your cloud firewalls and DDoS protection really working? Why it’s time to move beyond APM: Monitoring from the user’s perspective When metrics mislead: Inside the 2025 Retail Web Performance Benchmark The vendor trap: why your next outage won’t be your fault—but will be your problem LLMs don’t stand still: How to monitor and trust the models powering your AI Semantic Caching: What We Measured, Why It Matters The Annual SRE Survey Is Open—We Want to Hear from You Observability isn’t about the tool. It’s about the truth Invisible dependencies, visible impact: Lessons from the Google Cloud outage Real-time detection of BGP blackholing and prefix hijacks Leading analyst firm reveals the real cost of internet disruptions The Power of Over 3000 Intelligent Observability Agents Monitoring in the Age of Complexity: 5 Assumptions CIOs Need to Rethink Why Intelligent Traffic Steering is Critical for Performance and Cost Optimization Retail digital performance event recap: Key insights from IBM & Catchpoint Zendesk outage: A case for proactive monitoring and faster incident response Silence during chaos: Why the X outage is a call to arms for proactive monitoring The $1 Million Lesson: Building a Culture of Quality Through SLAs When AI tools fail: How to map your AI dependencies for proactive visibility Why Super Bowl 2025 was a triumph for Internet Resilience Why Internet Performance Monitoring is the new health check for IT organizations Why use Playwright in Catchpoint for synthetic monitoring Introducing WebPageTest Expert Plan: Real-Time Insights, Synthetic + RUM together in One Platform The shift to digital: How businesses are reshaping their priorities for 2025 The SRE Report 2025's Call to Action Monitoring in the Age of the Internet: DEM, IPM, and APM—What You Need to Know SSL Monitoring, Trust, and McLOVIN Performing for the holidays: Look beyond uptime for season sales success Lessons from Microsoft’s office 365 Outage: The Importance of third-party monitoring Web Performance Experts Look into the Future of Web Performance The hidden challenges of Internet Resilience: Key insights from 2024 report When SSL Issues aren’t just about SSL: A deep dive into the TIBCO Mashery outage The curious case of Marriott and the untold impact of web performance on revenue Preparing for the unexpected: Lessons from the AJIO and Jio Outage It’s time to stop neglecting the elephant in the room: Performance Matters! The Need for Speed: Highlights from IBM and Catchpoint’s Global DNS Performance Study Learnings from ServiceNow’s Proactive Response to a Network Breakdown Webinar Recap: Taking Web Performance to the Next Level Use the Catchpoint Terraform Provider in your CI/CD workflows Is the Internet ready for L4S? Takeaways from the CrowdStrike outage: third-parties can pose risk July 19th global IT outage reminds us of digital complexity 5 Actions you can take to improve digital performance 2024: A banner year for Internet Resilience APM vs Observability: Both-and, not either-or AppAssure: Ensuring the resilience of your Tier-1 applications just became easier APM vs observability: why your definitions are broken APM vs Observability: What comes next? APM vs Observability: Observing beyond APM Achieving stability with agility in your CI/CD pipeline AWS Outage: How do you prepare for the failure of your own safety net? Agentic AI: Powerful But Fragile—What You Need to Know Catch frustration before it costs you: New tools for a better user experience Catchpoint Expands Observability Network to Barcelona: A Growing Internet Hub Catchpoint Peak Performance Summit 2025: Redefining Observability for the Outcome Economy Catchpoint named a leader in the 2024 Gartner® Magic Quadrant™ for Digital Experience Monitoring Consolidation and Modernization in Enterprise Observability Connected Devices: Unlocking the next frontier of Internet Performance Monitoring Cloud Monitoring's Blind Spot: The User Perspective Cloudflare’s Resolver Outage: More Than Just DNS Cloudflare outage: another wake-up call for resilience planning Demystifying API Monitoring and Testing with IPM Creating the IPM Category: Catchpoint’s Journey to Leadership and the LogicMonitor Era Customer Survey 2024: Unveiling insights and impact Did Delta's slow web performance signal trouble before CrowdStrike? Diagnosing Wi-Fi failures that traditional tools miss: a case study DNS misconfiguration can happen to anyone - the question is how fast can you detect it? ECN explained: Navigate congestion for faster, smoother data delivery Don’t get caught in the dark: Lessons from a Lumen & AWS micro-outage Escalating risk, shrinking margins: The 2025 Internet Resilience Report From refresh to results: the metrics that shaped Election Day 2024 coverage Fast and furious: The importance of performance in the digital age Getting Started with Traceroute From the source to the edge: the six agent types you can’t ignore From SEO to AEO: Why Web Performance Is the Key to AI Search Success Going for gold: Testing the resilience of Olympic websites Here’s the proof: What the fastest sites on the web have in common Google’s Agent-to-Agent (A2A) Protocol is here—Now Let’s Make it Observable How IPM helped a top tech brand catch an OpenAI outage before it became a crisis How AI Turns Monitoring From “What Now?” Into “What’s Next?” How SAP achieved world-class uptime through modern observability How to Monitor AI Agents in Commerce Systems
Critical Requirements for Modern API Monitoring
2026-05-31 · via Catchpoint Blog

in this blog post

Enterprises lose millions annually due to API outages and performance degradation. Modern observability strategies are crucial to mitigate these risks.

Today, almost every system is dependent on APIs. Data integration, authentication, payment processing, and many other functions rely on multiple reliable and performant APIs. Banks around the world, for example, have adopted the Open Banking API for payments, credit scoring, lending origination, fraud detection, and lots more.

APIs are everywhere—and critical to everything

APIs are the internal workers of the internet.  Connecting to a single website, using a business application like an ATM, or a mobile app likely means dozens if not hundreds or even thousands of API calls.  Each one has the possibility to impact the overall service: if it’s slow, the service might be slow.  If it returns an error, the service may fail.  Understanding the interaction between your services and the APIs they consume is critical to making your services resilient.

There are different ways to monitor APIs.  The minimum that every system should use is proactively monitoring, measuring, and testing your critical APIs – both your own as well as third party APIs. API monitoring systems have been around for some time. From the basic ping to ensure an API is reachable to more advanced multi-step, scripted, proactive monitoring that looks at response time, functional validation, etc. More advanced API monitoring will incorporate Chaos Engineering methodologies, like blocking or simulating an error on particular APIs and observing the impact on the overall system.

API resilience isn’t optional—here’s why

In a world where most applications and systems that are interconnected via APIs are geographically distributed, touching different clouds and traversing multiple points across the internet, simple proactive monitoring is no longer enough.  A traditional approach to API monitoring will not only be insufficient, but it may also miss many important incidents and would not be helpful in identifying root cause.

The goal is to have resilient APIs. The formula for resilience is

  • Reachability: Can I get to the API from where I am? (Or in the case of APIs, where its consumers are).
  • Availability: Is the API functional – does it do what it is supposed to do?
  • Performance: Does the API respond within the expected time?
  • Reliability: Can I trust the API will be working consistently?

Then, take this formula and combine it for every API used in your system!

System Resilience = minimum resilience across all APIs in use
Picture 1, Picture

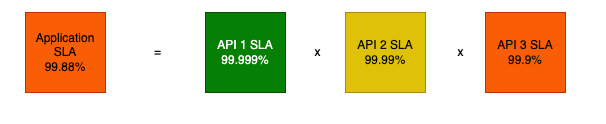
Let’s illustrate the point:

A system that has 100 APIs with five nines of availability must have five nines of availability from each API!  If designed in a resilient way, it’s possible to have individual API dependencies fail without impacting the overall system, but it has to be carefully designed and verified to be resilient.

Picture 1, Picture

Figure 1: One misbehaving dependency can make your whole system fail

With this goal in mind, let’s understand the requirements for API monitoring.  

What a basic API Monitoring strategy should include

These are the foundational capabilities every API monitoring strategy should include. They help teams detect issues, ensure availability, and validate performance at a basic operational level.

  • Response Time: Measures the time taken for an API to respond to a request, helping identify latency issues.
  • Error Rate: Tracks the percentage of failed requests to detect anomalies or bugs.
  • Throughput: Monitors the number of API requests processed over a specific period to ensure scalability.
  • Uptime and Availability: Ensures APIs are consistently reachable and operational.
  • Logging: Collect detailed logs of API events, including timestamps, event types (e.g., errors, warnings), and messages, to aid in troubleshooting and post-incident analysis.
  • Alerts: Set up alerts based on predefined thresholds or anomalies (e.g., response time exceeding 200ms or error rates surpassing 5%).
  • Functional testing: verify that API endpoints return expected results  
  • CI/CD integration: the ability to integrate monitoring into pipelines (and tools like Jenkins or Terraform) for automated creation and update of tests also known as “monitoring as code”.  
  • Proactive monitoring: Use of synthetic mechanisms to continuously observe API performance to detect issues as they occur.
  • Scripting: Support for scripting standards such as Playwright to enable testing specific customer & API flows.
  • Historic data: A minimum of 13-month data retention to enable comparison of performance with the same period a year ago
  • High-cardinality data analysis: Analyze detailed data points such as unique user IDs or session-specific information for granular insights into performance trends or anomalies.
  • Chaos Engineering: Introduce errors into the system on purpose during a period of low use, or in a non-production environment in order to verify resilience.

Modern, internet-centric API monitoring requirements

Today’s systems, however, demand more than basic uptime checks or response metrics. Modern API monitoring must account for real-world complexity—geography, infrastructure, user experience, and external dependencies. The capabilities below go beyond the basics to provide deep, actionable insight.

  • Monitor from where it matters – most monitoring tools have agents in cloud servers, which often have very different connectivity, resources, and bandwidth than real-world systems, and are blind to geographical differences in routing, ISP congestion, etc. It is critical to monitor from all the locations from where a system will consume an API, using an agent that has similar characteristics. It is also important to consider where your intermediate services are. For example, you may test your full application from the customer-facing API from last-mile agents. Then test intermediate microservices from the cloud provider where they're located, and test your back-end API from a backbone agent in the city & ISP where your datacenter is located or use an enterprise agent inside the datacenter.  
  • Visibility into the Internet Stack – While it is useful to know when an API is unresponsive or slow, it is more powerful to understand why. Modern API monitoring provides insight into anything in the Internet Stack that impacts an API including DNS resolution, SSL, routing, etc. – as well as visibility into the impact on latency and performance introduced by systems such as internal networks, SASE implementations, or gateways.

A blue and purple rectangular chart with iconsAI-generated content may be incorrect., Picture

The Internet Stack
  • Authentication – No modern monitoring system should have hard-coded credentials into a secure API, therefore monitoring systems must support secrets management, OAuth, tokens and modern authentication mechanisms.
  • Synthetic Code Tracing - As an API is being tested, collect and understand code execution traces to identify server-side issues including application, connectivity, and database problems.
  • Open Telemetry Support – modern observability implementations must support OTel as the standard mechanism to share and integrate data from multiple systems and to provide flexibility.
  • Focus on User experience – An API is only a component of a broader overall system performance. A payment API is likely a component of an online purchase transaction. You want to ensure the entire transaction system performs – from the end-user perspective. Ideally, an operations team would be able to see a visual representation of every dependency in the user transaction, from end-user across the internet, network, systems, APIs – all the way into code tracing.
  • Broad support for protocols – While many APIs use REST over HTTP, it may be important for your monitoring system to be able to test from both IPv4 and IPv6 agents, as well as support modern protocols like http/3 and QUIC,  MQTT for IoT applications, NTP for time synchronization, or even custom or proprietary protocols that your applications use.

Traditional vs modern API monitoring at a glance

The following table summarizes the key differences between legacy API monitoring approaches and modern, Internet Performance Monitoring strategies that support resilience and user experience.

Feature Traditional API Monitoring Modern API Monitoring (IPM)
Scope Server-centric metrics End-to-end user experience + infrastructure
Protocol Support Limited to HTTP/S, REST HTTP/3, QUIC, MQTT, custom protocols
Data Granularity High-cardinality data available but often limited to service boundaries High-cardinality traces with cross-system correlation (user IDs, sessions)
Root Cause Analysis Limited to app/server layers Full internet stack (DNS, SSL, routing, etc.)
Testing Perspective Cloud datacenters Last mile, backbone, cloud, wireless, and enterprise intelligent agents
Performance Context API performance in the context of code API performance in context of user experience
Alerting Methodology Alert thresholds based on error rates Experience scores and XLOs
Visualization Code-centric dashboards Visual representation of everything impacting a system

Rethink what API monitoring should do

It is somewhat surprising that the cloud is only 15 years old. As technology and system architecture has evolved, our monitoring has to evolve including API monitoring.  

What is today considered “owned” or “on-premises” infrastructure is most likely in a colocation datacenter, relying on a DNS and SSL provider, connected through at least two ISPs, depending on a cloud-based authentication system, connected through a cloud-based security provider and maybe a few other APIs.

We hear all the time “My APM system shows my systems are green, but my users keep complaining”. A monitoring system that only monitors your “on premises” API is not going to be able to spot, diagnose, or provide useful root-cause information to prevent or solve incidents quickly.

To ensure API resilience, enterprises must invest in modern monitoring solutions that provide end-to-end visibility, proactive alerting, and automated remediation capabilities.  

Ready to modernize your API monitoring?

Summary

Enterprises lose millions annually due to API outages and performance degradation. Modern observability strategies are crucial to mitigate these risks.

Today, almost every system is dependent on APIs. Data integration, authentication, payment processing, and many other functions rely on multiple reliable and performant APIs. Banks around the world, for example, have adopted the Open Banking API for payments, credit scoring, lending origination, fraud detection, and lots more.

APIs are everywhere—and critical to everything

APIs are the internal workers of the internet.  Connecting to a single website, using a business application like an ATM, or a mobile app likely means dozens if not hundreds or even thousands of API calls.  Each one has the possibility to impact the overall service: if it’s slow, the service might be slow.  If it returns an error, the service may fail.  Understanding the interaction between your services and the APIs they consume is critical to making your services resilient.

There are different ways to monitor APIs.  The minimum that every system should use is proactively monitoring, measuring, and testing your critical APIs – both your own as well as third party APIs. API monitoring systems have been around for some time. From the basic ping to ensure an API is reachable to more advanced multi-step, scripted, proactive monitoring that looks at response time, functional validation, etc. More advanced API monitoring will incorporate Chaos Engineering methodologies, like blocking or simulating an error on particular APIs and observing the impact on the overall system.

API resilience isn’t optional—here’s why

In a world where most applications and systems that are interconnected via APIs are geographically distributed, touching different clouds and traversing multiple points across the internet, simple proactive monitoring is no longer enough.  A traditional approach to API monitoring will not only be insufficient, but it may also miss many important incidents and would not be helpful in identifying root cause.

The goal is to have resilient APIs. The formula for resilience is

  • Reachability: Can I get to the API from where I am? (Or in the case of APIs, where its consumers are).
  • Availability: Is the API functional – does it do what it is supposed to do?
  • Performance: Does the API respond within the expected time?
  • Reliability: Can I trust the API will be working consistently?

Then, take this formula and combine it for every API used in your system!

System Resilience = minimum resilience across all APIs in use

Picture 1, Picture

Let’s illustrate the point:

A system that has 100 APIs with five nines of availability must have five nines of availability from each API!  If designed in a resilient way, it’s possible to have individual API dependencies fail without impacting the overall system, but it has to be carefully designed and verified to be resilient.

Picture 1, Picture

Figure 1: One misbehaving dependency can make your whole system fail

With this goal in mind, let’s understand the requirements for API monitoring.  

What a basic API Monitoring strategy should include

These are the foundational capabilities every API monitoring strategy should include. They help teams detect issues, ensure availability, and validate performance at a basic operational level.

  • Response Time: Measures the time taken for an API to respond to a request, helping identify latency issues.
  • Error Rate: Tracks the percentage of failed requests to detect anomalies or bugs.
  • Throughput: Monitors the number of API requests processed over a specific period to ensure scalability.
  • Uptime and Availability: Ensures APIs are consistently reachable and operational.
  • Logging: Collect detailed logs of API events, including timestamps, event types (e.g., errors, warnings), and messages, to aid in troubleshooting and post-incident analysis.
  • Alerts: Set up alerts based on predefined thresholds or anomalies (e.g., response time exceeding 200ms or error rates surpassing 5%).
  • Functional testing: verify that API endpoints return expected results  
  • CI/CD integration: the ability to integrate monitoring into pipelines (and tools like Jenkins or Terraform) for automated creation and update of tests also known as “monitoring as code”.  
  • Proactive monitoring: Use of synthetic mechanisms to continuously observe API performance to detect issues as they occur.
  • Scripting: Support for scripting standards such as Playwright to enable testing specific customer & API flows.
  • Historic data: A minimum of 13-month data retention to enable comparison of performance with the same period a year ago
  • High-cardinality data analysis: Analyze detailed data points such as unique user IDs or session-specific information for granular insights into performance trends or anomalies.
  • Chaos Engineering: Introduce errors into the system on purpose during a period of low use, or in a non-production environment in order to verify resilience.

Modern, internet-centric API monitoring requirements

Today’s systems, however, demand more than basic uptime checks or response metrics. Modern API monitoring must account for real-world complexity—geography, infrastructure, user experience, and external dependencies. The capabilities below go beyond the basics to provide deep, actionable insight.

  • Monitor from where it matters – most monitoring tools have agents in cloud servers, which often have very different connectivity, resources, and bandwidth than real-world systems, and are blind to geographical differences in routing, ISP congestion, etc. It is critical to monitor from all the locations from where a system will consume an API, using an agent that has similar characteristics. It is also important to consider where your intermediate services are. For example, you may test your full application from the customer-facing API from last-mile agents. Then test intermediate microservices from the cloud provider where they're located, and test your back-end API from a backbone agent in the city & ISP where your datacenter is located or use an enterprise agent inside the datacenter.  
  • Visibility into the Internet Stack – While it is useful to know when an API is unresponsive or slow, it is more powerful to understand why. Modern API monitoring provides insight into anything in the Internet Stack that impacts an API including DNS resolution, SSL, routing, etc. – as well as visibility into the impact on latency and performance introduced by systems such as internal networks, SASE implementations, or gateways.

A blue and purple rectangular chart with iconsAI-generated content may be incorrect., Picture

The Internet Stack
  • Authentication – No modern monitoring system should have hard-coded credentials into a secure API, therefore monitoring systems must support secrets management, OAuth, tokens and modern authentication mechanisms.
  • Synthetic Code Tracing - As an API is being tested, collect and understand code execution traces to identify server-side issues including application, connectivity, and database problems.
  • Open Telemetry Support – modern observability implementations must support OTel as the standard mechanism to share and integrate data from multiple systems and to provide flexibility.
  • Focus on User experience – An API is only a component of a broader overall system performance. A payment API is likely a component of an online purchase transaction. You want to ensure the entire transaction system performs – from the end-user perspective. Ideally, an operations team would be able to see a visual representation of every dependency in the user transaction, from end-user across the internet, network, systems, APIs – all the way into code tracing.
  • Broad support for protocols – While many APIs use REST over HTTP, it may be important for your monitoring system to be able to test from both IPv4 and IPv6 agents, as well as support modern protocols like http/3 and QUIC,  MQTT for IoT applications, NTP for time synchronization, or even custom or proprietary protocols that your applications use.

Traditional vs modern API monitoring at a glance

The following table summarizes the key differences between legacy API monitoring approaches and modern, Internet Performance Monitoring strategies that support resilience and user experience.

Feature Traditional API Monitoring Modern API Monitoring (IPM)
Scope Server-centric metrics End-to-end user experience + infrastructure
Protocol Support Limited to HTTP/S, REST HTTP/3, QUIC, MQTT, custom protocols
Data Granularity High-cardinality data available but often limited to service boundaries High-cardinality traces with cross-system correlation (user IDs, sessions)
Root Cause Analysis Limited to app/server layers Full internet stack (DNS, SSL, routing, etc.)
Testing Perspective Cloud datacenters Last mile, backbone, cloud, wireless, and enterprise intelligent agents
Performance Context API performance in the context of code API performance in context of user experience
Alerting Methodology Alert thresholds based on error rates Experience scores and XLOs
Visualization Code-centric dashboards Visual representation of everything impacting a system

Rethink what API monitoring should do

It is somewhat surprising that the cloud is only 15 years old. As technology and system architecture has evolved, our monitoring has to evolve including API monitoring.  

What is today considered “owned” or “on-premises” infrastructure is most likely in a colocation datacenter, relying on a DNS and SSL provider, connected through at least two ISPs, depending on a cloud-based authentication system, connected through a cloud-based security provider and maybe a few other APIs.

We hear all the time “My APM system shows my systems are green, but my users keep complaining”. A monitoring system that only monitors your “on premises” API is not going to be able to spot, diagnose, or provide useful root-cause information to prevent or solve incidents quickly.

To ensure API resilience, enterprises must invest in modern monitoring solutions that provide end-to-end visibility, proactive alerting, and automated remediation capabilities.  

Ready to modernize your API monitoring?

This is some text inside of a div block.

You might also like

SRE Report 2026: What surprised us, what didn't, and why the gaps matter most

The SRE Report 2026: Defensible Ns

Why Synthetic Tracing Delivers Better Data, Not Just More Data