VictoriaMetrics is a monitoring solution. It was designed to collect and process telemetry from many systems, provide a retrospective view, and forecast metrics for capacity planning. But what about monitoring VictoriaMetrics itself?
There is one of the software development approaches called Observability Driven Development (ODD). In a nutshell, it means that developers should always keep in mind that software needs to be transparent to the person who uses it. Does your software make backups? Well, then let the user know how frequently it makes them, how many errors it encounters, how long it takes to make a backup, etc. If these questions aren’t answered at the design stage, it might be very complicated to address them later.
In VictoriaMetrics, we always try to provide all the necessary information to the user. In the first place, because we’re also users of our own product, and we run dozens of its installations internally. So answering questions using metrics and logs is critical for us.
Each component of the VictoriaMetrics ecosystem exposes metrics in Prometheus-compatible format on the /metrics page on the
TCP port set in -httpListenAddr command-line flag. For example, vmagent
by default exposes its metrics on the http://vmagent-host:8429/metrics page. These metrics can be collected by vmagent
itself, by single-server VictoriaMetrics,
by Prometheus or by any other compatible solution.
I strongly recommend configuring metrics collection from each VictoriaMetrics component you use. Having this data in place might be very insightful to better understand the software you run or be handy in finding the root cause if something doesn’t go as expected.
And, of course, these are not just metrics for metrics. But for dashboards and alerts.
VictoriaMetrics comes with a set of Grafana dashboards. Each dashboard is carefully designed to not only reflect the current state of the components but also to educate the user about internal details, to provide insights and recommendations.
For example, let’s go through our most popular dashboard - VictoriaMetrics cluster.
The dashboard consists of multiple rows. The first one, Stats, is supposed to give brief information about cluster
setup, allocated resources, components uptime:
 The Stats row contains information about cluster setup and resources
The Stats row contains a lot of useful info, but it is collapsed by default. When users open a dashboard, they want
to know if their cluster is healthy and continues to do its job. This information is displayed in the Overview row:
 The Overview row contains information about most important metrics: write and read queries
In Overview panels, users can find answers to the following questions:
If the Overview panels show that everything is fine and there are no anomalies, then there is no need to visit other rows.
But if something is not right, try visiting the Troubleshooting row:
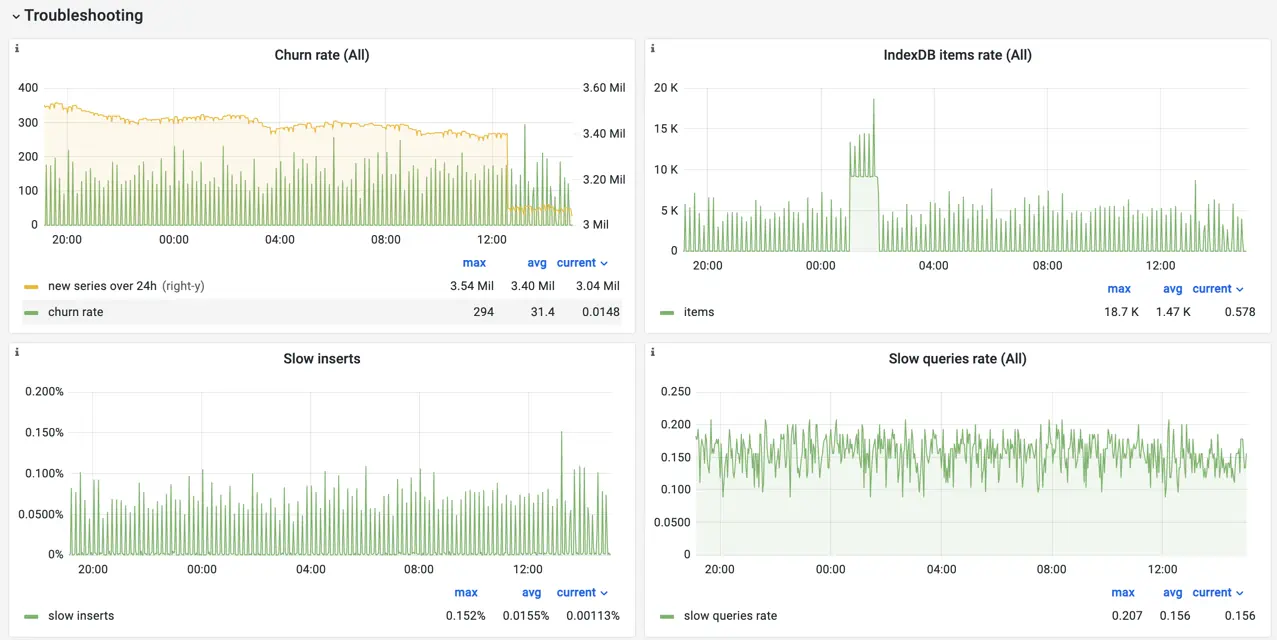 The Troubleshooting row contains metrics which could help identifying the issue with the cluster
If you’re not familiar with the metric shown on the panel, try hovering the cursor on the i icon in the top left corner
of the panel to get a hint:
 Additional information for users on the panel
Most of the panels on the dashboard contain such hints with explanations, additional info, and external links. But some metrics are self-descriptive, such as CPU and Memory usage:
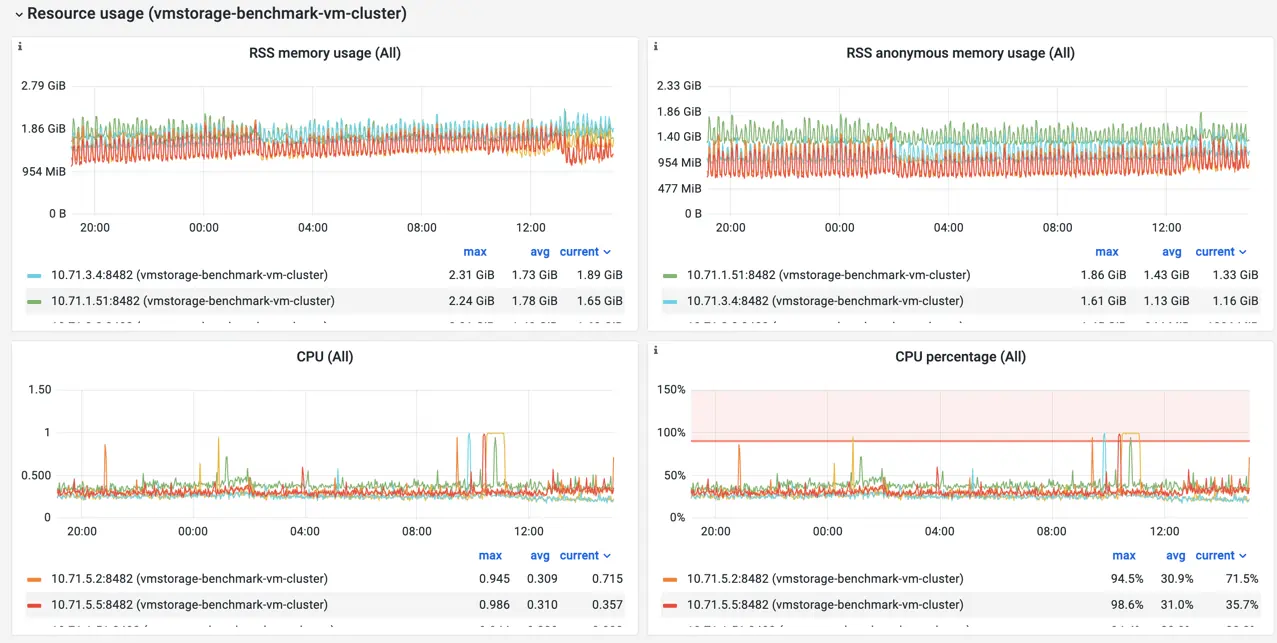 The Resource Usage row contains metrics showing resource usage by cluster components
Row Resource usage can help identify resource constraints for VictoriaMetrics components, whether it is CPU,
memory, disk speed, or even file descriptors exhaustion.
The dashboard also contains rows per each cluster’s component type: vmstorage, vmselect and vminsert. Panels
in these rows are supposed to address the following questions:
There is much more information on the dashboard than described above. It is interesting to learn and understand for a better experience with VictoriaMetrics. But I don’t recommend spending too much time on it. If there is something you need to be aware of, let the alerting system to notify you.
Alerting rules for VictoriaMetrics components are available here. To start using them, you need to install and configure vmalert, Prometheus or any other tool compatible with Alert Generator specification.
The loaded list of rules is evaluated periodically, checking if everything is okay with the metrics you collect for VictoriaMetrics components:
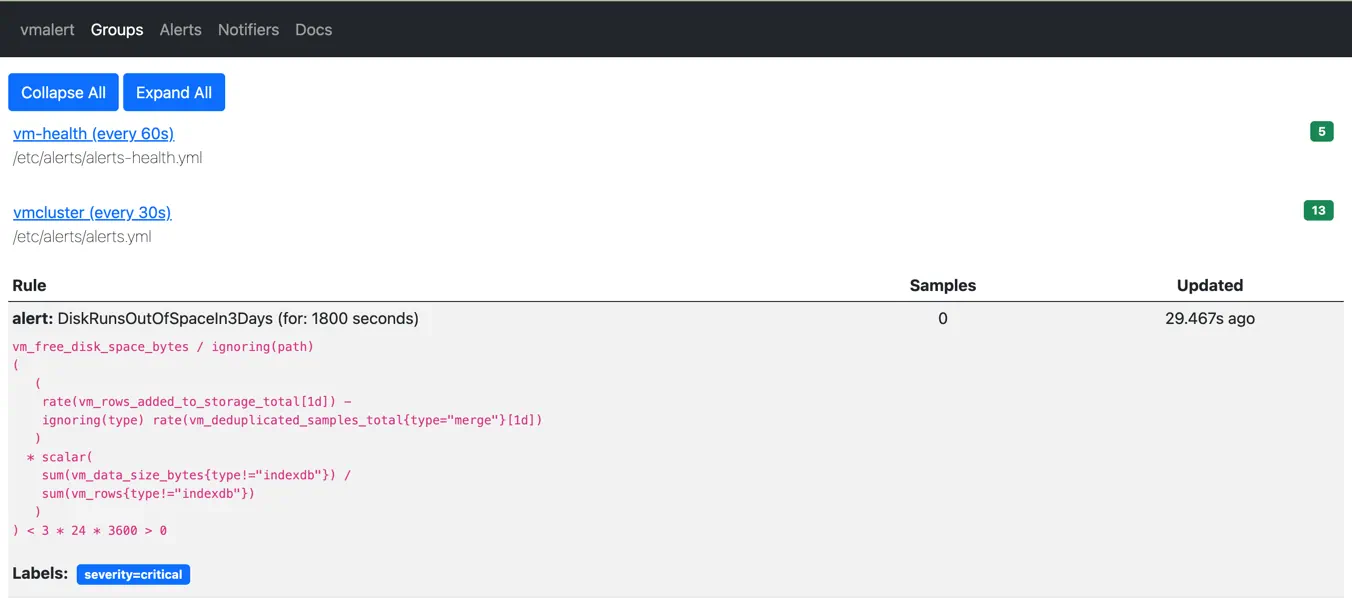 Alerting rules displayed via vmalert's UI
When something goes wrong, the corresponding alerting rule in vmalert becomes firing. Every firing alert contains
additional information about what is happening, affected components, and recommendations for mitigation:
 Alerting rule in firing state displayed via vmalert's UI
Firing alerts are then sent to the Alertmanager - a tool from the Prometheus ecosystem, which is responsible for sending notifications to various receivers such as email, slack, telegram, pagerduty, opsgenie, etc.
Alerting rules are also integrated
with Grafana dashboards. Each rule contains a link to the specific dashboard’s panel in the annotations field:
- alert: DiskRunsOutOfSpaceIn3Days
  annotations:
    dashboard: "http://localhost:3000/d/oS7Bi_0Wz?viewPanel=113&var-instance={{ $labels.instance }}"
Please note, http://localhost:3000 need to be adjusted to point to your Grafana installation.
So when the user receives an alert notification generated by vmalert, they can just click on the dashboard link to get
more details on what happens.
Each component of the VictoriaMetrics ecosystem produces logs in a consistent format. Log lines contain verbose
detailed information about events that happened during the component operation. We always try keeping log messages
clear and descriptive. For example, the following snippet of vminsert logs shows what happened when one of the vmstorage
pods stopped:
2022-09-20T11:20:28.852Z    warn    cannot send 29712 bytes with 237 rows to -storageNode="vmstorage-2:8400": cannot read `ack` from vmstorage: EOF; closing the connection to storageNode and re-routing this data to healthy storage nodes
2022-09-20T11:20:29.111Z    warn    cannot dial storageNode "vmstorage-2:8400": dial tcp4: lookup vmstorage-2 on 127.0.0.11:53: no such host
In the log above, you can find information about which exact vmstorage became unreachable for vminsert, what was the error message, what did vminsert do in response to this situation.
Always monitor your monitoring system. The rule of thumb is to have a separate installation of VictoriaMetrics or any other monitoring solution to scrape metrics from the VictoriaMetrics components. This would make monitoring independent and will help identify problems with the main monitoring installation.
Install and adjust alerting rules, so you’ll always be notified immediately if something happens or is going to happen.
Download Grafana dashboards, so you can always check the state of your VictoriaMetrics installation, explore its patterns, see them in retrospect, and correlate events.
Verify you have quick access to VictoriaMetrics logs. In most cases, a careful reading of the error message gives enough information to understand the issue and act on it.
The expected flow when debugging issues in VictoriaMetrics is the following:
As a runbook, use the Troubleshooting section from official docs.
I hope the recommendations in this post will give enough information and tools for maintaining a healthy and performant VictoriaMetrics installation. But when in doubt, ask for assistance and we’ll be happy to help. For enterprise users, we provide a Monitoring of Monitoring service, where the VictoriaMetrics team looks after installations, notifies about potential issues, and helps to build performant and reliable setups.
此内容由惯性聚合(RSS阅读器)自动聚合整理,仅供阅读参考。 原文来自 — 版权归原作者所有。