One of the latest benchmarks we did was for OSMC 2022 talk
VictoriaMetrics: scaling to 100 million metrics per second -
see the video
and slides.
While the fact that VictoriaMetrics can handle data ingestion rate at 100 million samples per second for one billion of active time series is newsworthy on its own, the benchmark tool used to generate that kind of load is usually overlooked. This blog post explains the challenges of scaling the prometheus-benchmark tool for generating such a load.
The prometheus-benchmark tool has been already mentioned in Benchmarking Prometheus-compatible time series databases and Grafana Mimir and VictoriaMetrics: performance tests blog posts.
The most crucial part of any database benchmark is the data. The efficiency of the read queries, indexes, compression, and even CPU usage would depend on the “shape of data” used during the tests. For public benchmarks, people usually pick a neutral data set and perform all the tests on it. For example, the New York City Taxi data set is heavily used for testing and comparing analytical databases.
But what if public data sets aren’t fitting your needs: are too big or too small; too specific or too broad? The answer is usually “to generate the data yourself”! While it may sound like a simple solution, data generation is a very complex task since data never exists apart from the application area.
For example, we want our database to store meter readings. We can generate a data set of N meters, each having M readings. But how do we choose the values for each reading? Would it be random? No, random data isn’t a good idea in most cases, since it is too far from real-world data seen in production.
Meters aren’t showing random values: each type of meter has its own distribution nature of values (aka “data shape”). For example, temperature readings are usually related to each other and have a sinusoidal shape over days, while voltage readings are more “chaotic”:
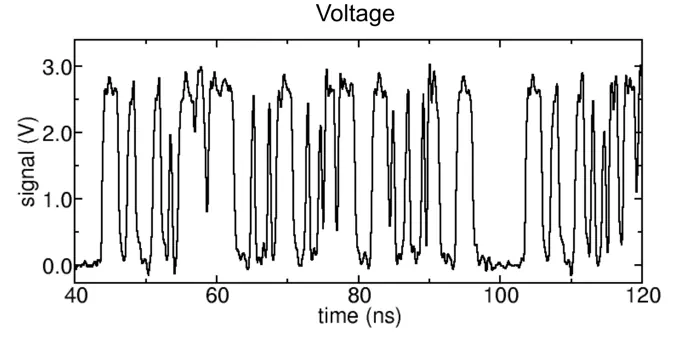
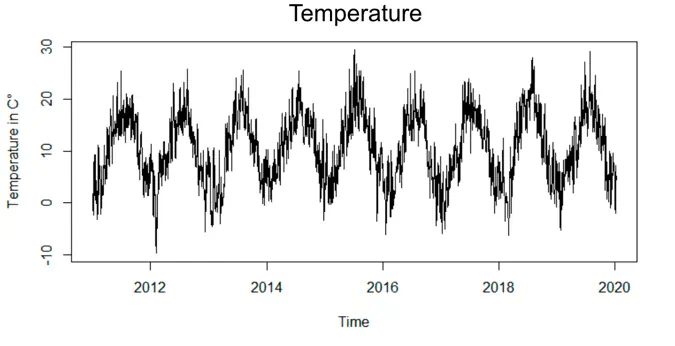
Images for voltage and temperature time series are captured from the public resources as example.
But the “chaotic” voltage data isn’t random too - it is, at least, bounded by min and max values, speed of change, etc. So think twice before writing your own data generator from scratch.
One of the most popular benchmark suites for time series data is TSBS. VictoriaMetrics is represented in the suite as well, but we stopped using it long ago. TSBS was no match for our purposes due to the following reasons:
The way how the TSBS works assumes that the user completes the following actions one by one:
But this is not how “real world” works. In reality, steps 2 and 3 are simultaneous and rate-limited: the database constantly processes the ingestion load and serves read queries at the same time. It is very important to understand how these two processes affect each other and how the database manages the given resources.
Another important point is tests duration: checking how the tested database behaves under constant pressure over long periods of time. For example, in Scaling Grafana Mimir to 500 million active series the benchmark was running for 72h, and the authors detected an anomaly in the queries error rate with 2 hours interval. It appeared, that the errors were caused by the scheduled compaction process that occurs every 2 hours. Such things could reveal themselves only during continuous tests.
So how could the benchmark be done better? From our experience, both Prometheus and VictoriaMetrics are mostly used for hardware monitoring. The most popular Prometheus metrics exporter is node-exporter, so we built a benchmark tool that uses it as a source of data. The benefits of such an approach are the following:
We needed something very efficient and transparent from a monitoring perspective for delivering the data from node-exporter to the tested database. So we used vmagent - a swiss army knife for metrics collection. It is optimized for speed and it comes along with a Grafana dashboard for monitoring.
For read load, we use vmalert configured with typical alerting rules
used in production for the node-exporter metrics. vmalert captures latency and success rate of executed queries,
and also provides a Grafana dashboard for monitoring.
Altogether, these components form a tool that can ingest production-like data as long as it is needed. It can be easily scaled from a thousand samples/s to 100 million samples/s with the configured number of unique time series (aka cardinality). The source of metrics - node-exporter - can be easily replaced with any other exporter or application to provide a different set of metrics. The same goes for read load, which can be easily adjusted by changing the list of alerting rules and the interval of their execution.
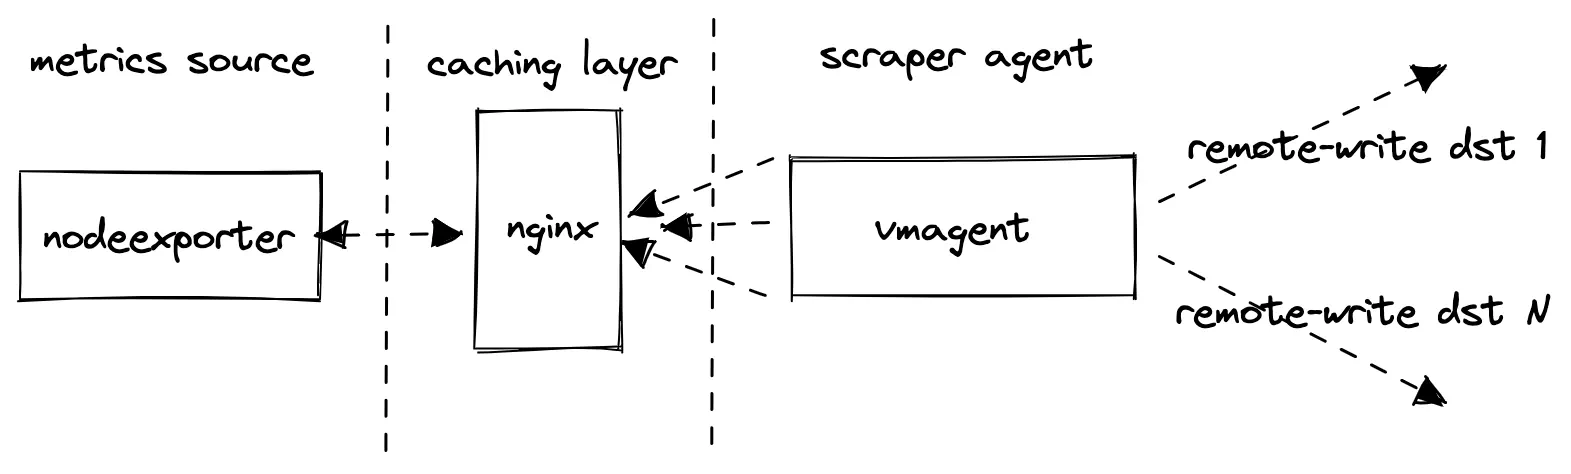 Prometheus remote write benchmark architecture diagram.
More details can be found here.
So how did it work for the 100M benchmark? To generate 100M samples/s for a billion of active time series, our benchmark suite used 16 replicas, 8 vCPU and 25GB RAM each.
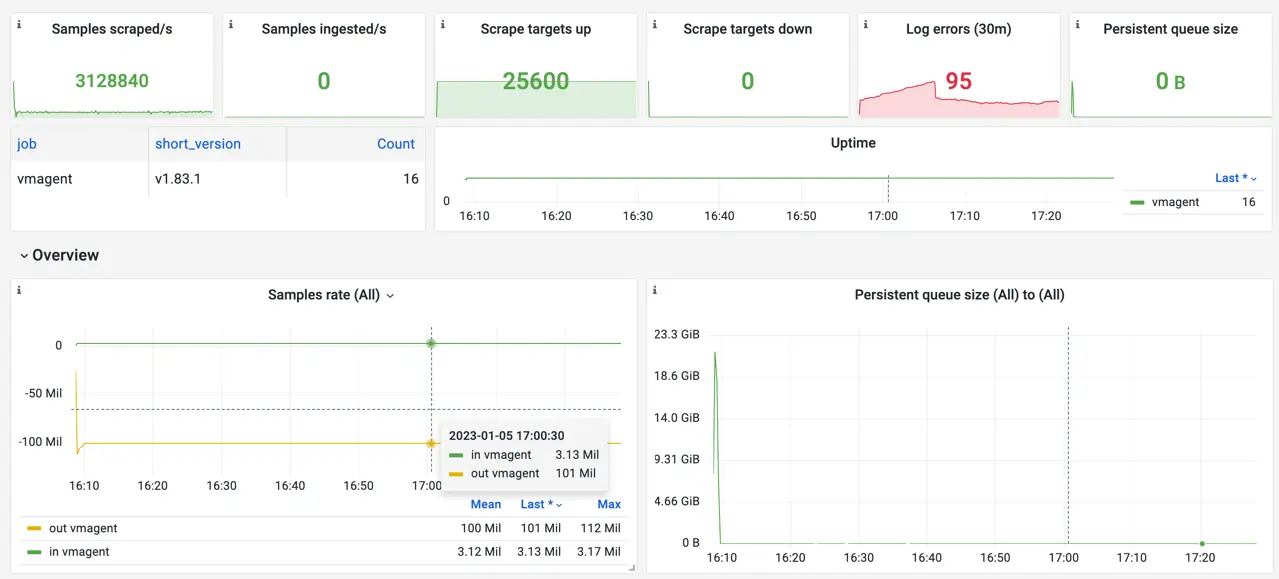 Screenshot of the official Grafana dashboard for VictoriaMetrics vmagent during the benchmark.
The most CPU-intensive part of the work for vmagent is the parsing of the scraped data. Each scrape also generates additional
pressure on Nginx and node-exporter processes. So in order to save some resources, we decided to benefit
from VictoriaMetrics API enhancements.
Adding extra_label param to the remote write URL instructs VictoriaMetrics to add an extra label to all
the received data via this URL. This made it possible to introduce a writeURLReplicas: N benchmark config,
which makes vmagent fan-out the scraped data N times, each with a unique url_replica label in URL.
This is why vmagent scrapes 3.13M samples/s from node-exporter instances, but writes 3.13 * 32 replicas = 101M samples/s to the remote storage.
This is cheating a bit, but it has no significant effect on VictoriaMetrics itself. All the written data remains
unique thanks to url_replica label, so the database can’t apply any optimizations here. On the other hand, it helps
save a lot of resources on the benchmark suite and provides a sustainable level of write load.
In total, the benchmark was able to sustain a stable 2 GB/s data stream to the configured remote storage:
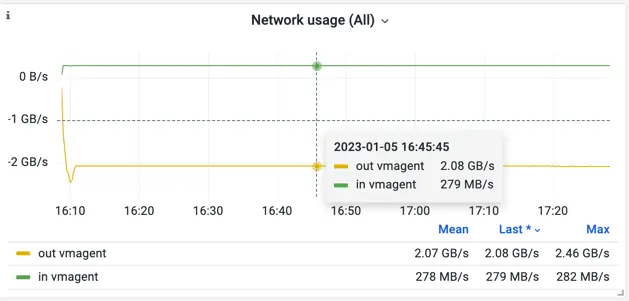 Screenshot of the official Grafana dashboard for VictoriaMetrics vmagent during the benchmark. Network.
You can find a snapshot of the vmagent dashboard during one of the test rounds here.
We’re pretty happy with the prometheus-benchmark tool. It helps us not only perform benchmarks on a tremendous scale, but also helps us constantly test VictoriaMetrics releases internally.
Thanks to the infinite source of data, we can run benchmarking constantly and get results very close to what we observe in various production environments. All VictoriaMetrics components are shipped with alerting rules and Grafana dashboards, so once something is wrong we’re getting notifications immediately. Good observability for benchmarking is critical and we’re glad it helps us to keep everything transparent.
If you are evaluating different Prometheus-compatible monitoring solutions, then try testing them with the prometheus-benchmark tool on the expected workload. This will help determining the best solution for your needs.
Check other relevant blog posts:
此内容由惯性聚合(RSS阅读器)自动聚合整理,仅供阅读参考。 原文来自 — 版权归原作者所有。