


[Xinwei Xiong Me] · November 15, 2023
7 min · 1366 words · EN | 中
OpenIM offers various flexible deployment options to suit different environments and requirements. Here is a simplified and optimized description of these deployment options:
- Source Code Deployment:
- Regular Source Code Deployment: Deployment using the
nohupmethod. This is a basic deployment method suitable for development and testing environments. For details, refer to the Regular Source Code Deployment Guide . - Production-Level Deployment: Deployment using the
systemmethod, more suitable for production environments. This method provides higher stability and reliability. For details, refer to the Production-Level Deployment Guide .
- Regular Source Code Deployment: Deployment using the
- Cluster Deployment:
- Kubernetes Deployment: Provides two deployment methods, including deployment through Helm and sealos. This is suitable for environments that require high availability and scalability. Specific methods can be found in the Kubernetes Deployment Guide .
- Docker Deployment:
- Regular Docker Deployment: Suitable for quick deployments and small projects. For detailed information, refer to the Docker Deployment Guide .
- Docker Compose Deployment: Provides more convenient service management and configuration, suitable for complex multi-container applications.
Next, we will introduce the specific steps, monitoring, and management backend configuration for each of these deployment methods, as well as usage tips to help you choose the most suitable deployment option according to your needs.
Source Code & Docker
Deployment
OpenIM deploys openim-server and openim-chat from source code, while other components are deployed via Docker.
For Docker deployment, you can deploy all components with a single command using the openimsdk/openim-docker repository. The deployment configuration can be found in the environment.sh document, which provides information on how to learn and familiarize yourself with various environment variables.
For Prometheus, it is not enabled by default. To enable it, set the environment variable before executing make init:
export PROMETHEUS_ENABLE=true # Default is false
Then, execute:
make init
docker compose up -d
Configuration
To configure Prometheus data sources in Grafana, follow these steps:
Log in to Grafana: First, open your web browser and access the Grafana URL. If you haven’t changed the port, the address is typically http://localhost:3000 .
Log in with default credentials: Grafana’s default username and password are both
admin. You will be prompted to change the password on your first login.Access Data Sources Settings:
- In the left menu of Grafana, look for and click the “gear” icon representing “Configuration.”
- In the configuration menu, select “Data Sources.”
Add a New Data Source:
- On the Data Sources page, click the “Add data source” button.
- In the list, find and select “Prometheus.”
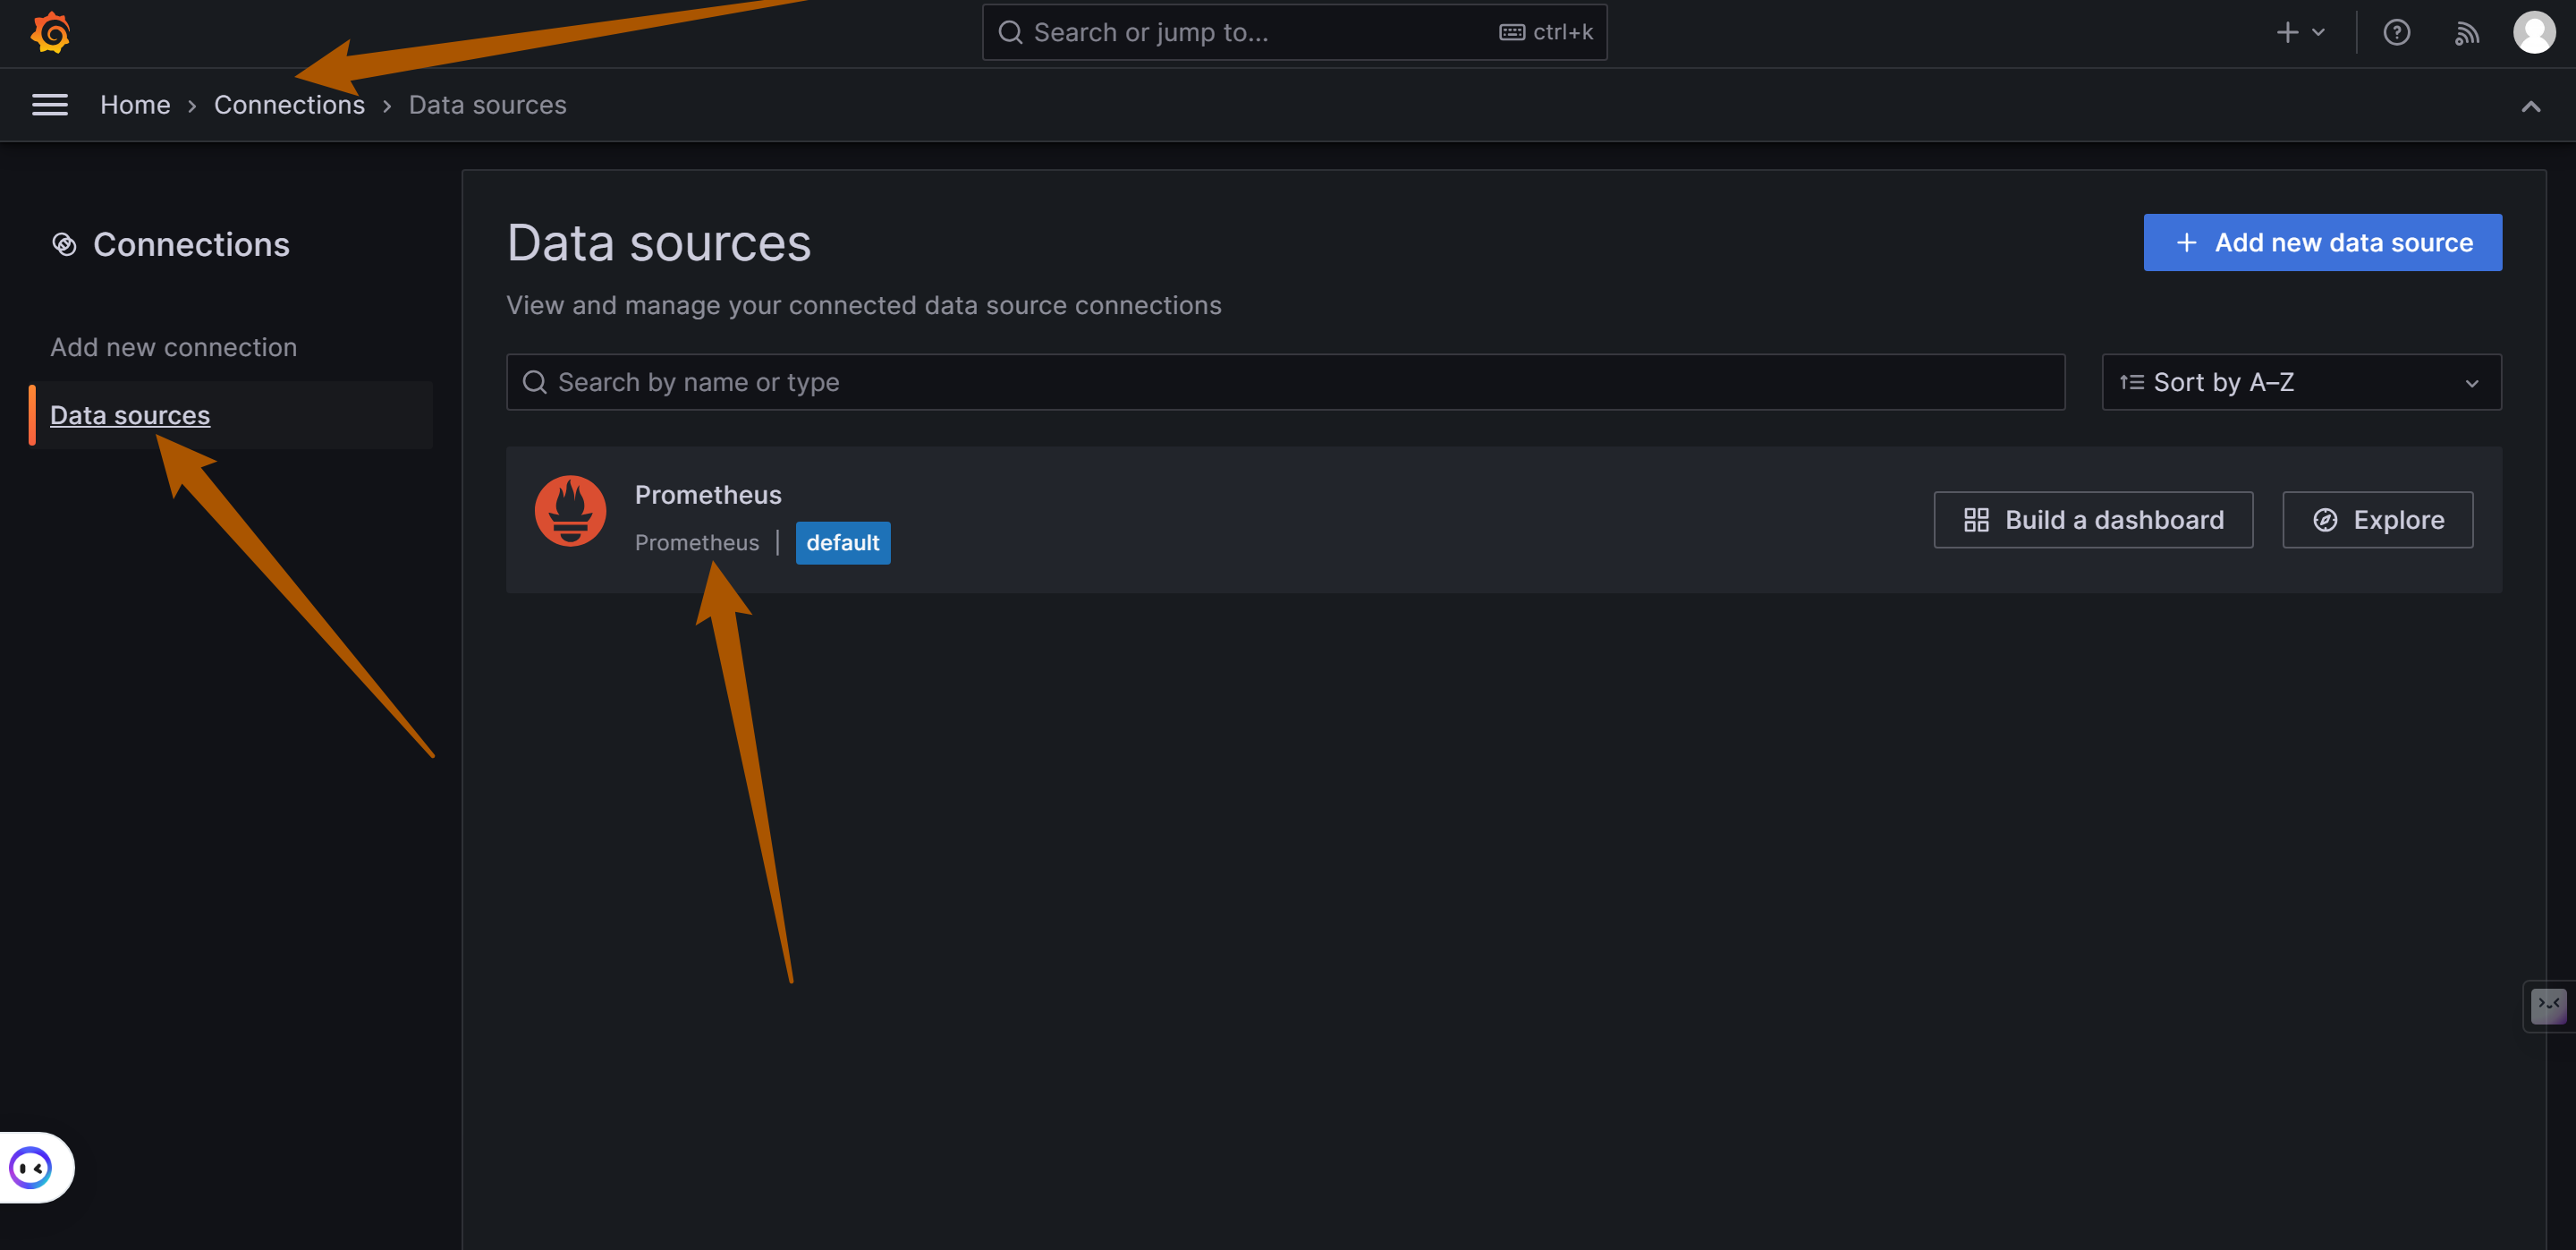
Click
Add New connectionto add more data sources, such as Loki (responsible for log storage and query processing).Configure the Prometheus Data Source:
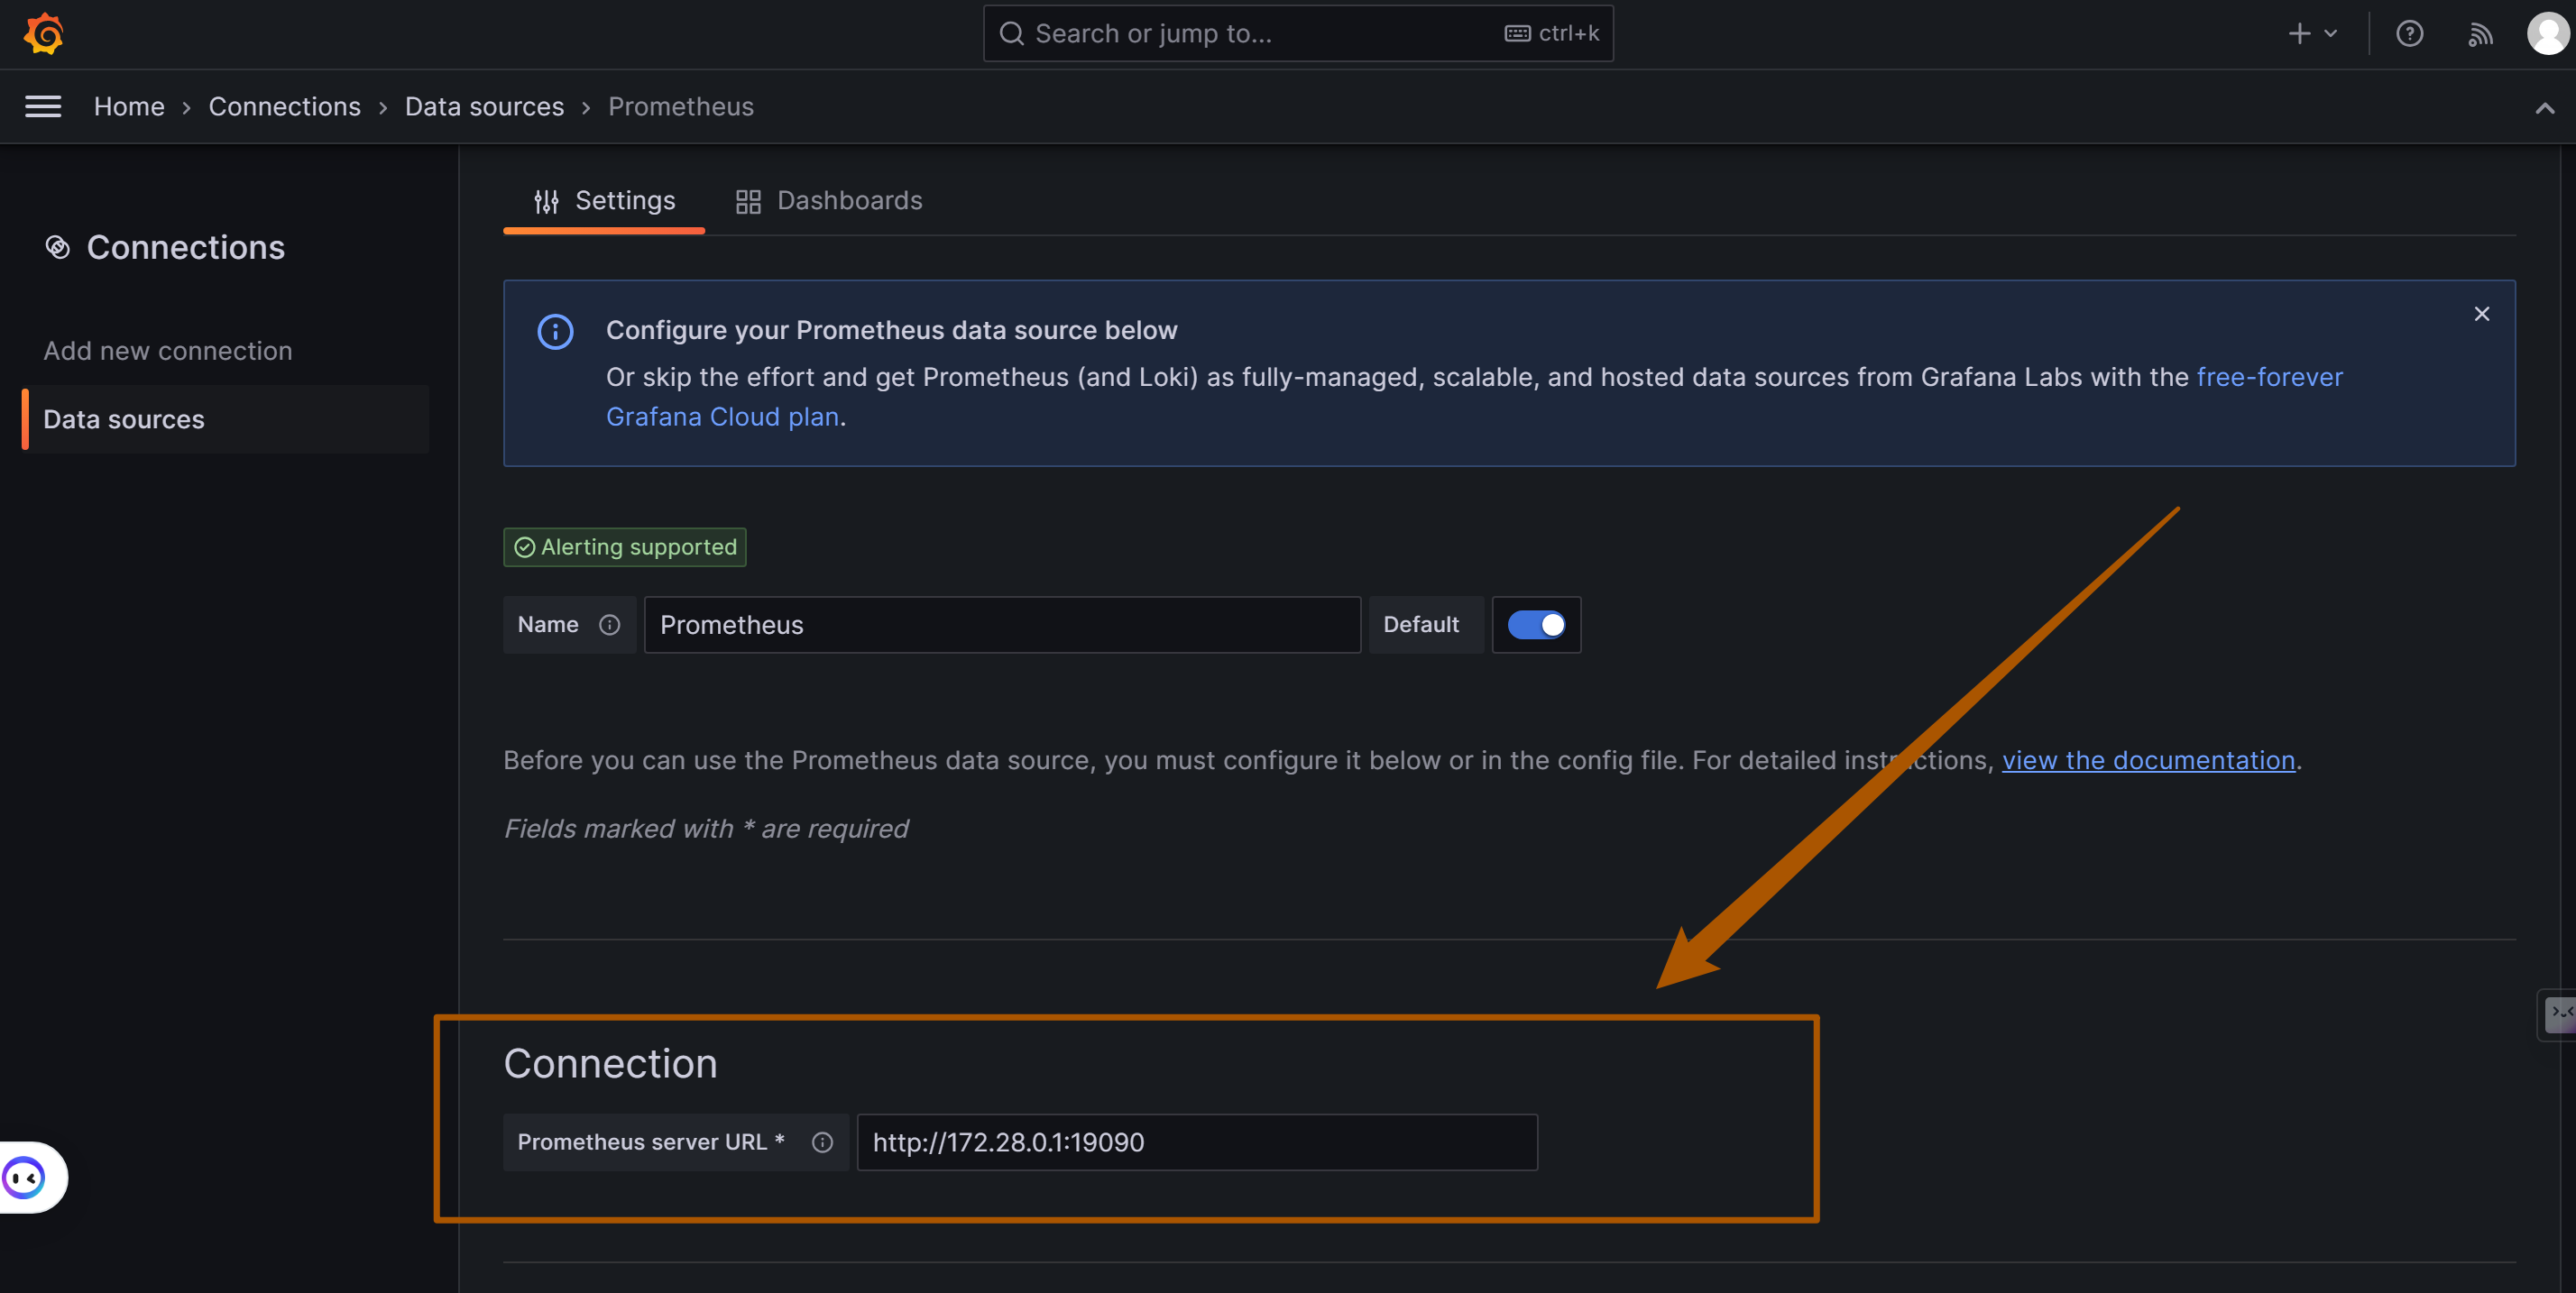
- On the configuration page, fill in the details of the Prometheus server. This typically includes the URL of the Prometheus service (e.g., if Prometheus is running on the same machine as OpenIM, the URL might be
http://172.28.0.1:19090, with the address matching theDOCKER_BRIDGE_GATEWAYvariable address). OpenIM and the components are linked via a gateway. The default port used by OpenIM is19090. - Adjust other settings as needed, such as authentication and TLS settings.
- On the configuration page, fill in the details of the Prometheus server. This typically includes the URL of the Prometheus service (e.g., if Prometheus is running on the same machine as OpenIM, the URL might be
Save and Test:
- After completing the configuration, click the “Save & Test” button to ensure that Grafana can successfully connect to Prometheus.
Importing Dashboards in Grafana
Importing Grafana Dashboards is a straightforward process and is applicable to OpenIM Server application services and Node Exporter. Here are detailed steps and necessary considerations:
Key Metrics Overview and Deployment Steps
To monitor OpenIM in Grafana, you need to focus on three categories of key metrics, each with its specific deployment and configuration steps:
- OpenIM Metrics (
prometheus-dashboard.yaml):- Configuration File Path: Located at
config/prometheus-dashboard.yaml. - Enabling Monitoring: Set the environment variable
export PROMETHEUS_ENABLE=trueto enable Prometheus monitoring. - More Information: Refer to the OpenIM Configuration Guide .
- Configuration File Path: Located at
- Node Exporter:
- Container Deployment: Deploy the
quay.io/prometheus/node-exportercontainer for node monitoring. - Get Dashboard: Access the Node Exporter Full Feature Dashboard and import it using YAML file download or ID import.
- Deployment Guide: Refer to the Node Exporter Deployment Documentation .
- Container Deployment: Deploy the
- Middleware Metrics: Each middleware requires specific steps and configurations to enable monitoring. Here is a list of common middleware and links to their respective setup guides:
- MySQL:
- Configuration: Ensure MySQL has performance monitoring enabled.
- Link: Refer to the MySQL Monitoring Configuration Guide .
- Redis:
- Configuration: Configure Redis to allow monitoring data export.
- Link: Refer to the Redis Monitoring Guide .
- MongoDB:
- Configuration: Set up monitoring metrics for MongoDB.
- Link: Refer to the MongoDB Monitoring Guide .
- Kafka:
- Configuration: Integrate Kafka with Prometheus monitoring.
- Link: Refer to the Kafka Monitoring Guide .
- Zookeeper:
- Configuration: Ensure Zookeeper can be monitored by Prometheus.
- Link: Refer to the Zookeeper Monitoring Configuration .
- MySQL:
Importing Steps:
Access the Dashboard Import Interface:
- Click the
+icon on the left menu or in the top right corner of Grafana, then select “Create.” - Choose “Import” to access the dashboard import interface.
- Click the
Perform Dashboard Import:
- Upload via File: Directly upload your YAML file.
- Paste Content: Open the YAML file, copy its content, and paste it into the import interface.
- Import via Grafana.com Dashboard: Visit Grafana Dashboards , search for the desired dashboard, and import it using its ID.
Configure the Dashboard:
- Select the appropriate data source, such as the previously configured Prometheus.
- Adjust other settings, such as the dashboard name or folder.
Save and View the Dashboard:
- After configuring, click “Import” to complete the process.
- Immediately view the new dashboard after successful import.
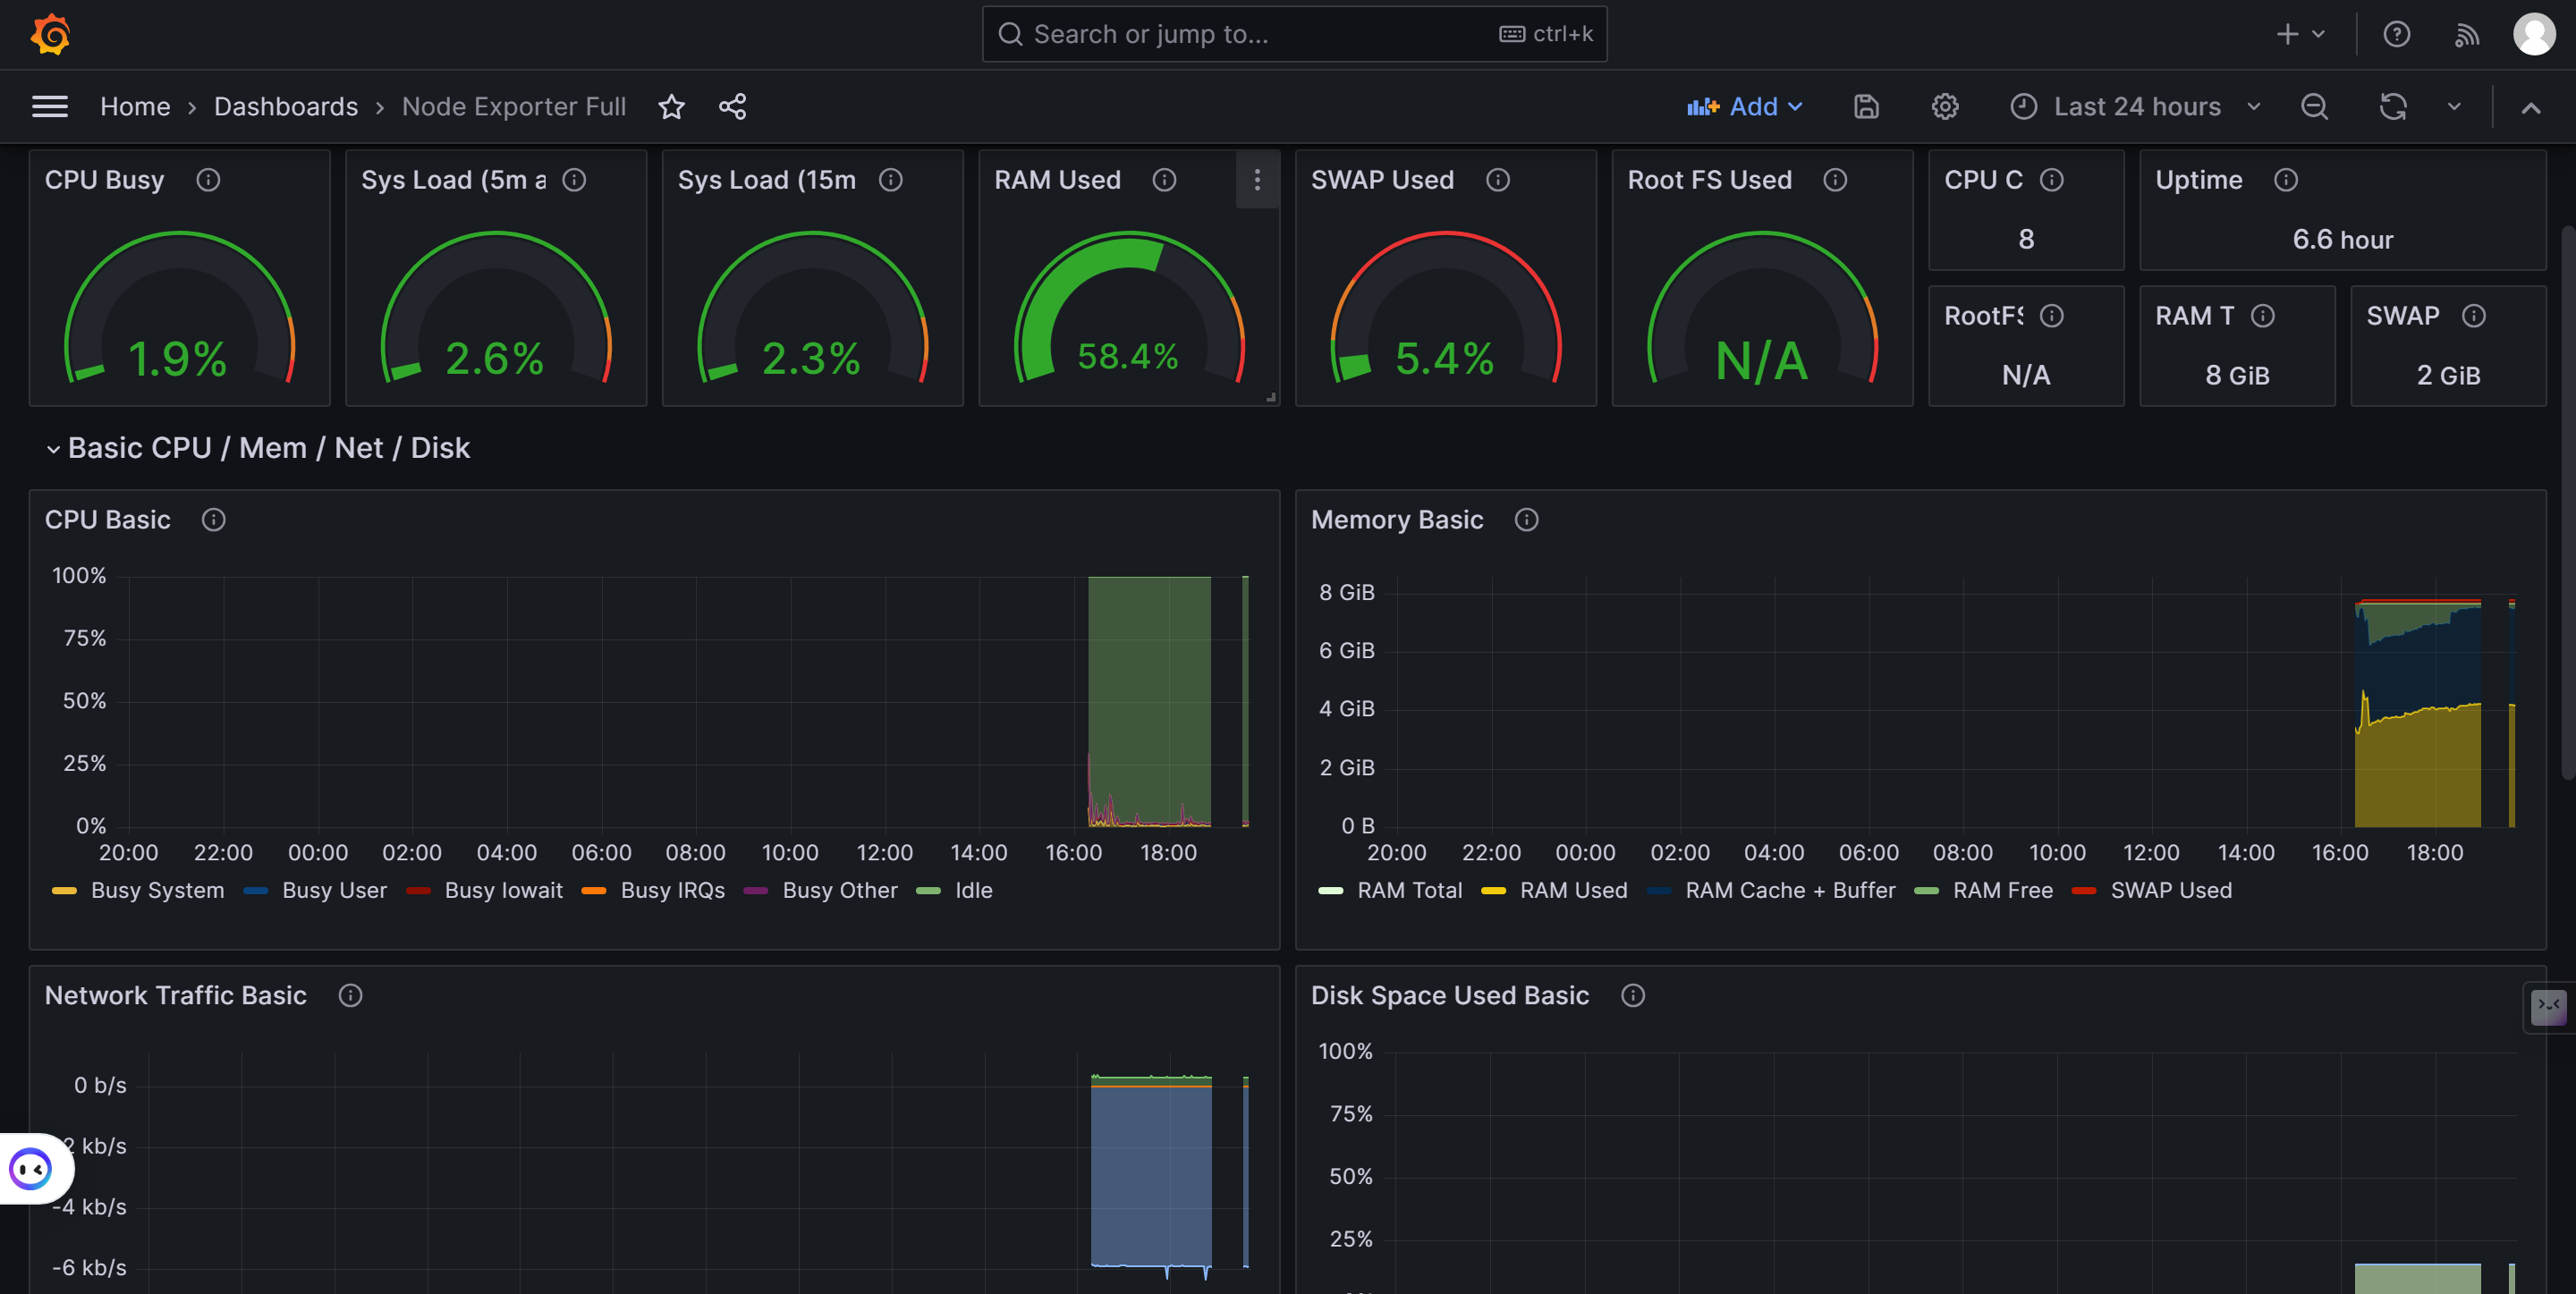
Graph Examples:
Monitoring Running in Docker Guide
Introduction
This guide provides the steps to run OpenIM using Docker. OpenIM is an open-source instant messaging solution that can be quickly deployed using Docker. For more information, please refer to the OpenIM Docker GitHub .
Prerequisites
- Ensure that Docker and Docker Compose are installed.
- Basic understanding of Docker and containerization technology.
Step 1: Clone the Repository
First, clone the OpenIM Docker repository:
git clone https://github.com/openimsdk/openim-docker.git
Navigate to the repository directory and check the README file for more information and configuration options.
Step 2: Start Docker Compose
In the repository directory, run the following command to start the service:
This will download the required Docker images and start the OpenIM service.
Step 3: Use the OpenIM Web Interface
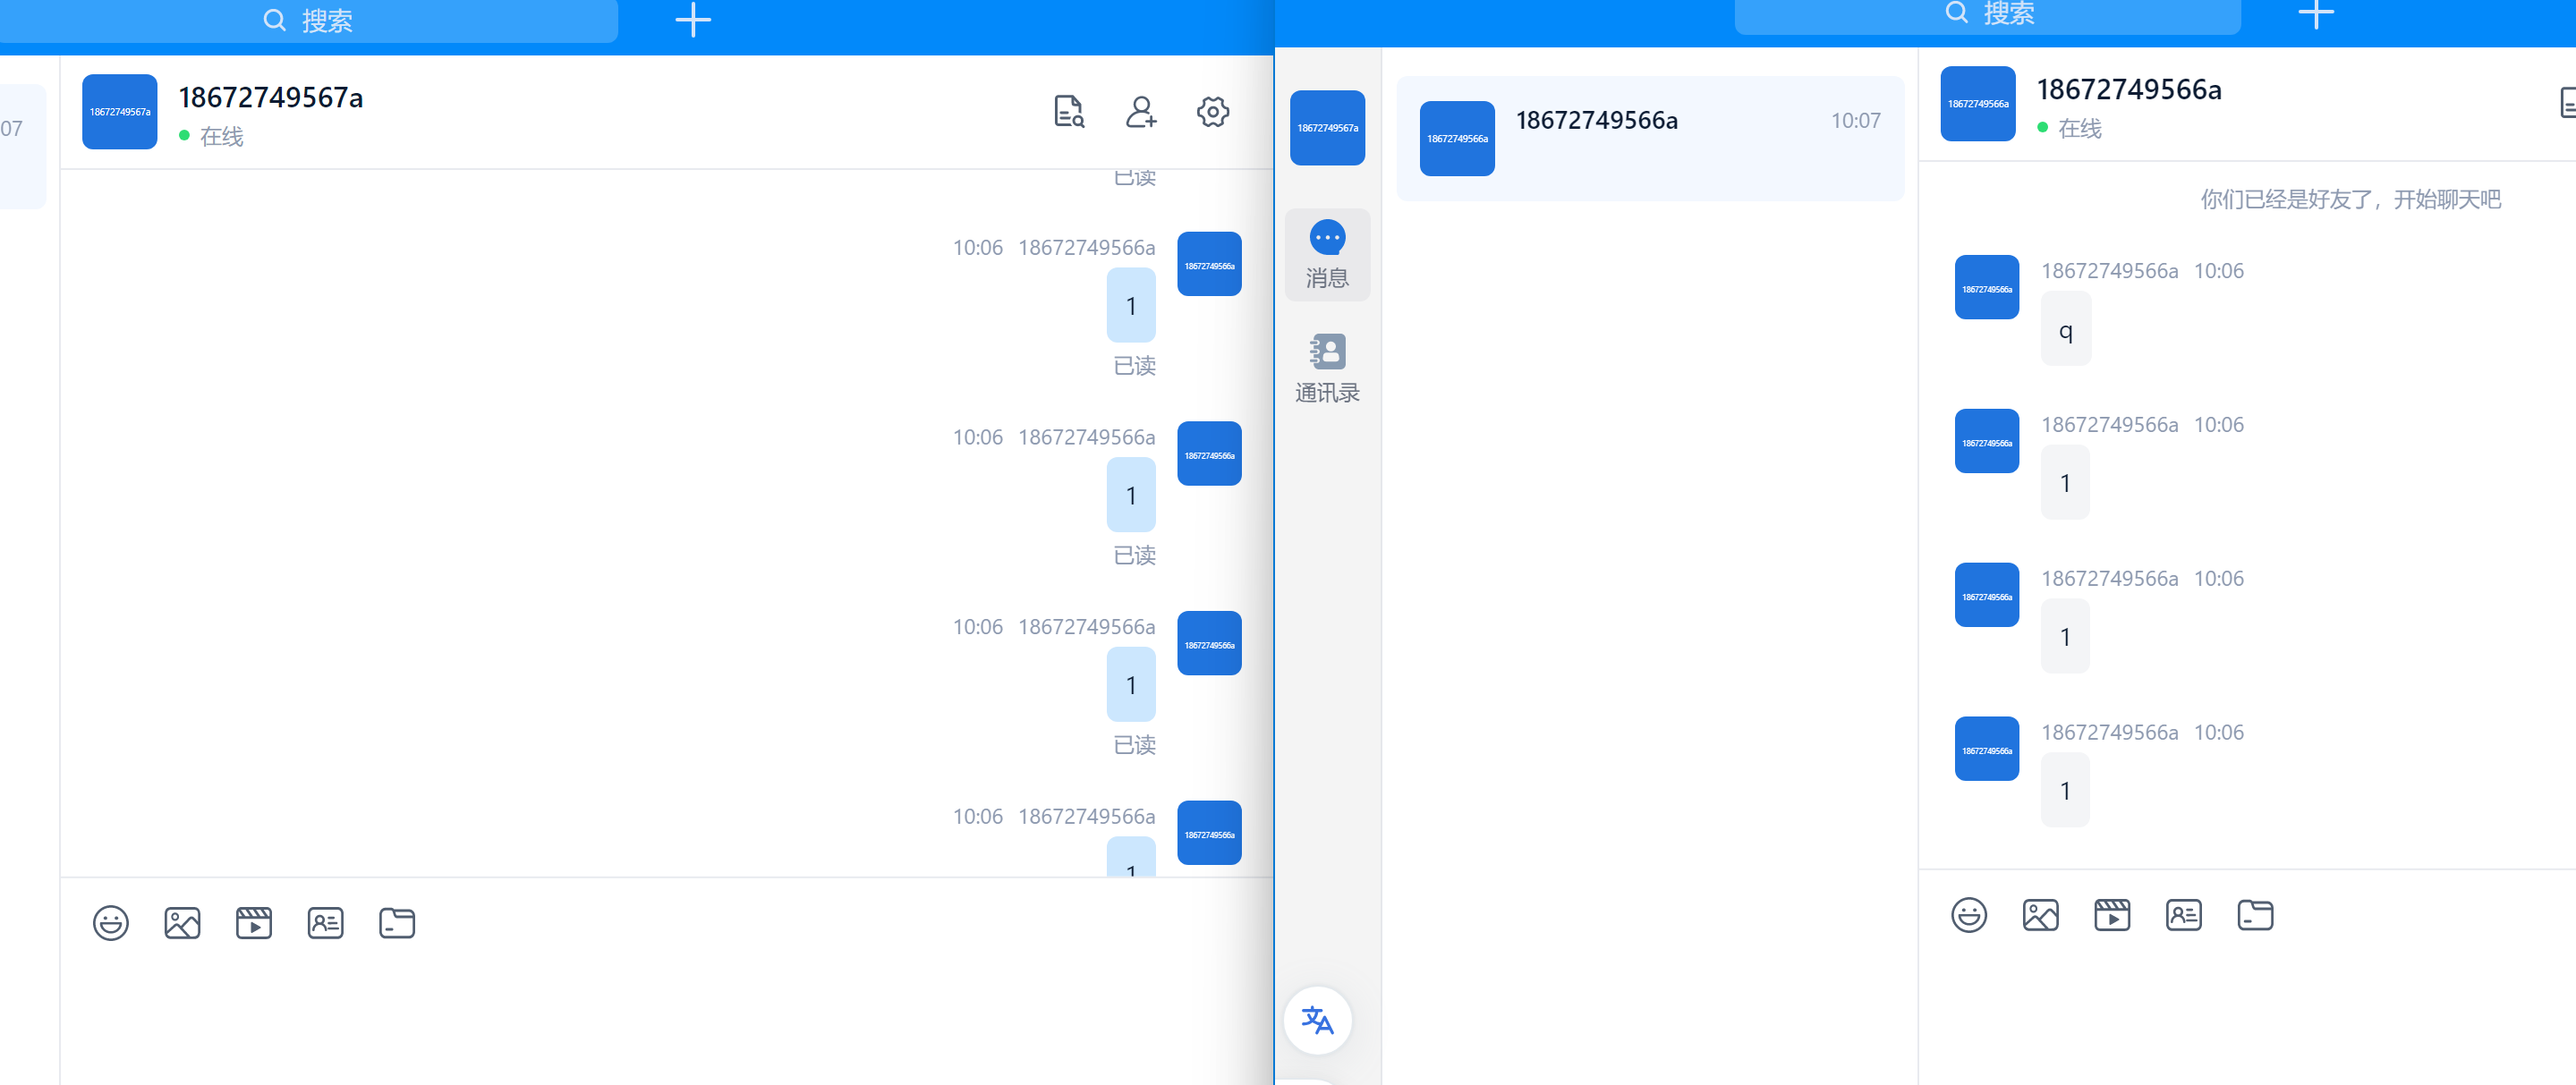
- Open a browser in private mode and access OpenIM Web .
- Register two users and try adding friends.
- Test sending messages and pictures.
Running Effect
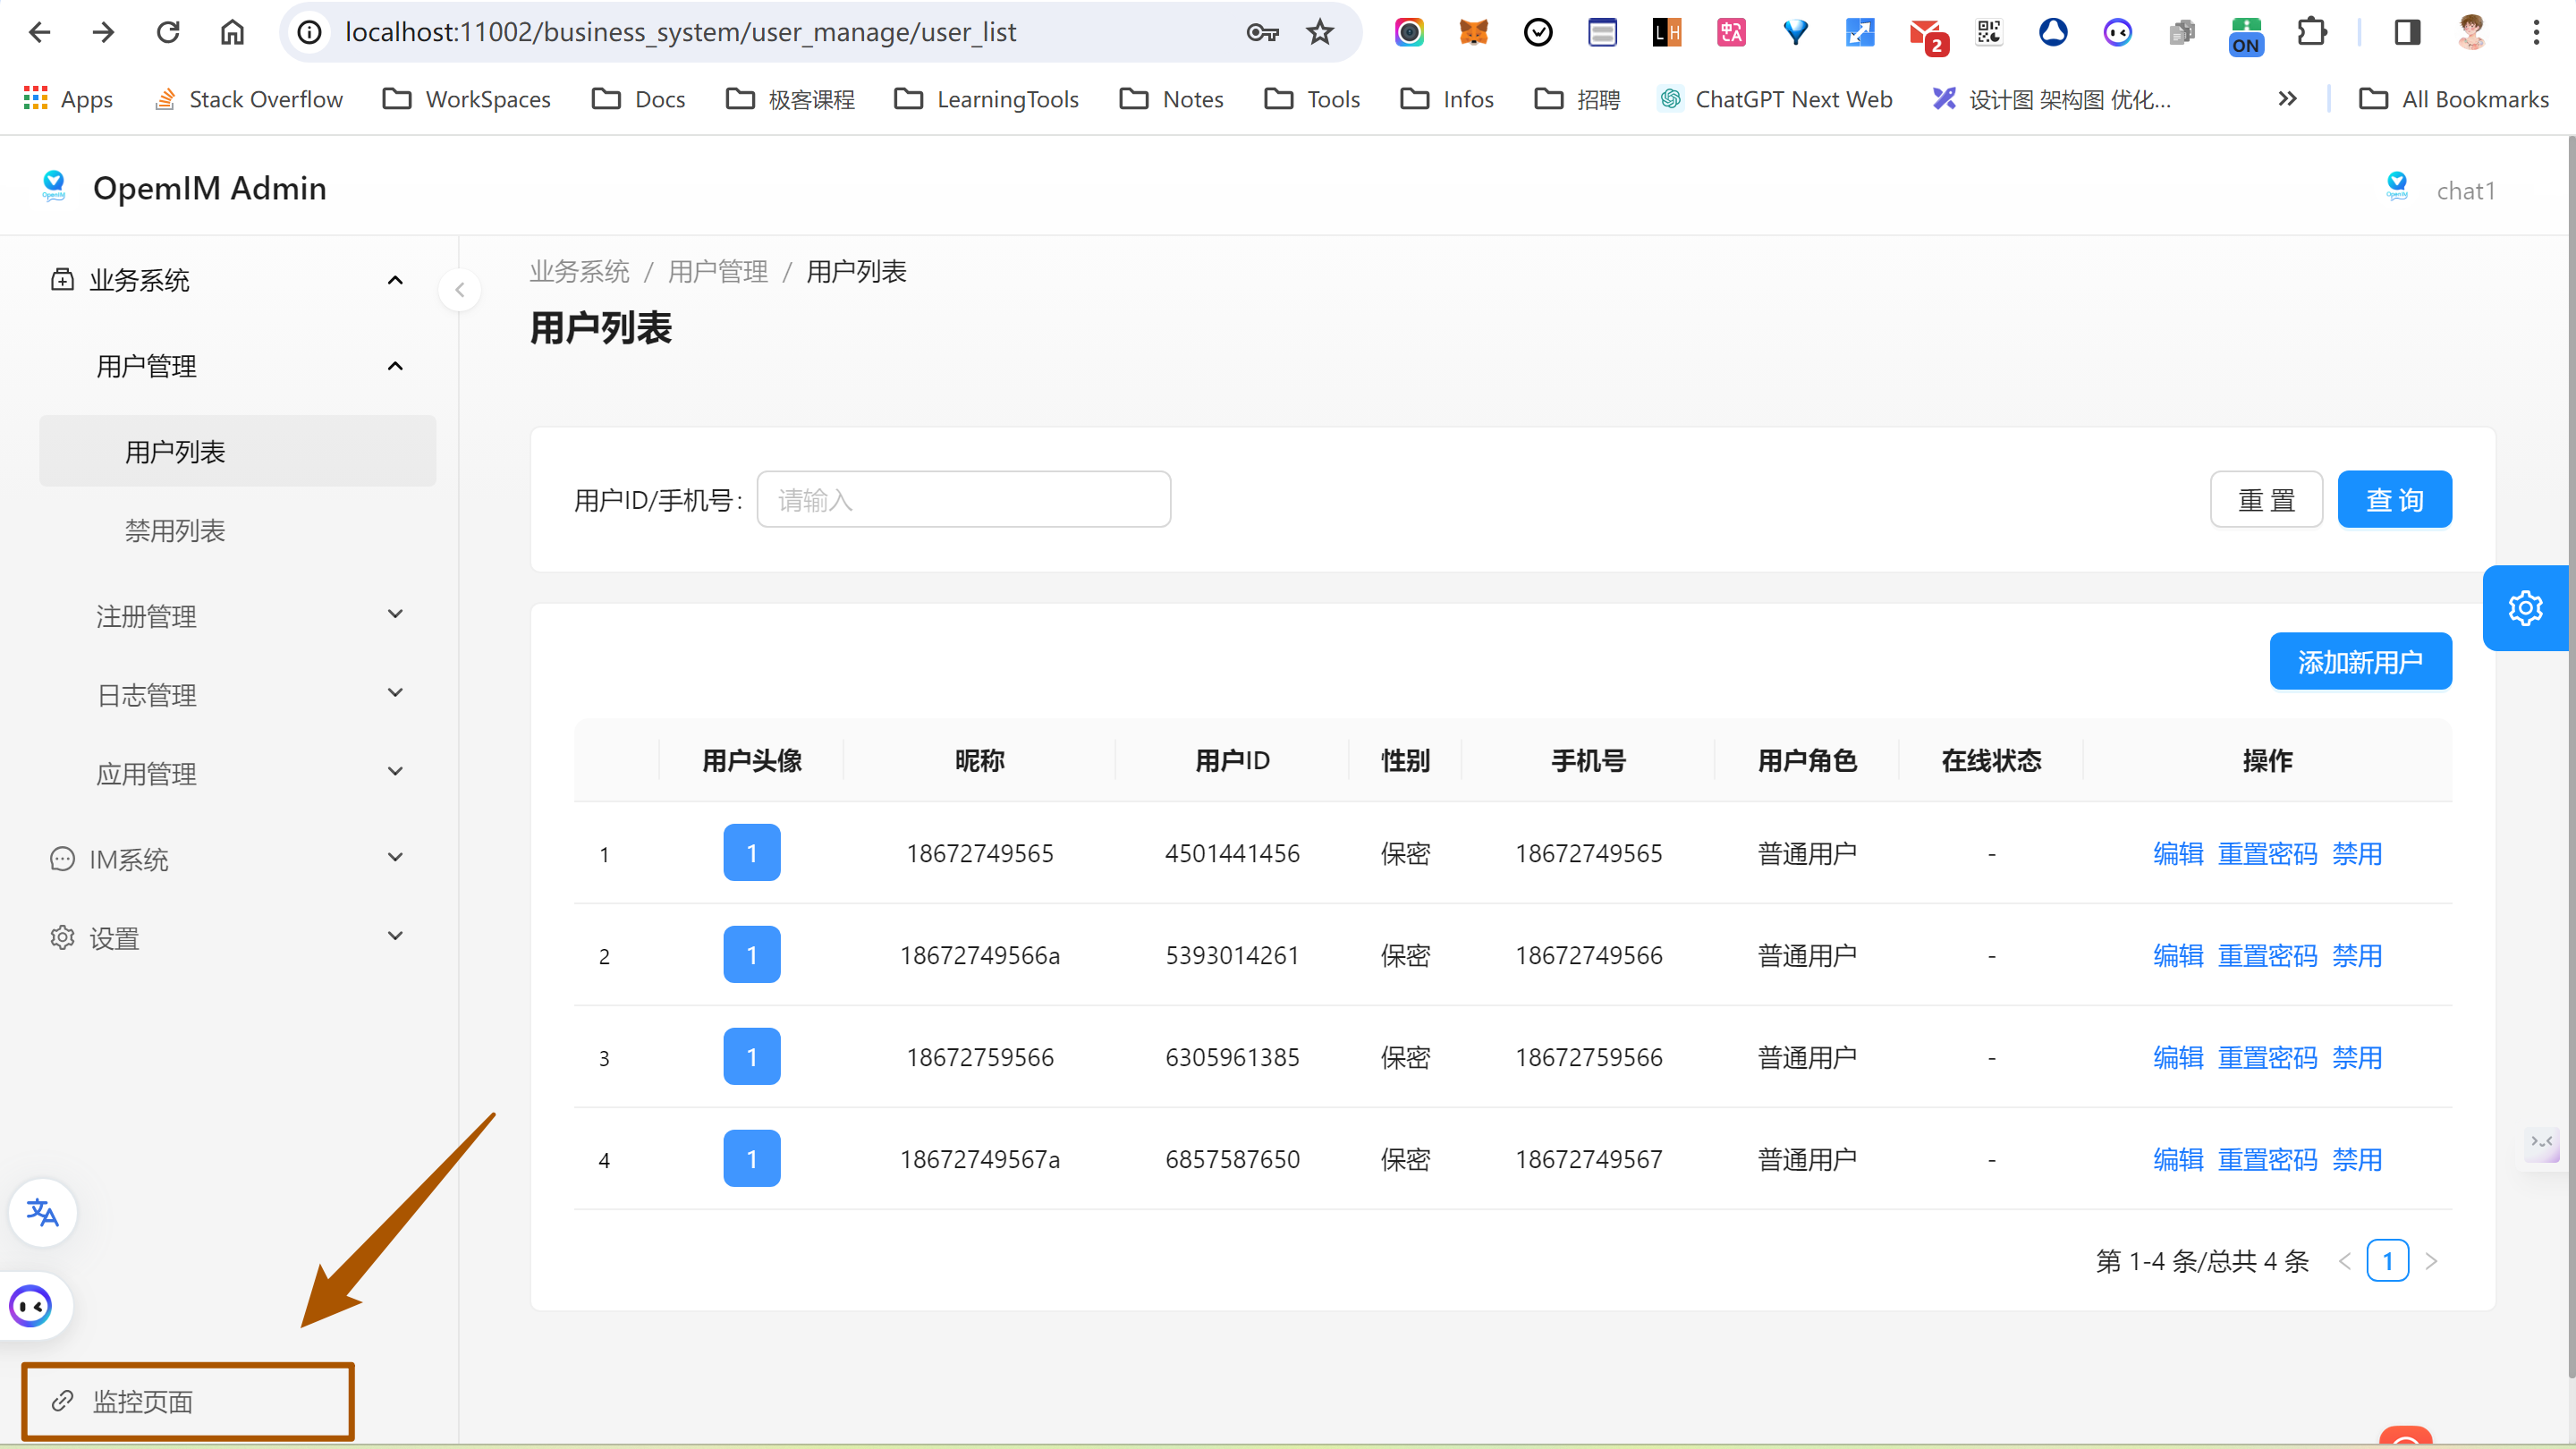
Step 4: Access the Admin Panel
- Access the OpenIM Admin Panel .
- Log in using the default username and password (
admin1:admin1).
Running Effect Image:
Step 5: Access the Monitoring Interface
- Log in to the Monitoring Interface
using the credentials (
admin:admin).
Next Steps
- Configure and manage the services following the steps provided in the OpenIM source code.
- Refer to the
READMEfile for advanced configuration and management.
Troubleshooting
- If you encounter any issues, please check the documentation on OpenIM Docker GitHub or search for related issues in the Issues section.
- If the problem persists, you can create an issue on the openim-docker repository or the openim-server repository.
Kubernetes
Refer to openimsdk/helm-charts .
When deploying and monitoring OpenIM in a Kubernetes environment, you will focus on three main metrics: middleware, custom OpenIM metrics, and Node Exporter. Here are detailed steps and guidelines:
Middleware Monitoring
Middleware monitoring is crucial to ensure the overall system’s stability. Typically, this includes monitoring the following components:
- MySQL: Monitor database performance, query latency, and more.
- Redis: Track operation latency, memory usage, and more.
- MongoDB: Observe database operations, resource usage, and more.
- Kafka: Monitor message throughput, latency, and more.
- Zookeeper: Keep an eye on cluster status, performance metrics, and more.
For Kubernetes environments, you can use the corresponding Prometheus Exporters to collect monitoring data for these middleware components.
Custom OpenIM Metrics
Custom OpenIM metrics provide essential information about the OpenIM application itself, such as user activity, message traffic, system performance, and more. To monitor these metrics in Kubernetes:
- Ensure OpenIM application configurations expose Prometheus metrics.
- When deploying using Helm charts (refer to OpenIM Helm Charts ), pay attention to configuring relevant monitoring settings.
Node Exporter
Node Exporter is used to collect hardware and operating system-level metrics for Kubernetes nodes, such as CPU, memory, disk usage, and more. To integrate Node Exporter in Kubernetes:
- Deploy Node Exporter using the appropriate Helm chart. You can find information and guides on Prometheus Community .
- Ensure Node Exporter’s data is collected by Prometheus instances within your cluster.