惯性聚合 高效追踪和阅读你感兴趣的博客、新闻、科技资讯
阅读原文 在惯性聚合中打开

推荐订阅源

W
WeLiveSecurity
博客园 - 【当耐特】
Microsoft Azure Blog
WordPress大学
WordPress大学
Stack Overflow Blog
Stack Overflow Blog
cs.AI updates on arXiv.org
IT之家
IT之家
Cloudbric
Cloudbric
The Register - Security
小众软件
小众软件
PCI Perspectives
PCI Perspectives
G
Google Developers Blog
AI
AI
OSCHINA 社区最新新闻
OSCHINA 社区最新新闻
Google DeepMind News
宝玉的分享
宝玉的分享
Recent Commits to openclaw:main
量子位
TaoSecurity Blog
TaoSecurity Blog
cs.CV updates on arXiv.org
F
Full Disclosure
N
Netflix TechBlog - Medium
博客园_首页
Last Week in AI
Last Week in AI
A
Arctic Wolf
B
Blog RSS Feed
J
Java Code Geeks
C
Cybersecurity and Infrastructure Security Agency CISA
I
InfoQ
aimingoo的专栏
aimingoo的专栏
云风的 BLOG
云风的 BLOG
NISL@THU
NISL@THU
MyScale Blog
MyScale Blog
H
Hackread – Cybersecurity News, Data Breaches, AI and More
Jina AI
Jina AI
有赞技术团队
有赞技术团队
S
Schneier on Security
L
Lohrmann on Cybersecurity
P
Privacy & Cybersecurity Law Blog
T
Threat Research - Cisco Blogs
P
Palo Alto Networks Blog
S
Security @ Cisco Blogs
Security Archives - TechRepublic
Security Latest
Security Latest
Vercel News
Vercel News
博客园 - 司徒正美
Webroot Blog
Webroot Blog
Hacker News: Ask HN
Hacker News: Ask HN
A
About on SuperTechFans

吴润写字的地方

从零构建 A 股 ETF 动量轮动系统:一个量化新手的完整指南 2025 年 8 月 Digest 2025 年 7 月 Digest 2025 年 6 月 Digest 2025 年 5 月 Digest 2025 年 4 月 Digest 清明桐庐行 2025 年 3 月 Digest 2024 年终总结 换车 崇明岛一日游 夜游徐汇滨江绿地 2023 年终总结 踏春之浦康休闲公园 香港澳门行 读「投资第一课」有感 皮皮玩球 Chrome 插件推荐 Go 并发之道:并发介绍 The Night Agent 我是如何使用 ChatGPT 的 2022 年终总结 在 Ubuntu 上搭建 MinIO 2021 年终总结 Golang 不可寻址的理解 Golang 的 defer 关键字使用注意事项 恭王府 强制删除 k8s terminating 状态命名空间 PromQL 如何计算变化(率) Trickster 使用 奥森的向日葵 Go Modules - checksum mismatch 错误解决 CDN 使用初探 k8s 介绍 再探 798 解决 gin 路由冲突问题 wu.run 域名正式使用 GoLand 使用指南 macOS 软件推荐 2020 这一年 Python 循环列表删除元素的注意事项 Mac 下的定时任务工具:Launchctl Linux 服务器搭建 VNC 可视化桌面 Jenkins 个别 job 页面打开超时的解决方法 遇见 Aamir Khan Hexo 从 GitHub 到阿里云 『从未说出口的秘密』词云分析 768 的秋天 北戴河 Outing 飞盘记 三里屯夜景 爬虫图解:轮子哥关注了哪些人 2017-06-30 GitHub+Hexo 搭建个人网站详细教程 特朗普税改 如果有一天,苹果和微信只能选一个,你会选哪一个? About | 吴润写字的地方 Links | 吴润写字的地方 Memos | 吴润写字的地方
PromQL 计算 CPU 使用率
2021-08-11 · via 吴润写字的地方

本文主要介绍如何使用 PromQL 计算 CPU 的使用(利用)率。

在介绍之前,先了解下 CPU 的模式有哪些。在 Linux 机器上,使用 top 命令:

~# top
top - 12:13:21 up 93 days, 14:10,  1 user,  load average: 0.00, 0.02, 0.00
Tasks: 132 total,   1 running, 131 sleeping,   0 stopped,   0 zombie
%Cpu(s):  1.0 us,  0.3 sy,  0.0 ni, 98.7 id,  0.0 wa,  0.0 hi,  0.0 si,  0.0 st

可以看到 CPU 一共有八种模式(状态),后面跟的数值是该模式的使用率,模式分别是:

  • us: user 模式
  • sy: system 模式
  • ni: nice 模式
  • id: idle 模式
  • wa: iowait 模式
  • hi: hardware interrupt 模式
  • si: software interrupt 模式
  • st: steal 模式

其中,user、system 和 idle 是 CPU 主要的模式。

注:准确说 CPU 一共是十种状态,还有两种:guest、guest_nice,它们的数值包含在 user 和 nice 状态中

CPU 时间

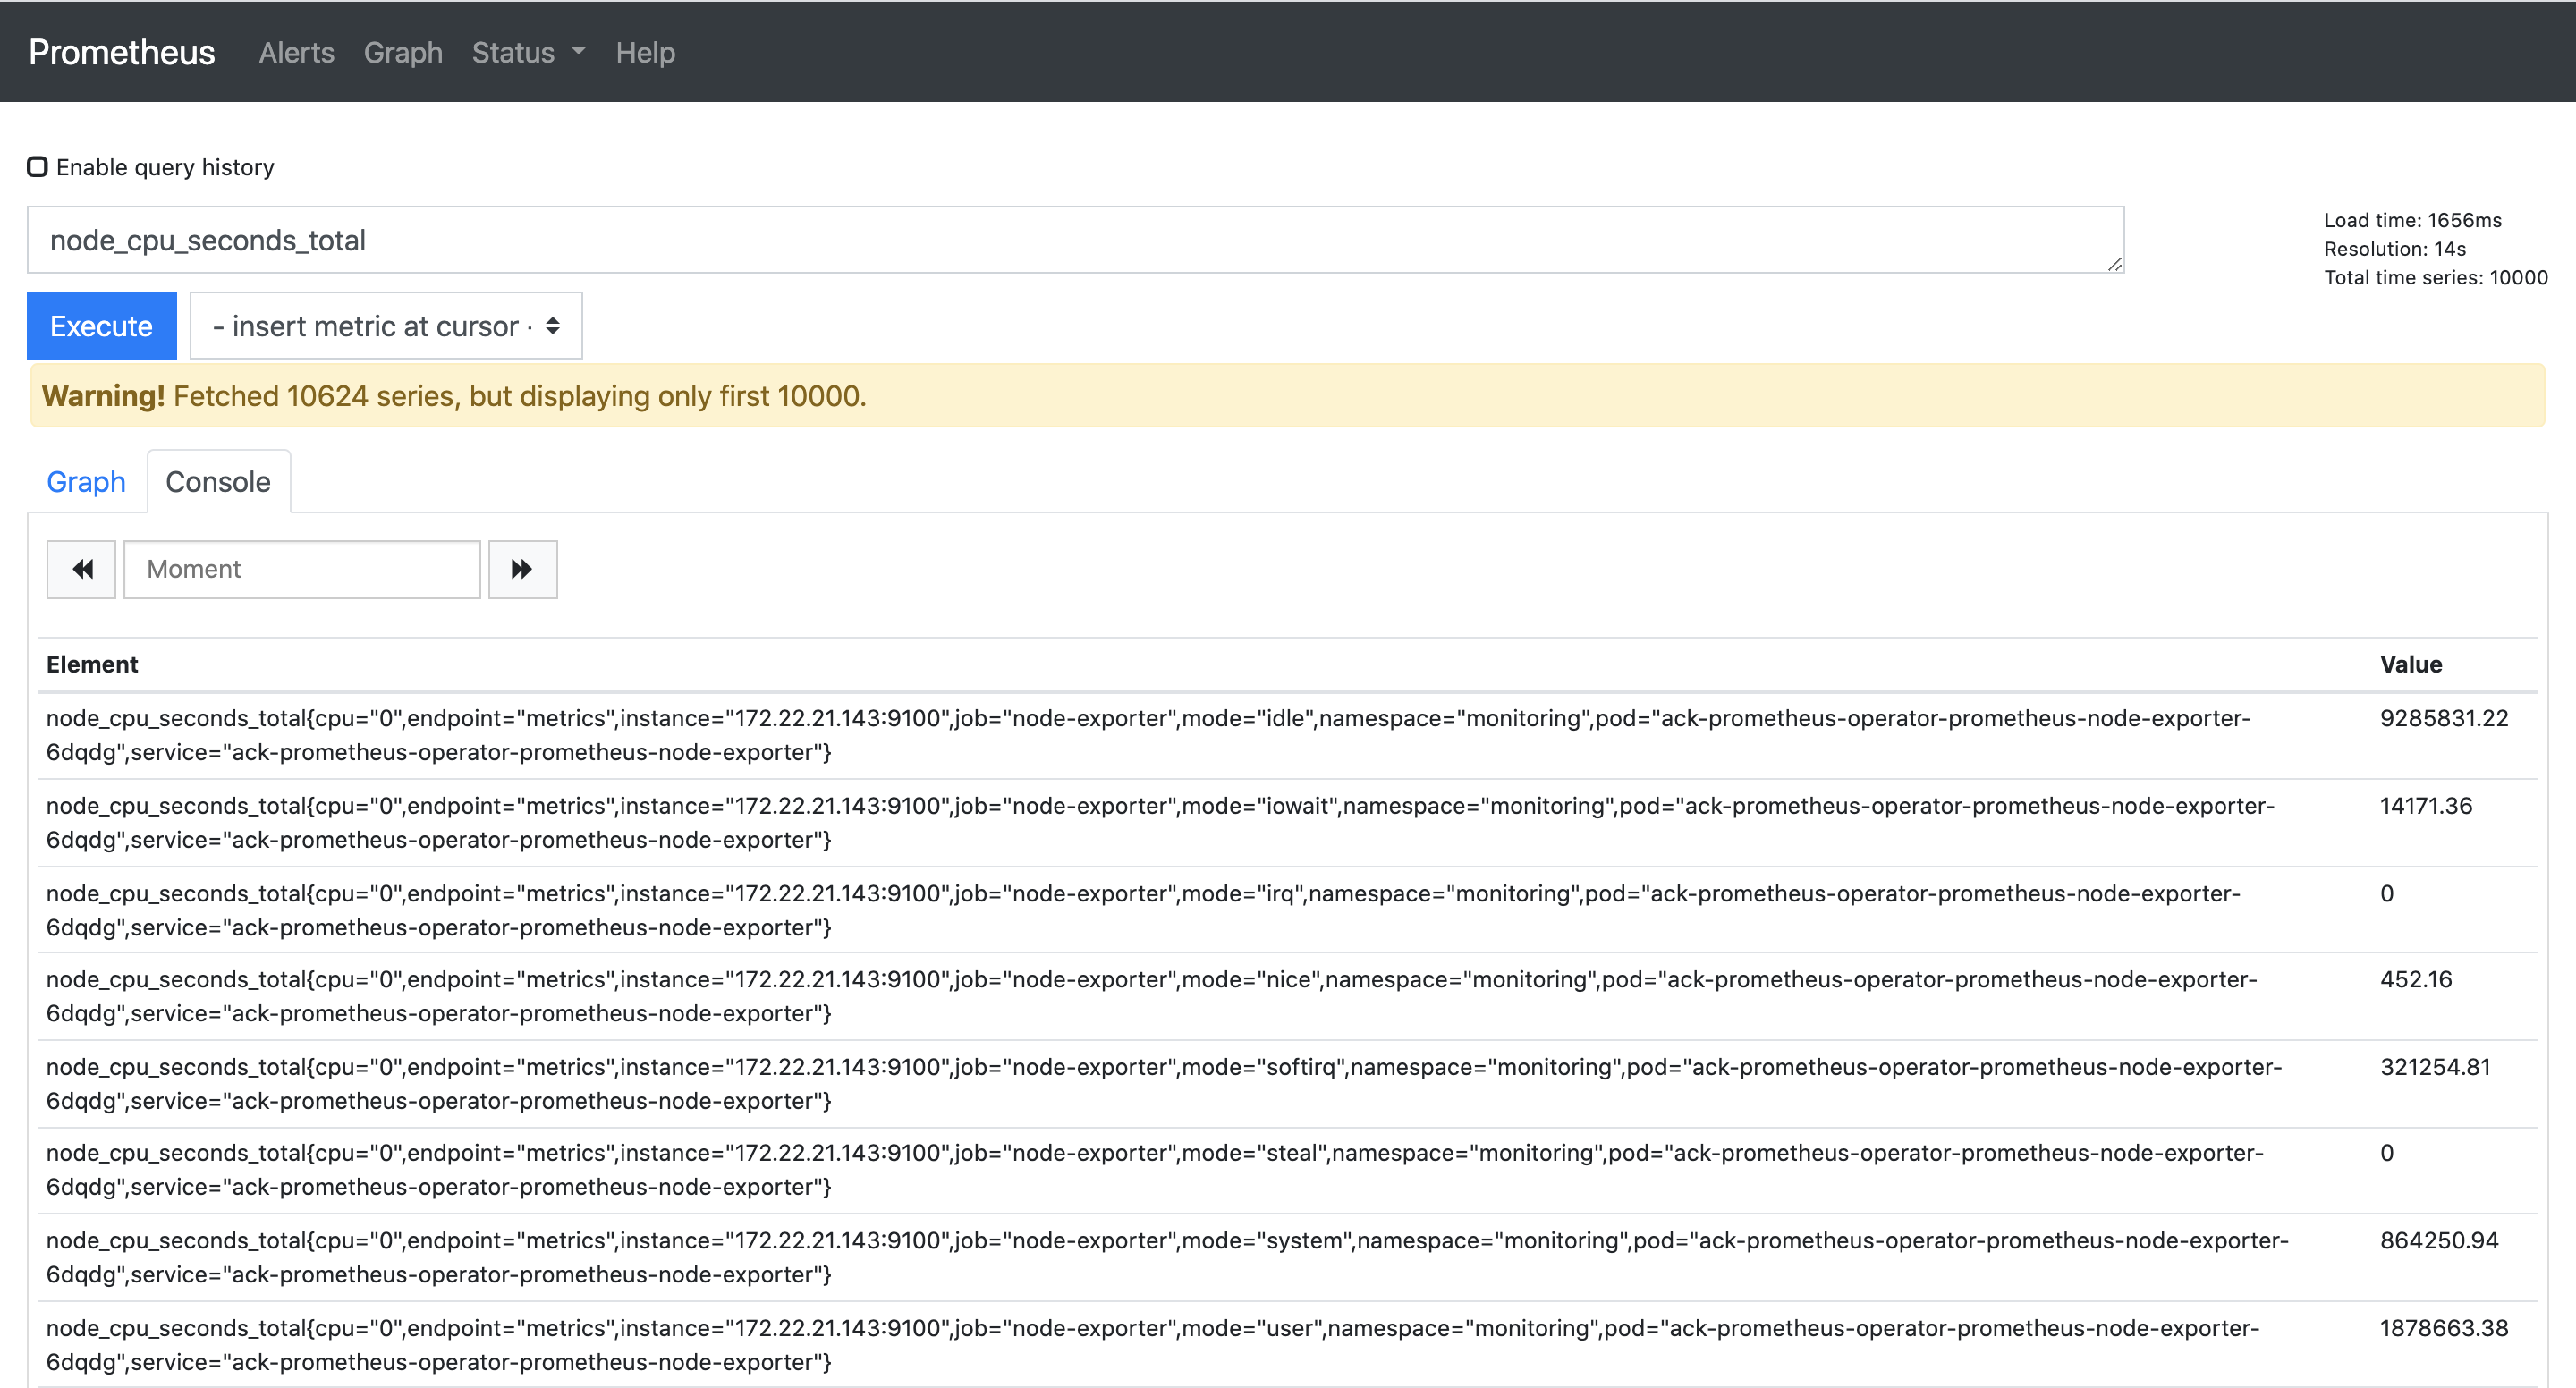
在 Prometheus 中,node_exporter 会抓取 node_cpu_seconds_total 指标,该指标会列出每种 CPU 模式占用的总共时长,单位是秒,如:
由于机器较多,并且每个机器的上有多个 CPU,所以先看一台机器上一个 CPU 的数据,使用 CPU 和 instance 标签过滤下:
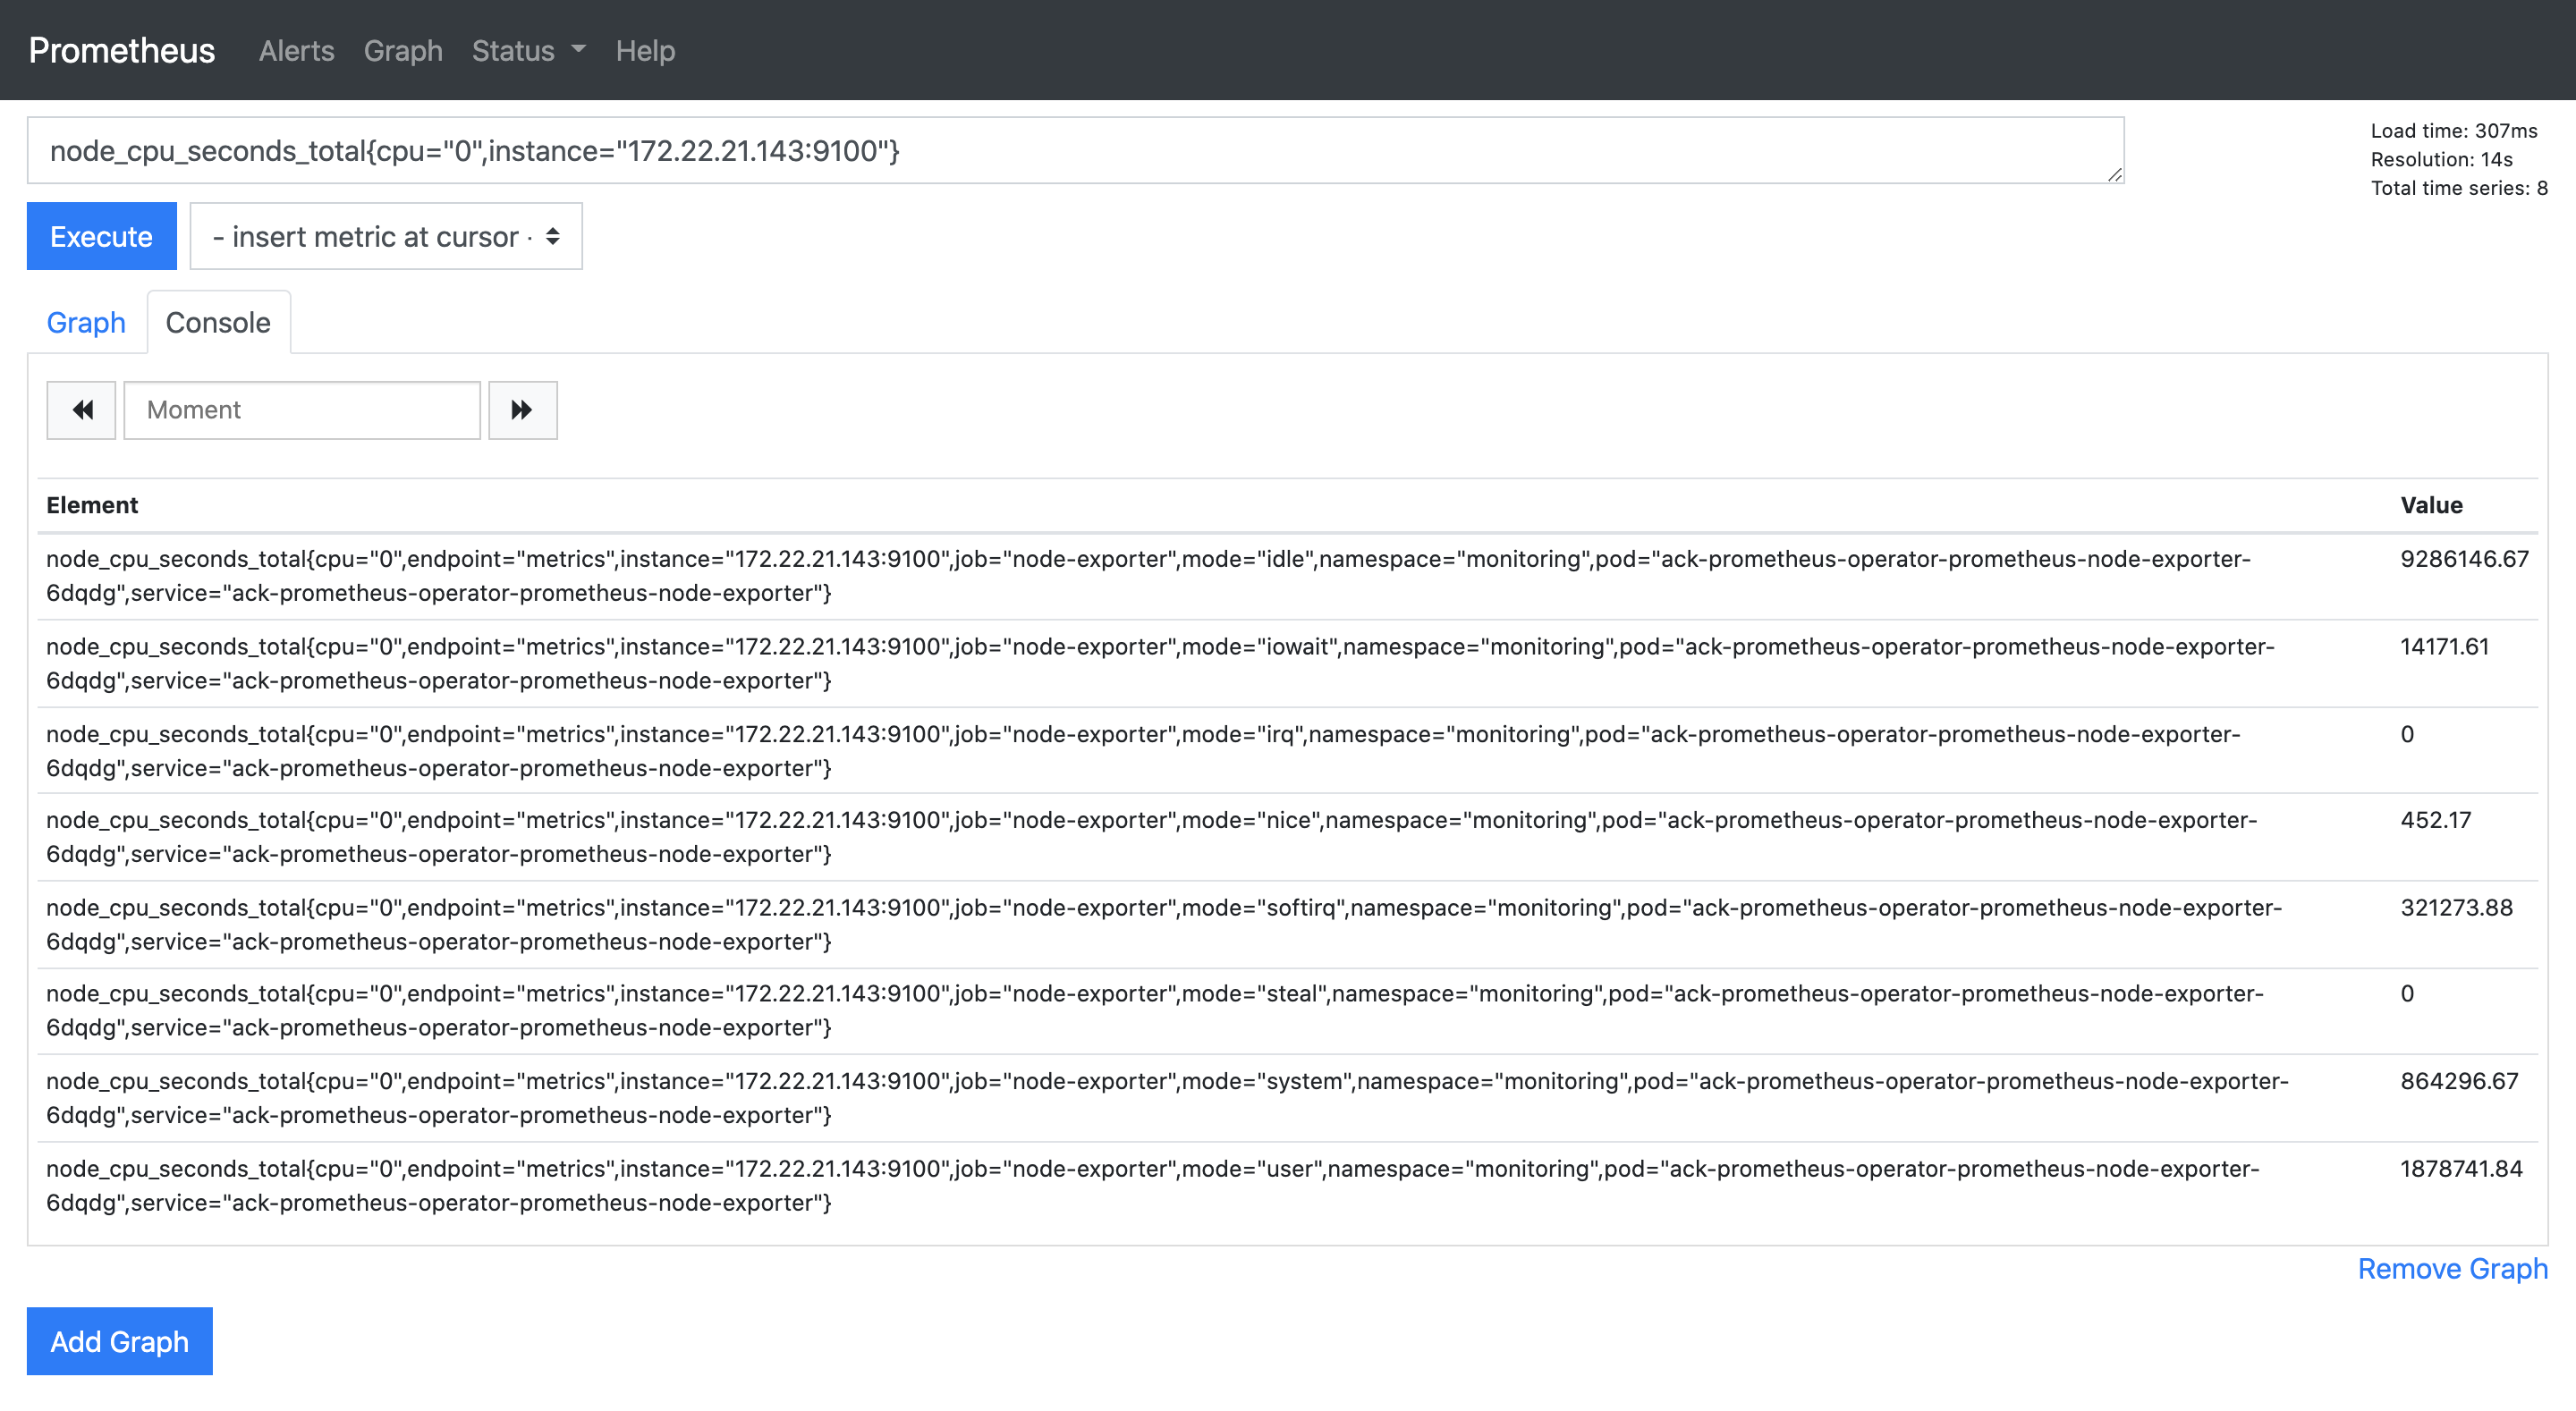
可以看到,正好有八行记录,label 中的 mode 分别对应八种 CPU 模式,value 是自机器开机以来每种模式占用的总时长。根据上图第一个序列得知,IP 为 172.22.21.143 的机器的第 0 个 CPU idle 状态时长为:9286146.67s。

计算 CPU 使用率

到这里我们能够通过 PromQL 拿到一个 CPU 的每种模式的使用时长,而我们想要的是 CPU 使用率。

那么如何定义 CPU 的使用率?CPU 使用率 = 1 - CPU 空闲率,即:

CPU 使用率 = (1 - 所有空闲状态 CPU 时间总和 / 所有状态 CPU 时间总和) * 100%

为了简单,先计算一个机器上一个 CPU 在 2 分钟内处于空闲状态的时长,即:

increase(node_cpu_seconds_total{cpu="0",instance="172.22.21.143:9100",mode="idle"}[2m])
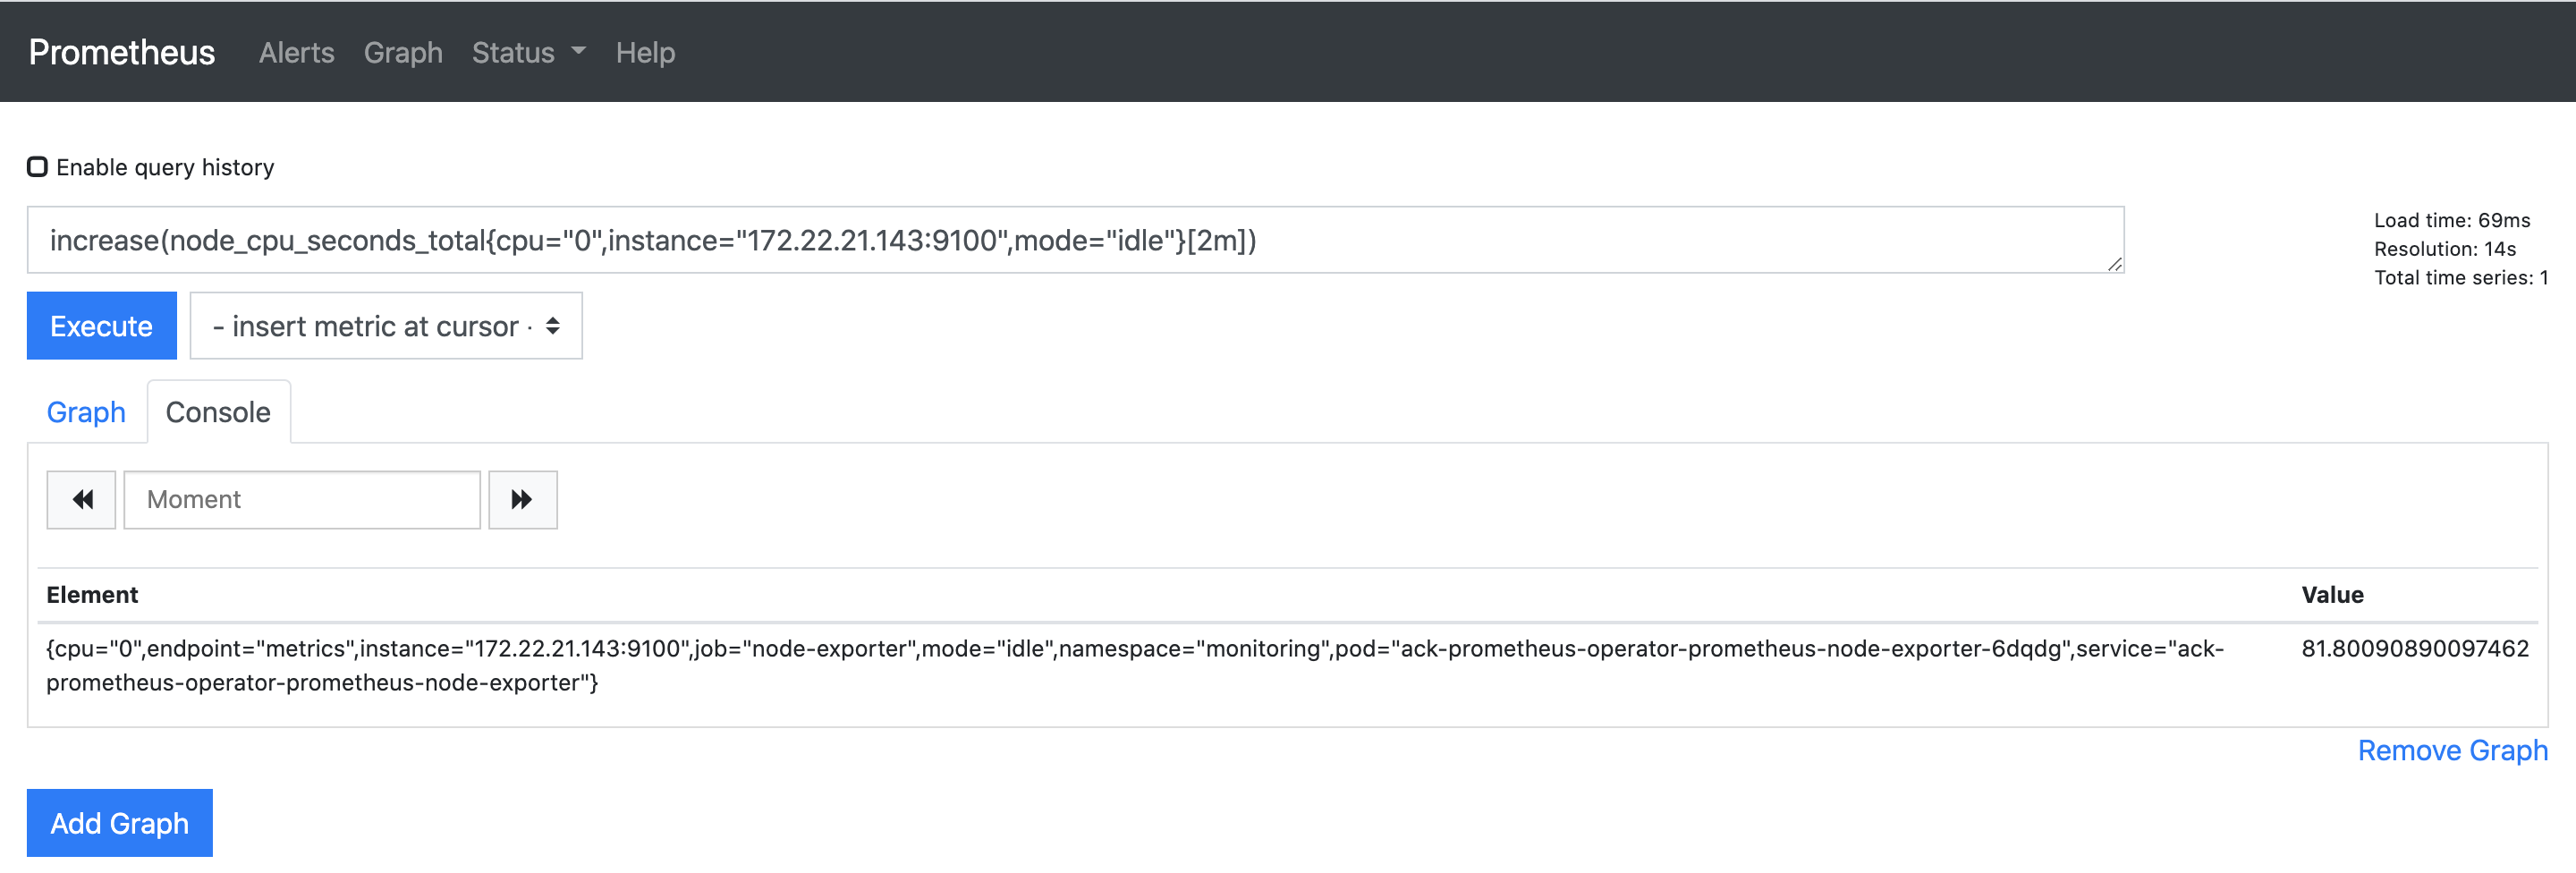
这里用到了 promQL 的 increase 函数,该函数是计算一个时间范围内,Counter 指标类型的增量值。这里使用 increase 函数,计算出该 CPU 在 2 分钟内,空闲状态的时长,即 81.80s。

那么根据公式可得该 CPU 使用率:

1 - increase(node_cpu_seconds_total{cpu="0",instance="172.22.21.143:9100",mode="idle"}[2m]) / 120
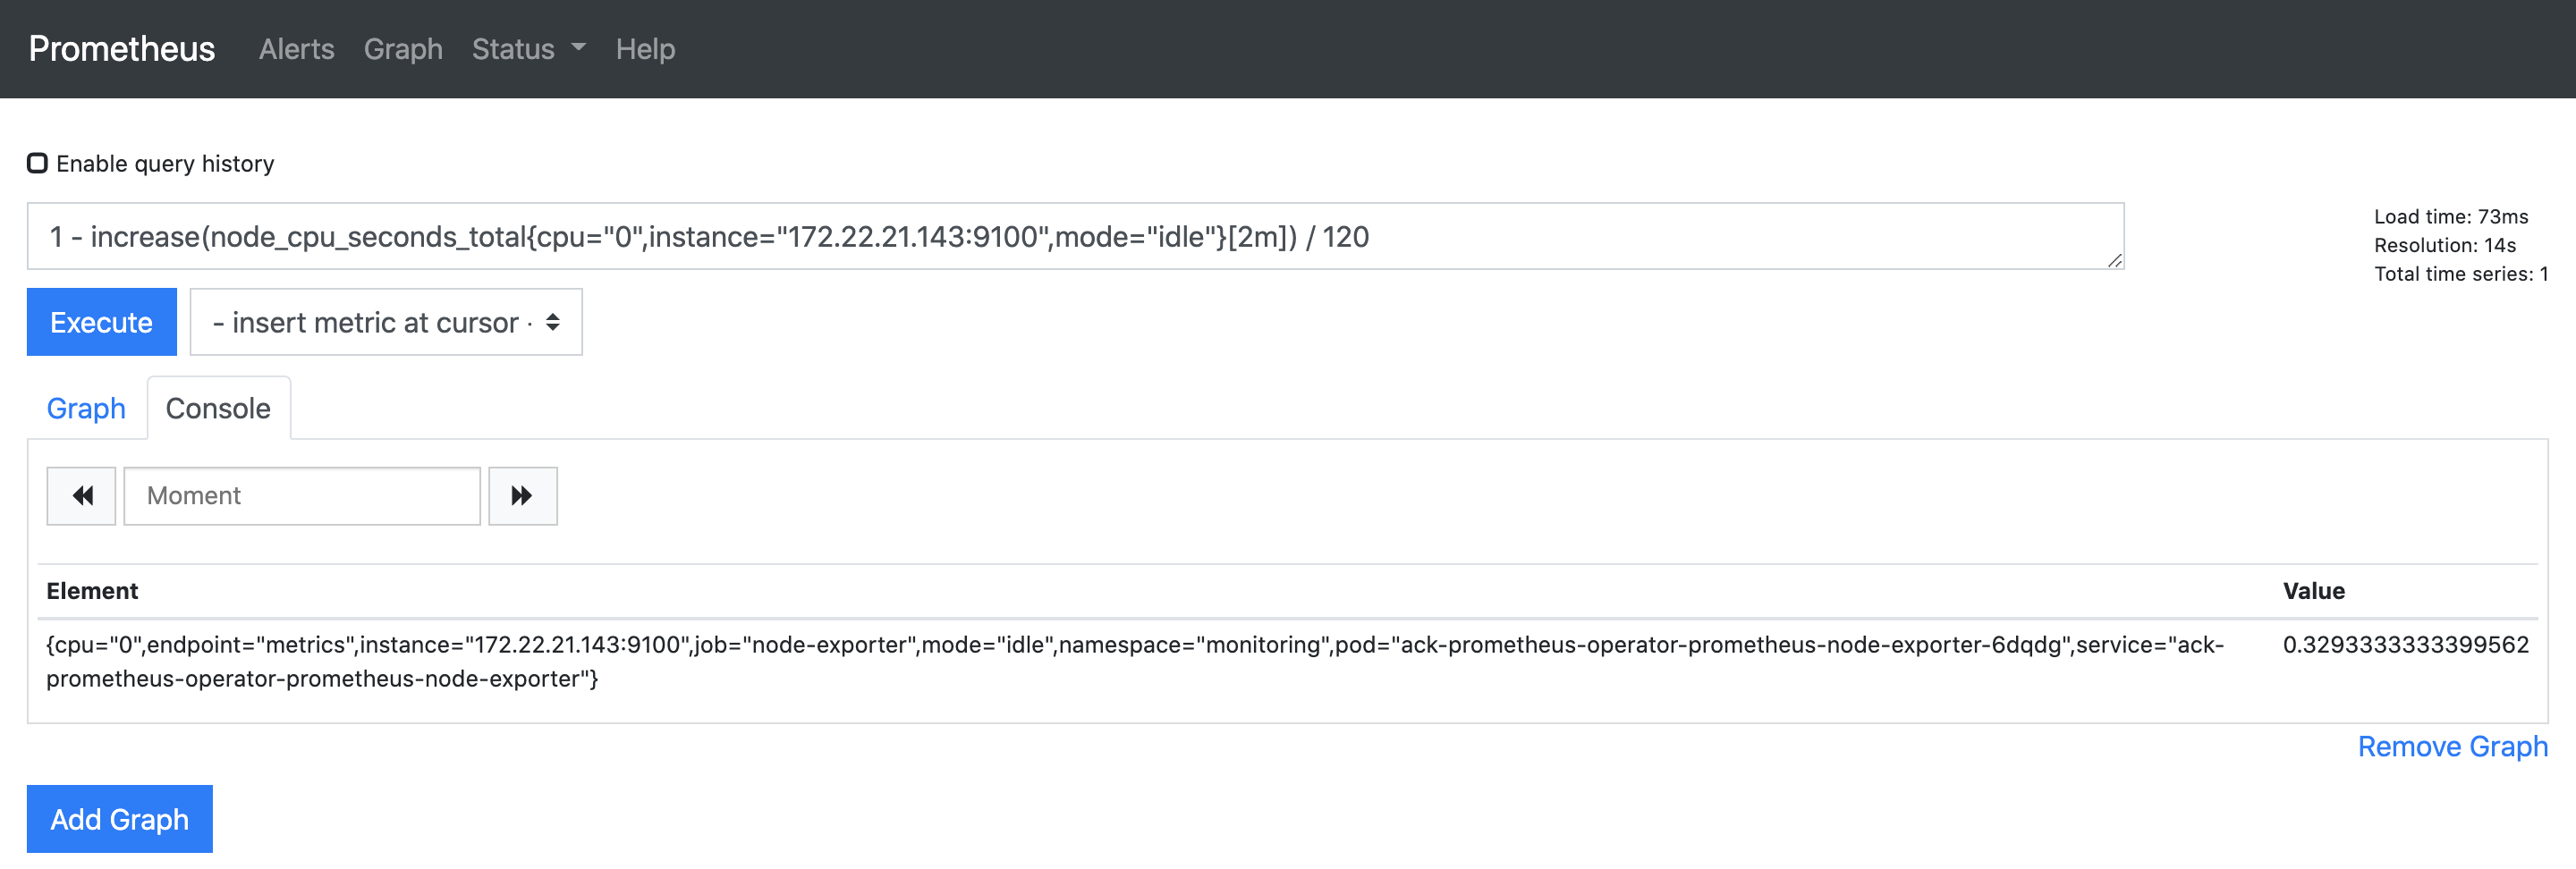
使用率为:32.93%。

或者使用:

1 - sum(increase(node_cpu_seconds_total{cpu="0",instance="172.22.21.143:9100",mode="idle"}[2m])) / sum(increase(node_cpu_seconds_total{cpu="0",instance="172.22.21.143:9100"}[2m]))

能达到同样的目的。该查询的分母:

sum(increase(node_cpu_seconds_total{cpu="0",instance="172.22.21.143:9100"}[2m]))

其实就是 120 秒。

其实不用这么麻烦,promQL 提供了 rateirate 函数,用来计算变化率:

1 - rate(node_cpu_seconds_total{cpu="0",instance="172.22.21.143:9100",mode="idle"}[2m])
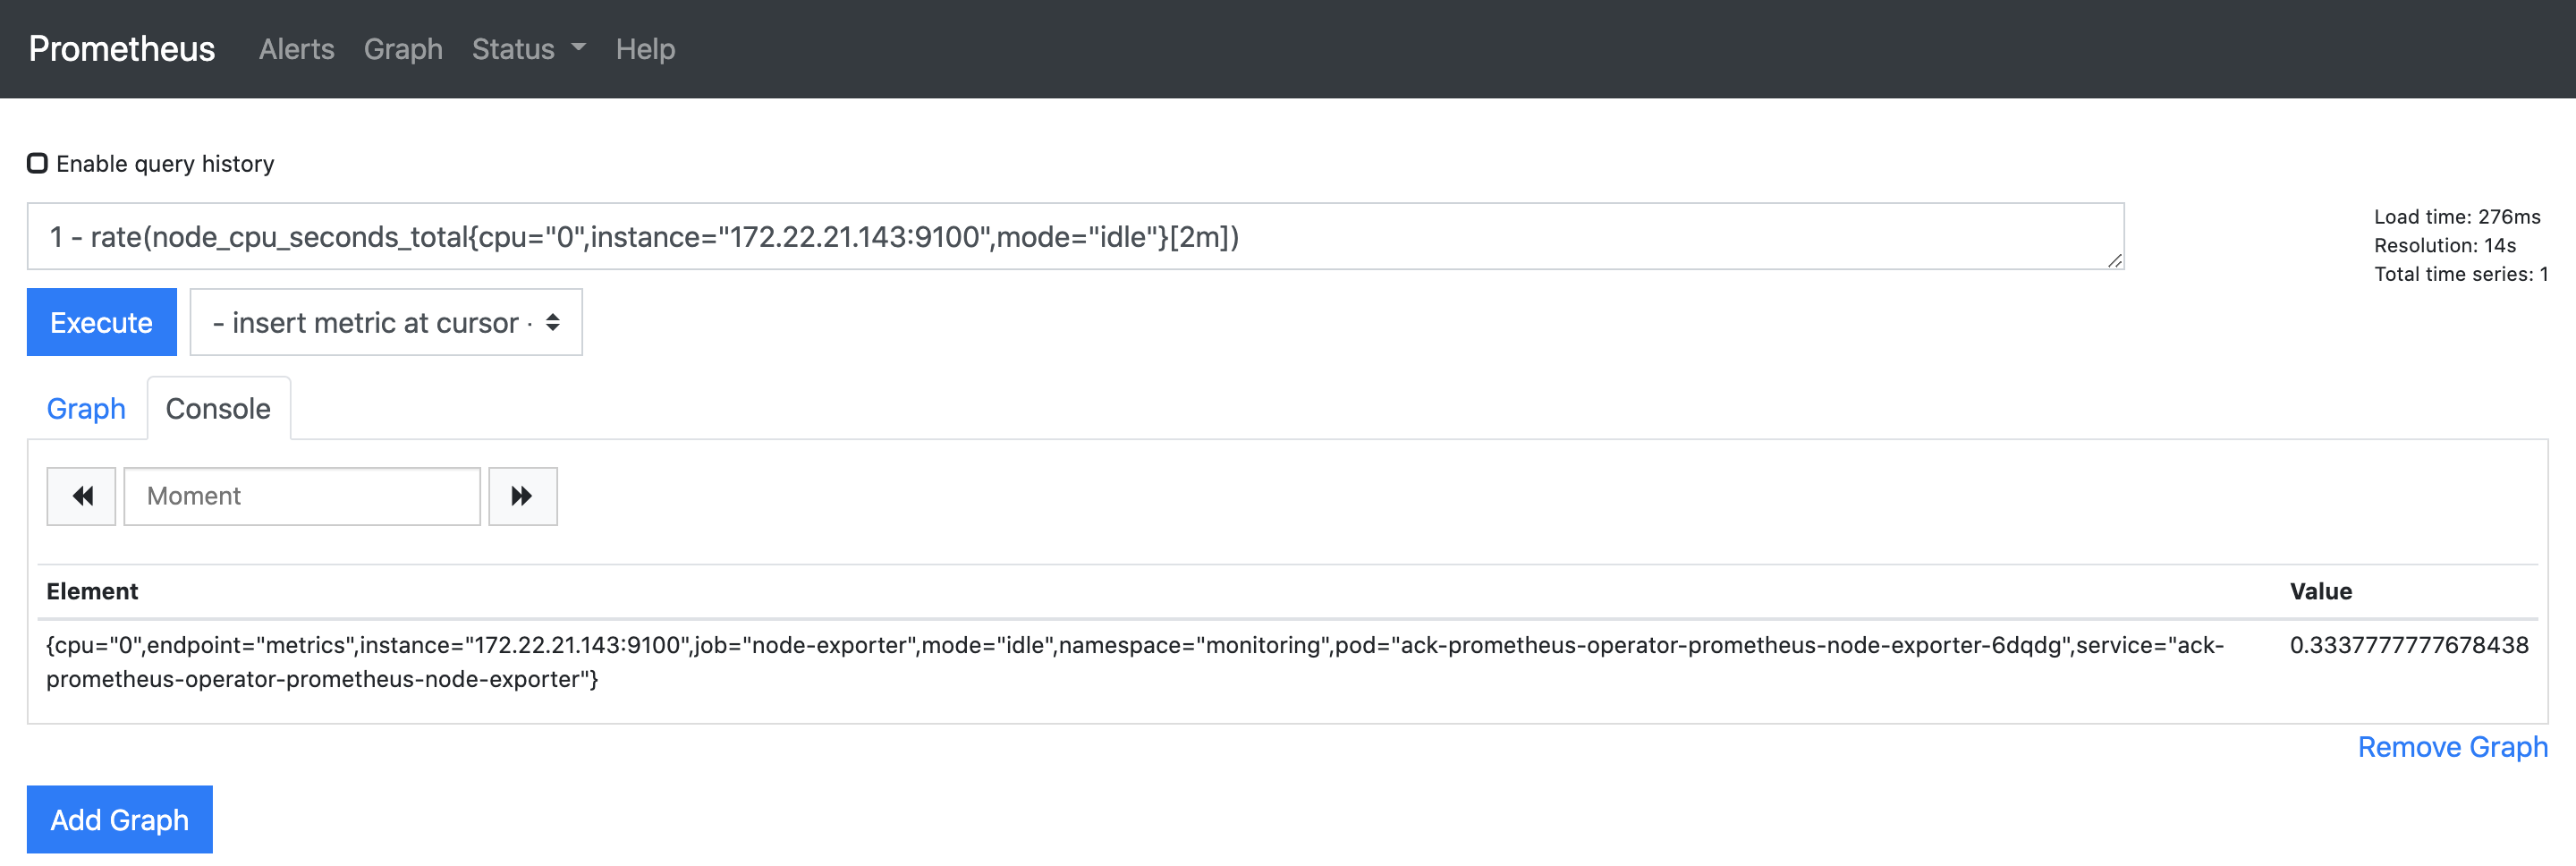
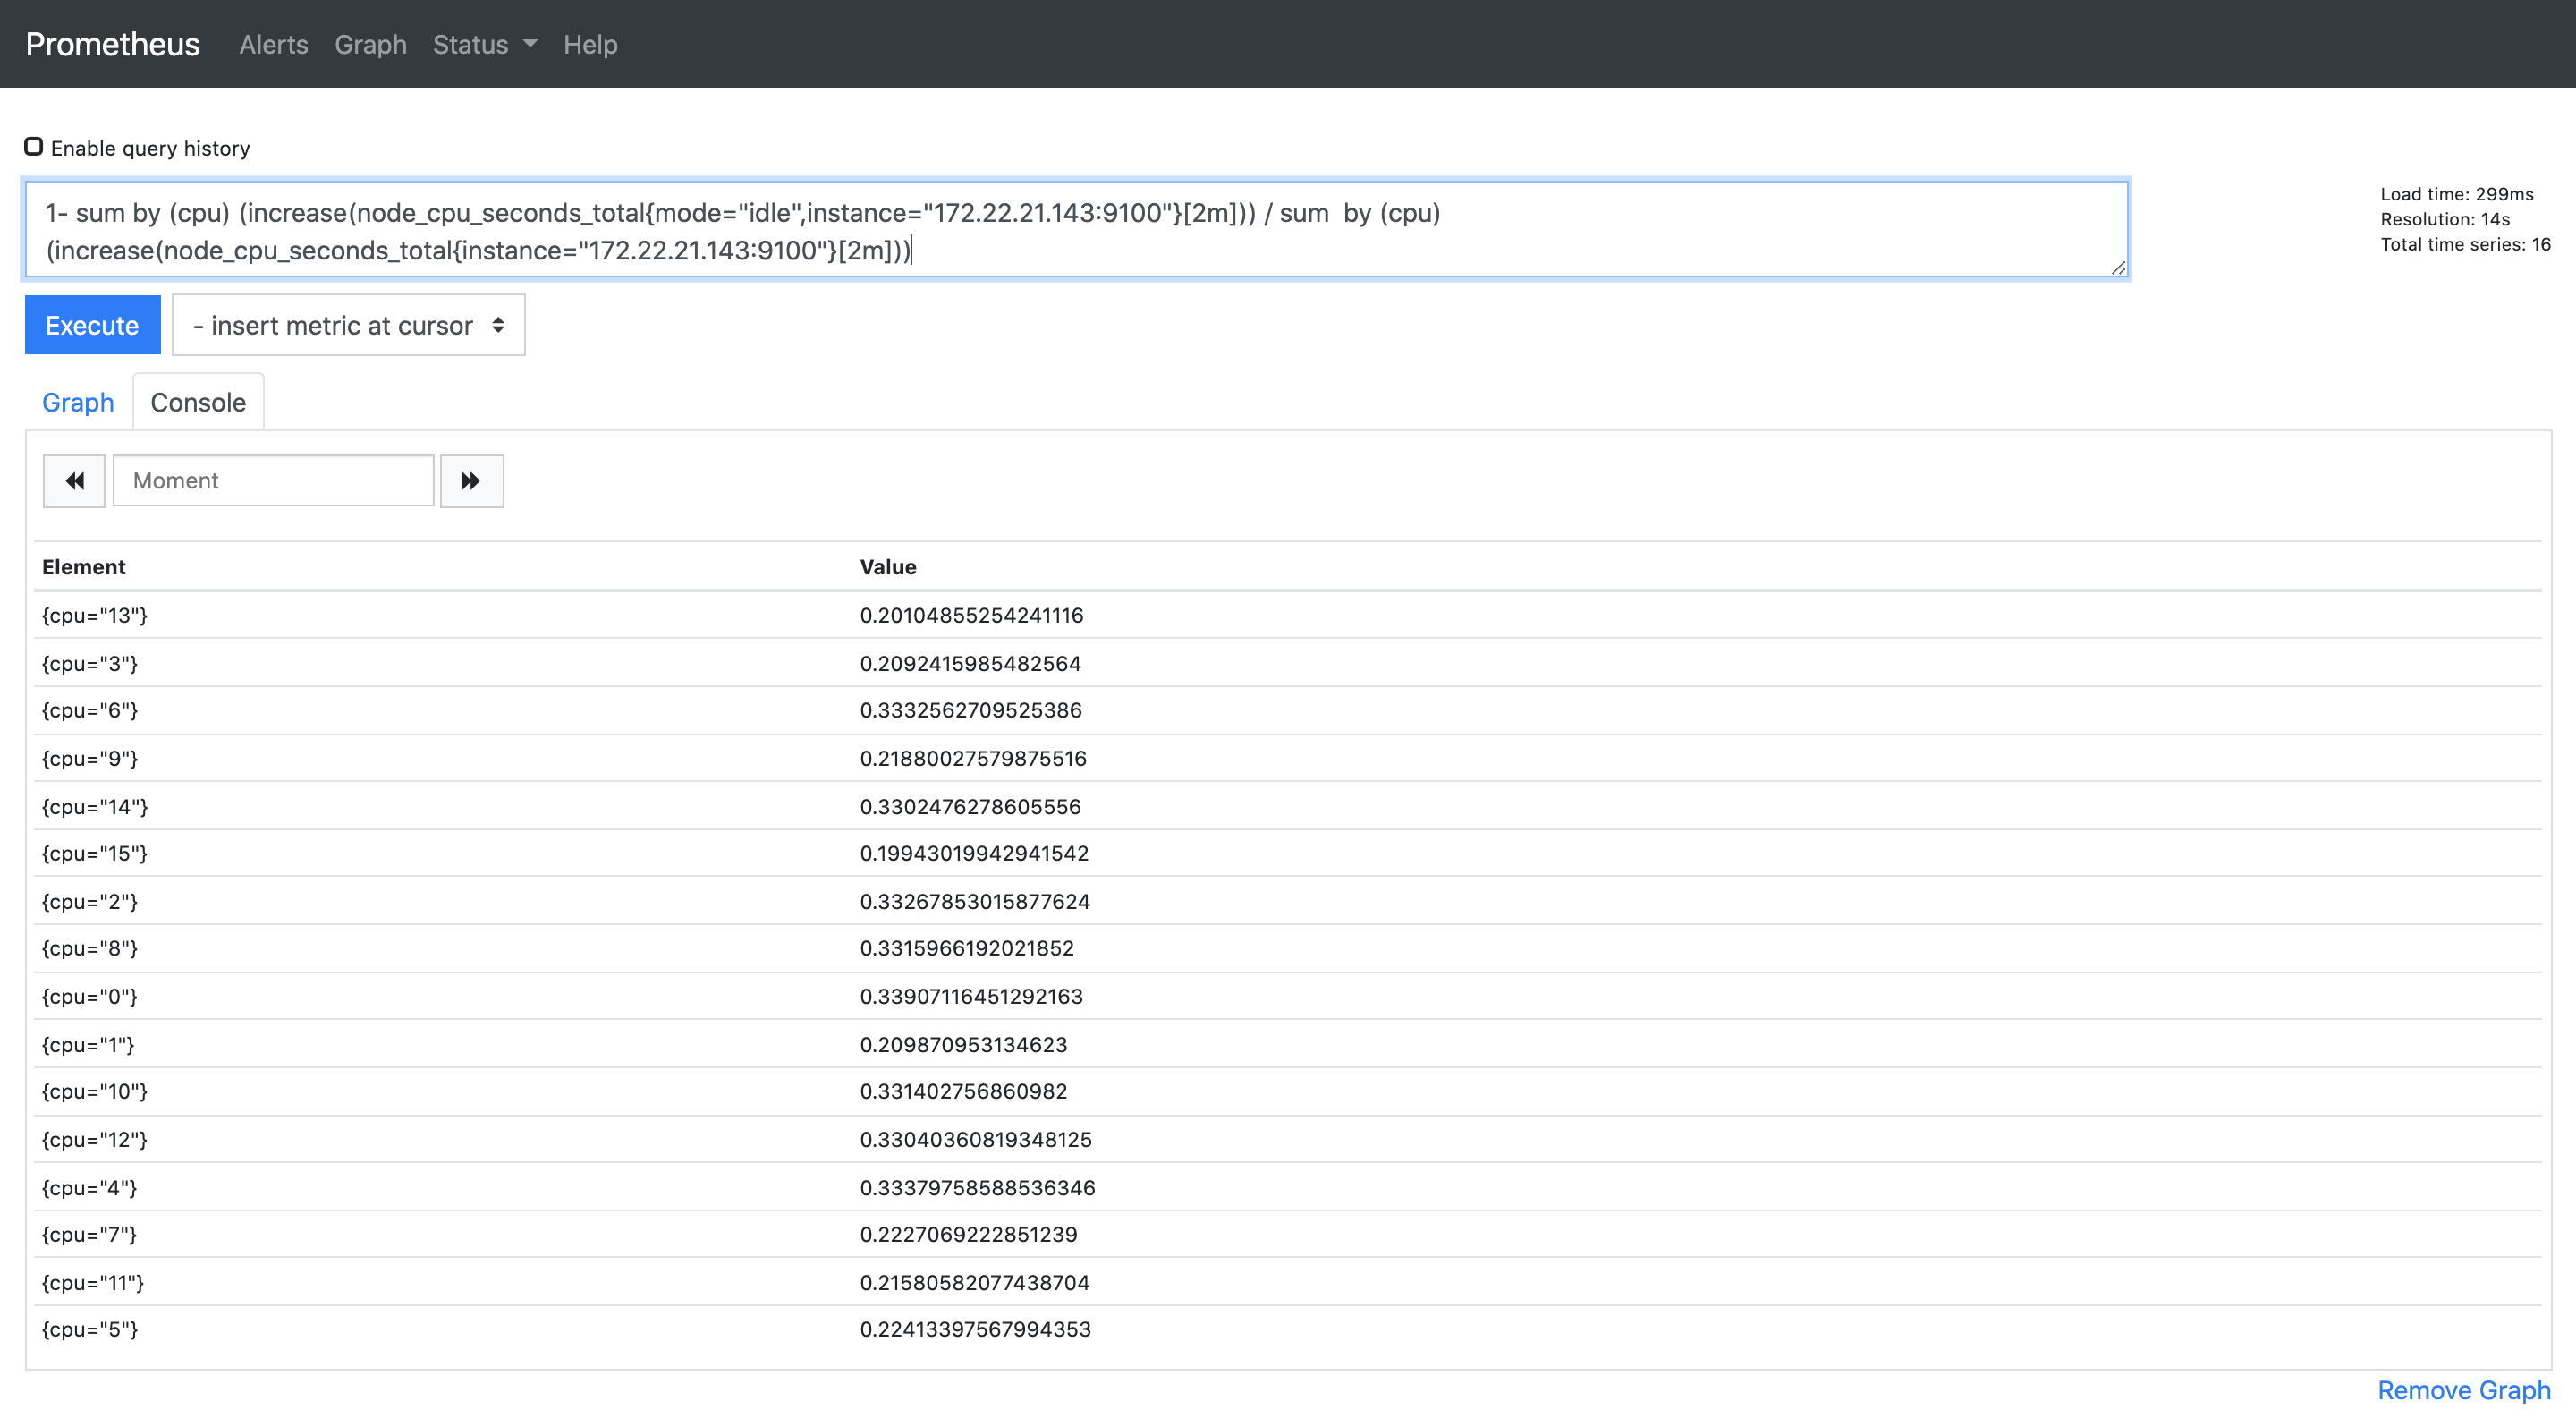
分别查看一个机器上每个 CPU 使用率,即:

1 - sum by (cpu) (increase(node_cpu_seconds_total{mode="idle",instance="172.22.21.143:9100"}[2m])) / sum by (cpu) (increase(node_cpu_seconds_total{instance="172.22.21.143:9100"}[2m]))
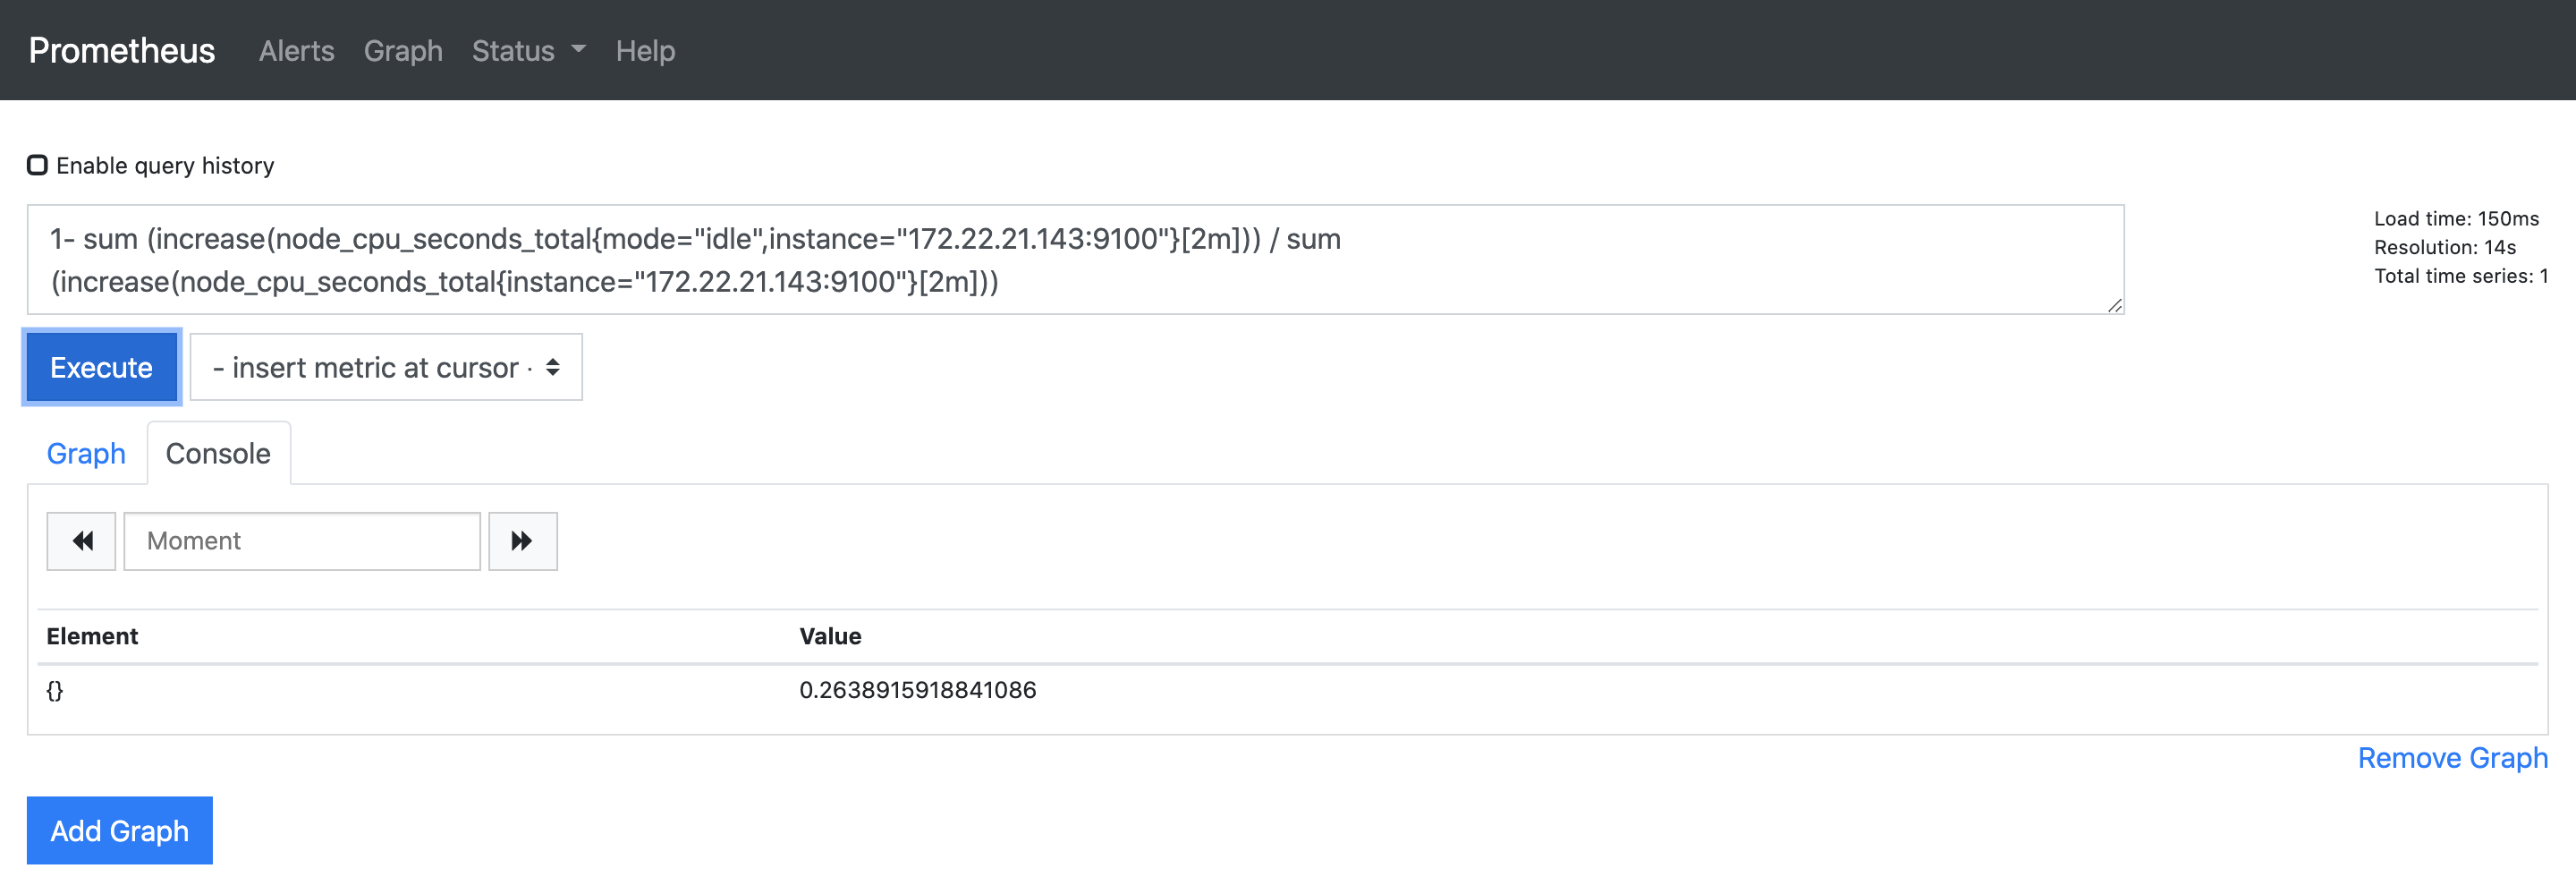
查看一个机器上所有 CPU 的使用率,即:

1 - sum (increase(node_cpu_seconds_total{mode="idle",instance="172.22.21.143:9100"}[2m])) / sum (increase(node_cpu_seconds_total{instance="172.22.21.143:9100"}[2m]))
查看所有机器的 CPU 的使用率,即:

1 - sum by (instance)(increase(node_cpu_seconds_total{mode="idle"}[2m])) / sum by (instance)(increase(node_cpu_seconds_total[2m]))
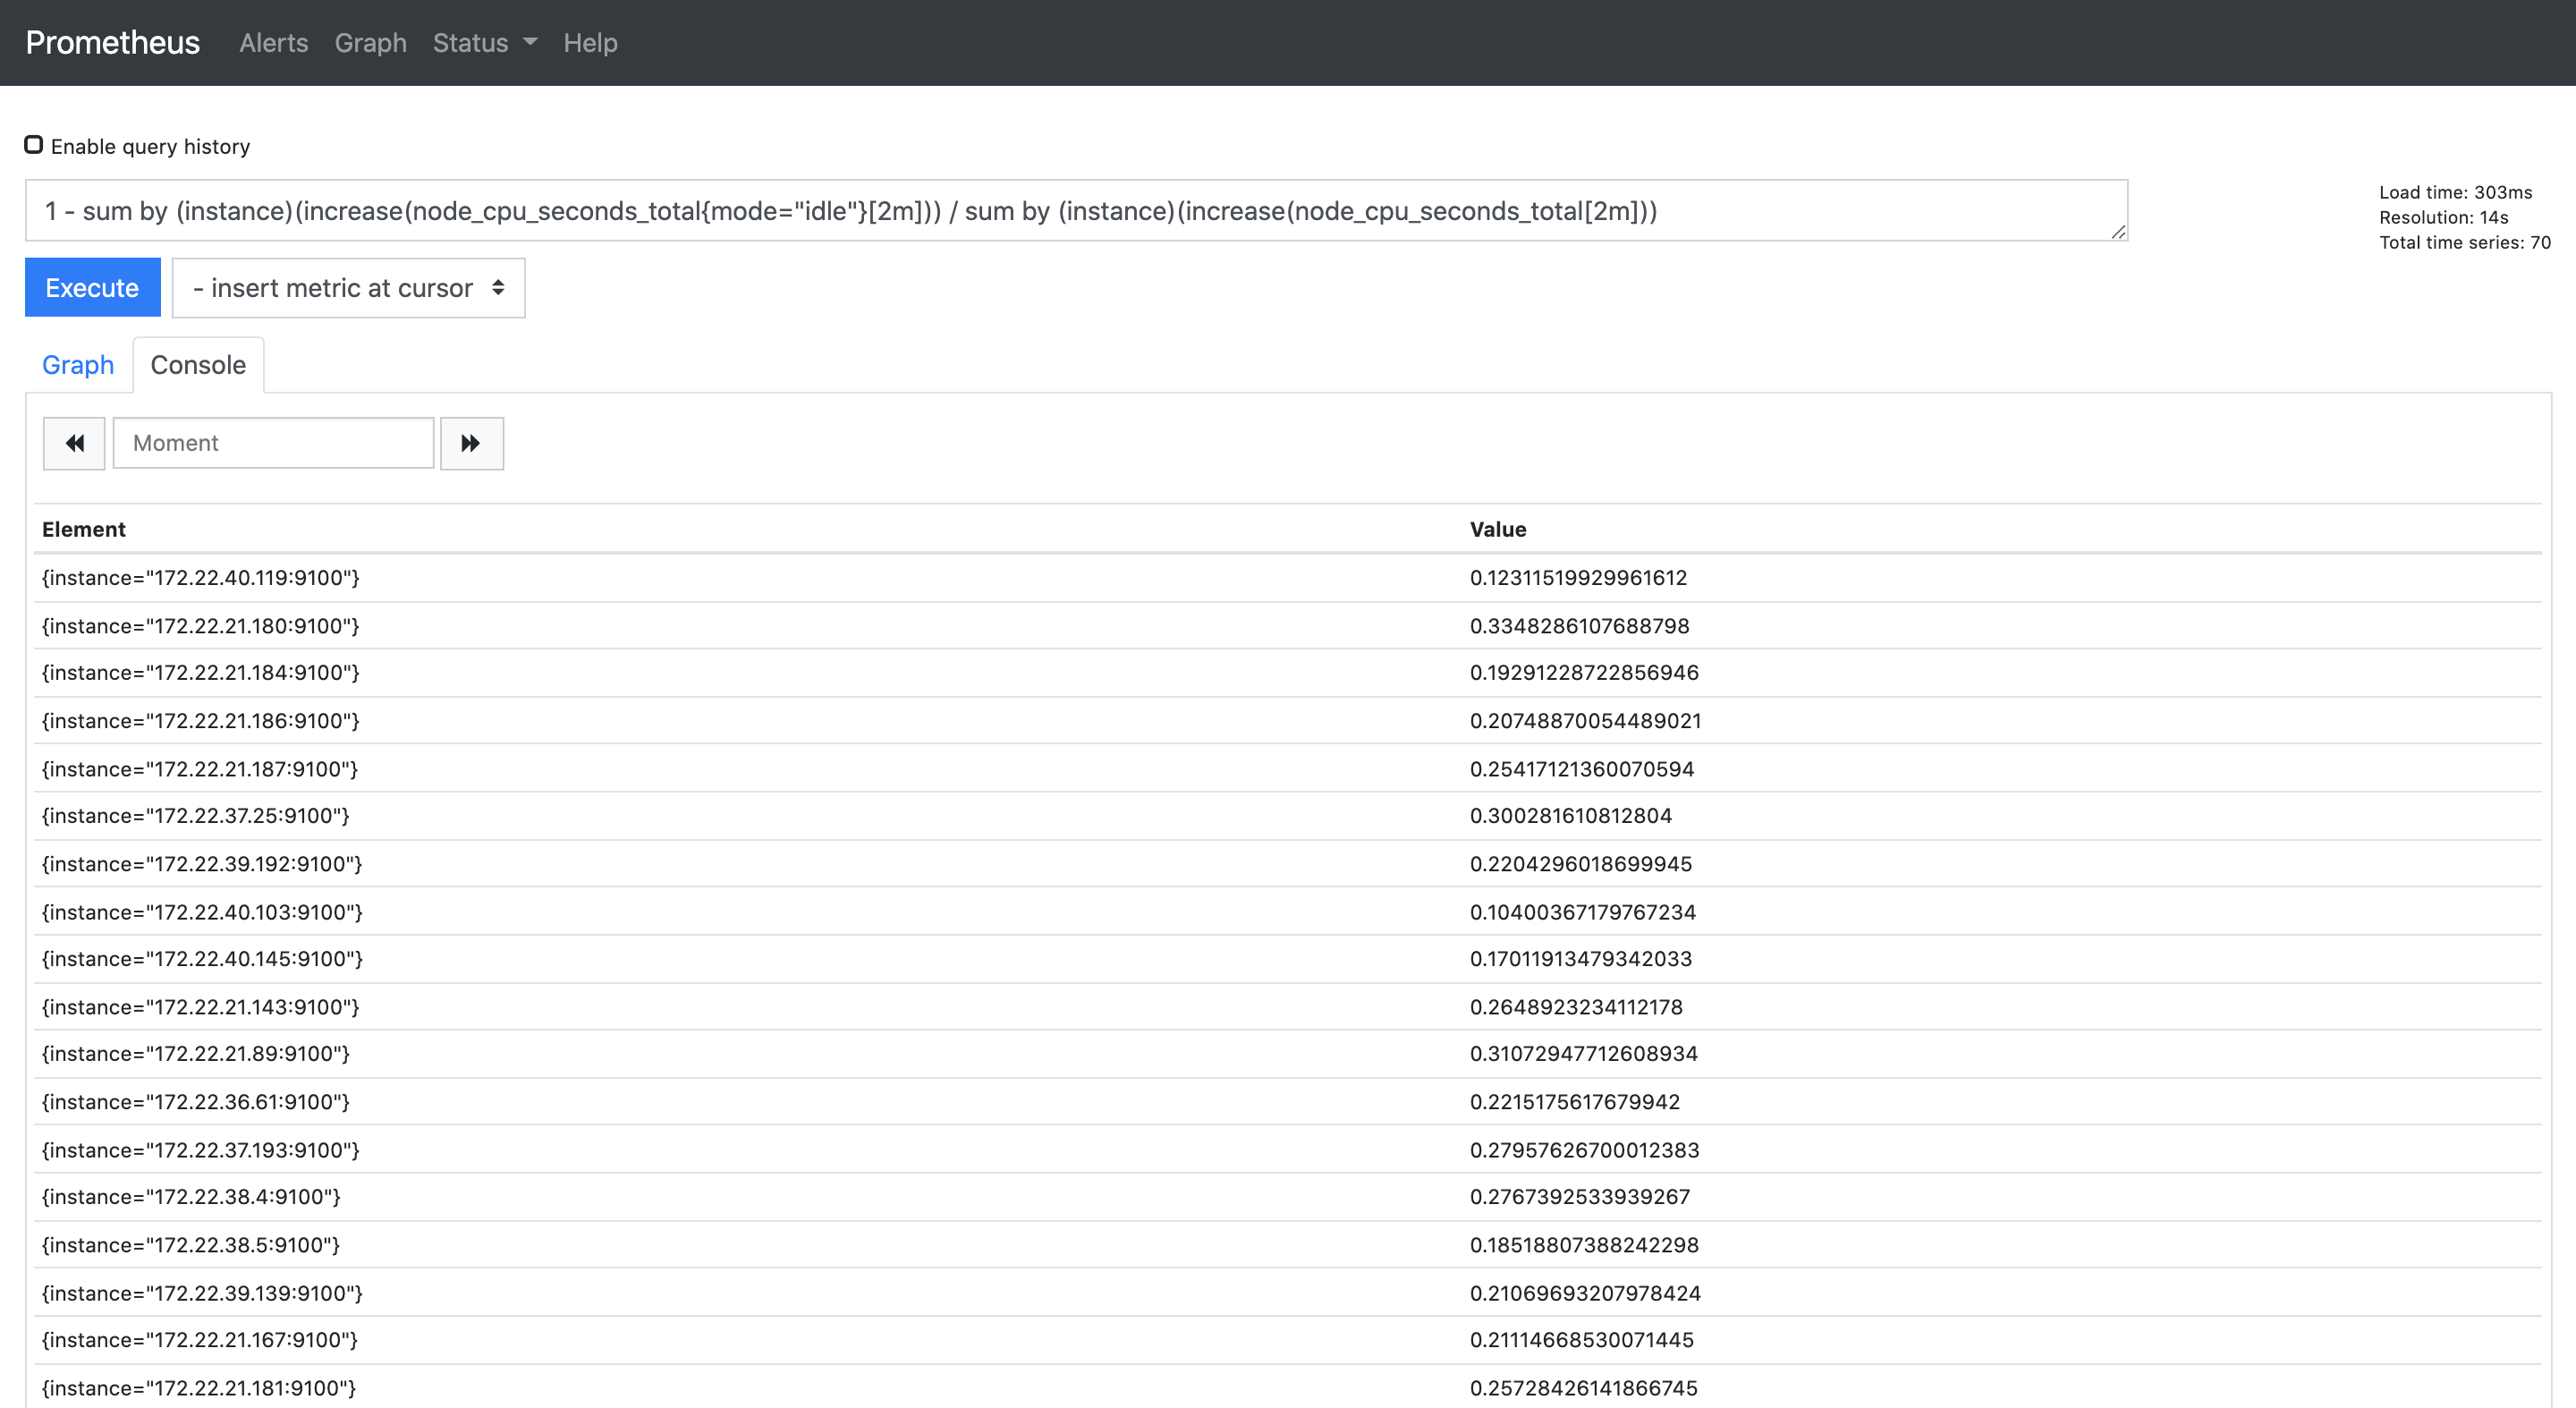
也可以使用:

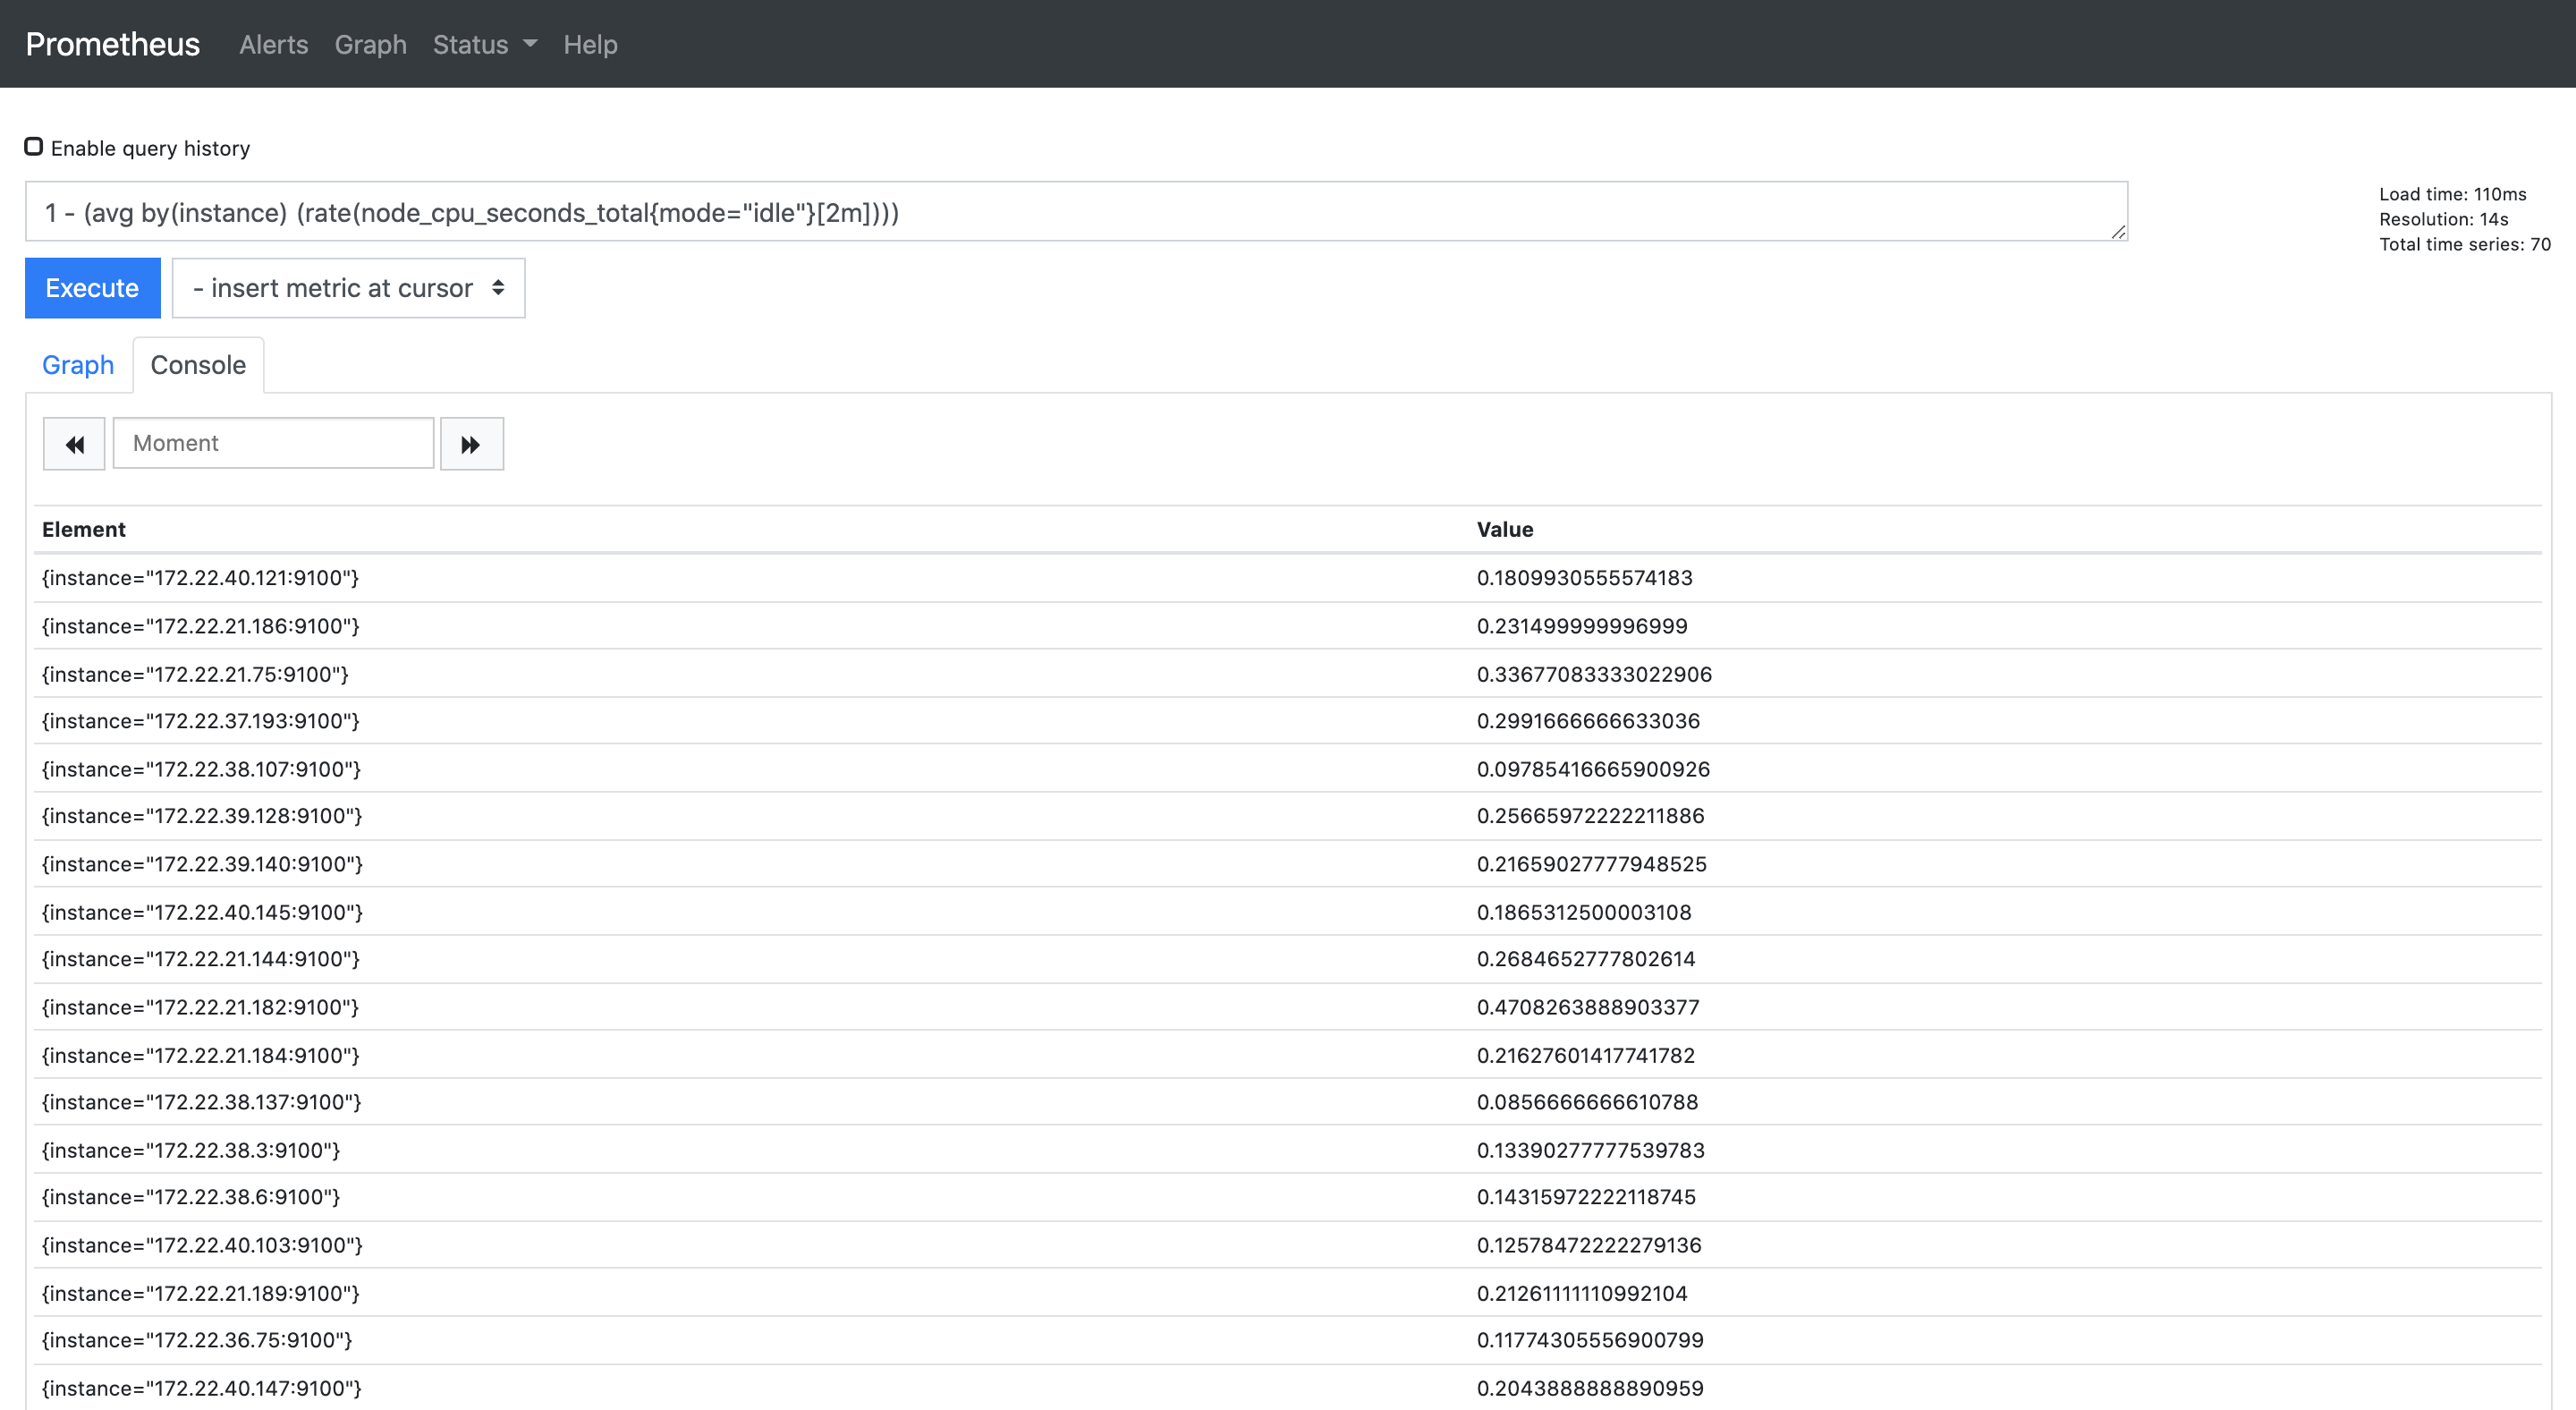
1 - (avg by(instance) (rate(node_cpu_seconds_total{mode="idle"}[2m])))

查看所有机器的 CPU 使用率: