GDP数据是衡量地区经济发展水平的重要指标,是各项研究中常用的数据!excel格式的GDP数据比较常见,而栅格格式的GDP数据却不大好找,而栅格格式的GDP数据精度更高,更适合于空间分析!
今天我们给大家带来一个栅格格式的GDP数据! 该数据是2016年赵乃卓教授等人在期刊《GIScience & Remote Sensing 》发表的文章《Forecasting China’s GDP at the pixel level using nighttime lightstime series and population images》发布的数据!作者利用1km×1km DMSP-OLS的NLTS图像产品夜间灯光图像(2000-2013年),结合网格化的Landscan人口数据集(2008年),将2000-2013年每个省份的国内生产总值(GDP)在空间上分解为像素级别。后对已分解的GDP时间序列数据进行Holt-Winters平滑,来预测2014-2020年1km×1km网格面积上的GDP变化。数据年份为2014——2020年,栅格尺寸为1km*1km范围为全国范围!
为了方便大家使用该数据,我们在全国范围的基础上,又分解为了各个省份的数据,各个城市的数据!以下为数据的详细介绍:

01 数据预览
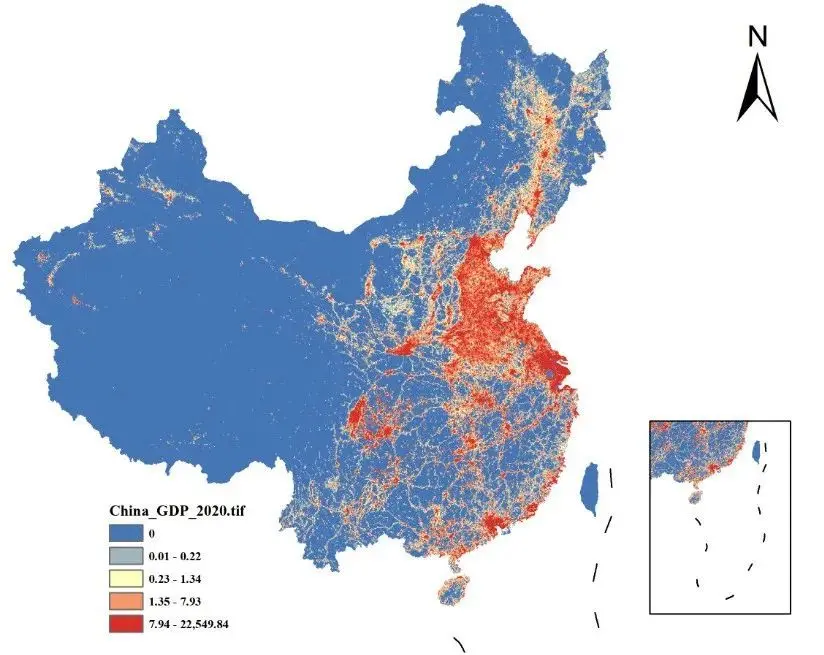
1.全国2014-2020年的GDP
我们以2020年的数据为例来预览一下:
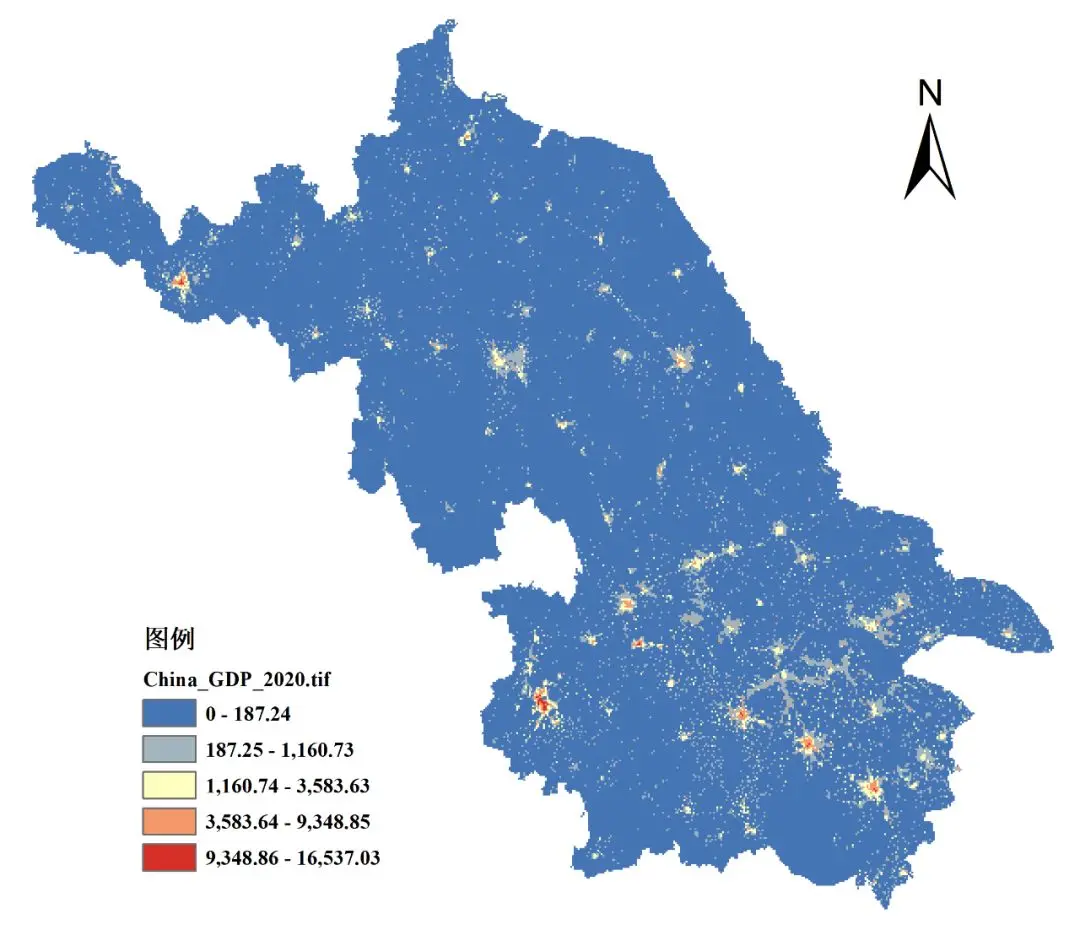
2.各省2014-2020年GDP
我们以2020年江苏省的数据为例来预览一下:
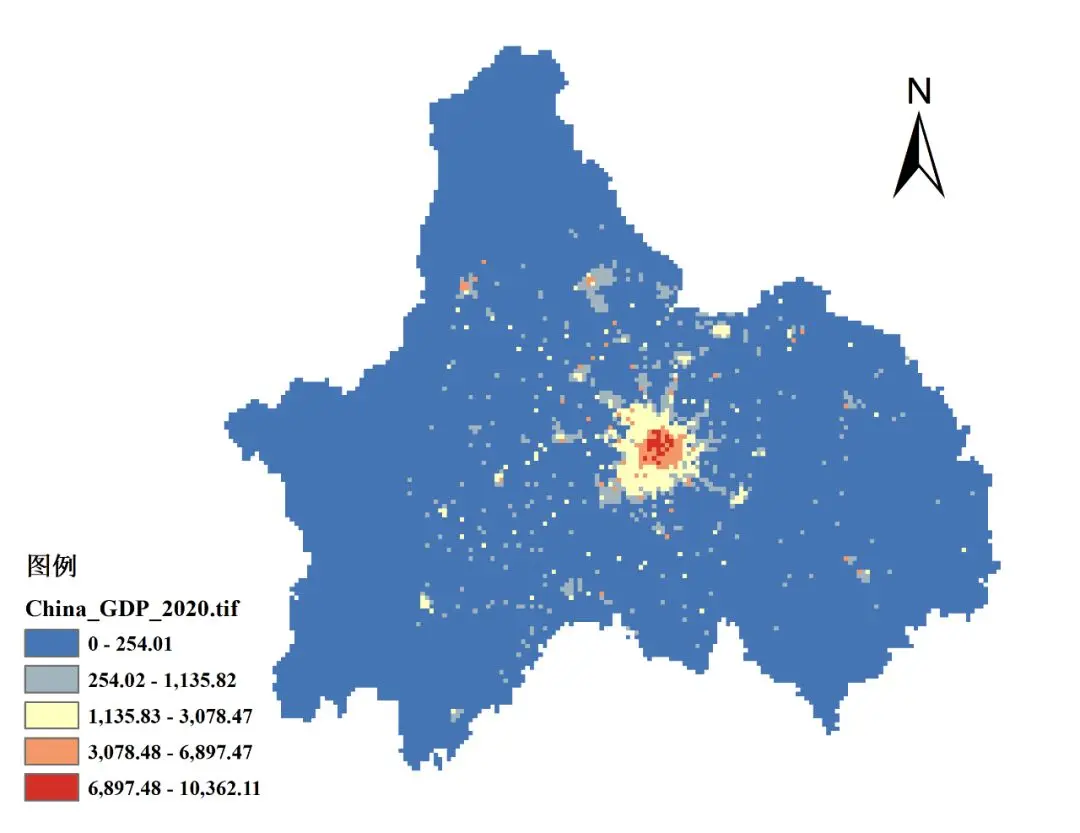
3.各市2014-2020年的 GDP
我们以2020年成都市的数据为例来预览一下:
02 数据详情
数据来源:
https://github.com/thestarlab/ChinaGDP
数据分辨率:1km
数据格式:tif
数据坐标系:WGS_1984_Albers Conical Equal Area
数据引用:如需使用数据请参照作者在GitHub的README文件中所写的引用格式标明数据来源
数据论文及链接:
Zhao,Liu,Cao,Samson,Zhang. Forecasting China’s GDP at the pixel level using nighttime lights time series and population images.
https://www.tandfonline.com/doi/pdf/10.1080/15481603.2016.1276705
03 数据获取

作者:立方数据学院 https://www.bilibili.com/read/cv20179441/ 出处:bilibili
此内容由惯性聚合(RSS阅读器)自动聚合整理,仅供阅读参考。 原文来自 — 版权归原作者所有。