





First brought in as a concept more than three decades ago, SIP, or systematic investment plan, today has virtually become the comfort food Indian investors binge monthly. In April 2026 alone, more than ₹31,000 crore flowed into mutual funds through SIPs across over 10 crore accounts. For full FY26 (April 2025 to March 2026), SIP contributions (gross) stood at nearly ₹3.5 lakh crore — over eight times the level seen a decade ago. That tsunami of mostly retail investor money has helped Indian markets absorb the massive ₹1.8-lakh crore sale of equities by foreign portfolio investors last fiscal.
None of this makes the SIP faith irrational. Discipline over two decades has indeed produced many rags-to-riches stories. But the journey and the outcome has not been equally rewarding for everyone.
That unevenness is not merely theoretical. Over one-third of the two-year SIPs in mutual fund schemes across market-cap categories are currently showing losses. SIP discipline remains useful, but it is not a 100 per cent autopilot route to wealth. Returns depend not only on staying invested, but also on where one invests, when the SIP begins and how markets behave along the way. Time can heal many market wounds, but it cannot be blindly assumed to rescue every poor outcome.
SIP may have become India’s default investing habit. But, a mere fund SIP does not create returns; it simply distributes entry points for your monthly investments. What SIP return investors finally earn depends on the sequence of prices, the portfolio chosen and whether the exit value is high enough to reward the units accumulated over time.
In this article, we focus on the other side of the SIP story for equity funds. Why? Because a proactive investor in today’s dynamic world can no longer afford to outsource their financial awareness to a system incentivised by assets rather than absolute outcomes. Distributors earn trail commissions to keep your capital parked, while fund managers are strictly bound by mandates to deploy your monthly SIP inflows, even when they may know the broader market is severely overvalued.
This apparent conflict of interest actively champions “lazy investing.” A “fill it, shut it, forget it” approach is a dangerous luxury in a hyper-evolving world where rapid technological shifts, such as AI, are aggressively rewriting business models and market cycles.
By now most investors know that when markets fall, each SIP buys more units; when markets rise, each SIP buys fewer units. For instance, a ₹10,000 SIP buys 100 units at a NAV of ₹100, but 125 units if the NAV falls to ₹80. Over time, investors hope they have accumulated mutual fund units at a relatively lower average cost. But, this is assuming markets swing up and down rather than only rising steadily. This way, SIP smooths out timing risk, letting build their portfolio steadily instead of trying to pick the perfect moment to invest all at once.
In a mutual fund SIP, the investor is not buying the units at the same price every month. She is buying units at different prices (NAVs), as the price of the underlying securities change. The return (XIRR) is, therefore, not merely a function of where the buying starts and ends. It is a function of every purchase price in between. This is why two SIPs with similar point-to-point returns can produce different return (XIRRs).
The message marketed to investors is simple — markets may be volatile, but SIPs will take care of wealth creation if they mute the noise and ignore the ups and downs. Such messages are useful, but they are also incomplete.
But make no mistake, doing a SIP is nothing close to a return promise, even if SIP calculators can make you feel there is a finality in their theoretical projections.
At the end of the day, SIP is just a cash-flow method. A monthly SIP can produce very different results depending on when the market falls, and when it rises. For instance, a strong multi-year rally in the Sensex during a five-year SIP can result in compounding at nearly 19.75 per cent XIRR, as in the 2016-21 cycle.
By contrast, high starting valuations followed by a market correction just as the five-year SIP matured deflated returns to a modest 6 per cent XIRR, as seen in 2021-26 period ended May 20. And if a severe crash hits right at the end, it can temporarily leave a negative -2.6 per cent XIRR for a five-year Sensex SIP, as in 2015-20 period.
In other words, the same disciplined habit — same monthly “debits,” same cash invested can look like a windfall in one cycle, mediocre in another and disappointing in a third. The difference isn’t the investor; it’s the path the market took.
The problem is not SIP. In fact, the problem is the mythology built around it. Yes, SIPs reduce timing regret. But, they do not remove market risk, valuation risk, category risk or the danger of chasing yesterday’s fund/index winners. They can make bad timing less painful, but they cannot make every entry point wise.
To show how market-swings shape SIP outcomes, we modelled a ₹10,000 monthly investment in the Sensex over five years. We illustrate four hypothetical contrasting market paths: A sharp early dip followed by a recovery, a steady growth trajectory, a flat market with late gains and a strong early rally (see TABLE 1).
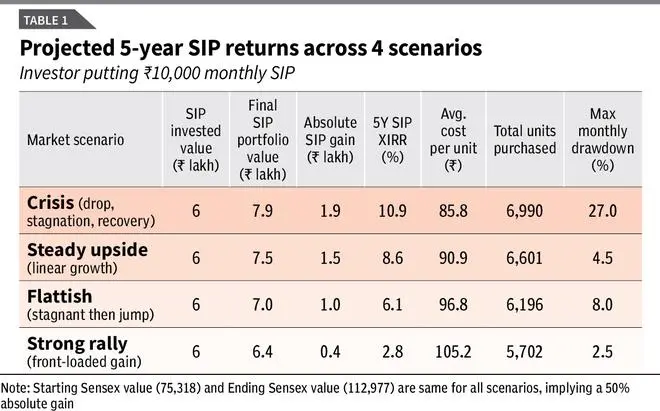
As you would notice, each path results in drastically-different final portfolio values and annualised returns (XIRR), ranging from 2.8 per cent to 10.9 per cent. This is despite identical cash flows and the exact same starting and ending index levels.
These examples underscore a critical reality. While SIPs smooth out entry timing, they cannot neutralise sequence-of-returns risk. The path the market takes largely decides whether disciplined investing feels like a windfall, a steady gain or a disappointment.
The projections assume a cumulative index growth of 50 per cent over five years (target ending Sensex: 112,977), an approximate PE ratio of 18 at end of the fifth year vs current starting PE of about 20, and annualised earnings growth of 10-12 per cent. To map these market levels to a realistic mutual fund structure, the index was scaled down to represent a base Unit NAV (for example, 75,318 translates to a starting NAV of ₹75.32).
Using AI modelling, we selected four illustrative market paths from countless possibilities, each reaching the same endpoint.
Crisis: An early, severe drop resulting in a 27.0 per cent maximum drawdown, followed by extended stagnation and a late recovery.
Steady upside: A smooth, linear rise interrupted only by minor 4.5 per cent corrections.
Flattish: Minimal overall growth for years, featuring an 8.0 per cent mid-cycle slump, before a sudden jump at the very end of the tenure.
Strong rally: Rapid, front-loaded growth causing an immediate NAV spike, followed by a prolonged plateau and a mild 2.5 per cent correction.
The aforementioned theoretical scenarios prove that the market’s path dictates your return. But what paths have Indian equities historically taken? To move from theory to empirical evidence, we ran rolling historical SIP returns across different market caps and themes over the last 20 years ended May 20, 2026.
We tested five-year, seven-year and 10-year SIP horizons (see TABLE 2).
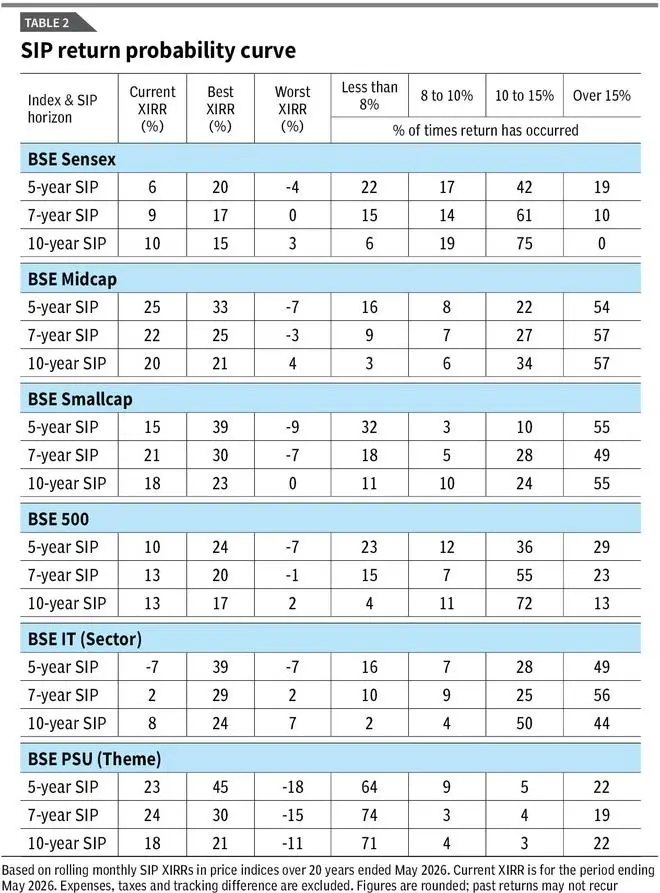
The results show a massive dispersion in outcomes. The real question is not whether SIPs made money once, but where most outcomes clustered and how bad the downside became.
The width of the SIP probability curve tells the real story.
* Time heals broad markets, but kills the windfall: The data validates the core tenet of long-term investing, provided you stick to broad indices. Notice how extending a Sensex SIP from five to 10 years acts as a powerful volatility shock absorber. The ‘less than 8 per cent XIRR’ possibility shrinks dramatically from 22 per cent down to just 6 per cent. However, time also actively crushes upside variance. Over a rolling 10-year period, the historical probability of earning a massive Sensex windfall (>15 per cent) collapsed to zero
* The fat tails of small-caps: Stepping outside the large-cap safety net exposes investors to a much-wider dispersion of destinies. A five-year small-cap SIP is the ultimate coin toss. Historically, there was a 55 per cent chance of a phenomenal windfall, paired directly with a 32 per cent chance of landing in the ‘less than 8 per cent’ zone. More importantly, time does not heal small-caps as perfectly as large caps. historical small-cap SIPs still faced a 11 per cent risk of sub-8 per cent returns, with the absolute worst-case scenario remaining in break-even territory (0 per cent).
* The thematic trap: Perhaps the most crucial takeaway lies in the thematic divergence. The standard industry advice is to “give it more time” when an equity SIP is underperforming. For highly-cyclical themes, this advice can be fatal. Look at the BSE PSU matrix. Over a fiveyear horizon, 64 per cent of SIPs landed in the sub-8 per cent XIRR zone. When investors extended their horizon to 10 years, hoping time would bail them out, the sub-8 per cent return actually expanded to 71 per cent. After 120 months of averaging down, the absolute worstcase scenario remained negative (-11 per centXIRR).
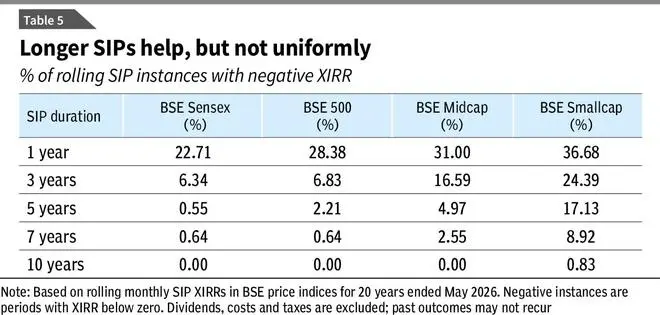
Our probability matrix shows that while a decade of patience might save a Sensex investor, it can actively destroy capital in cyclical or thematic funds. This exposes the ultimate flaw of “lazy investing.” If your SIP has compounded brilliantly over five-seven years, especially in a mid-cap, small-cap or sector/thematic fund, leaving that ballooned corpus entirely at the mercy of the market is mathematically reckless. Sectors revert to the mean violently, and as historical data show, massive windfalls can evaporate if you overstay the cycle. Negative SIP return instances, though infrequent, do happen even in case of broad-market stock baskets (see Table 5).
The danger of sector/thematic investing isn’t just about picking the wrong sector. It is actually about picking the right basket at the exact wrong time. An explosive half-decade growth creates the illusion of a permanent structural shift. But a new SIP doesn’t buy the last five years, it buys the next five. And the next five are usually governed by a brutal law of financial physics called ‘mean reversion’.
While the mutual fund industry may not have had a dedicated thematic fund for every single micro-sector back in 2008 or 2011, the underlying index data reveal exactly how these market cycles behaved. Our analysis maps the absolute peak of five-year trailing returns for each sector between 2011 and 2021, and tracks what happened to fresh SIP money over the subsequent 60-month window.
Look at the BSE Auto index. At its peak euphoria in December 2013, investors stared at a staggering 39 per cent five-year CAGR. But an investor starting a five-year SIP on that exact date suffered through a cyclical winter, generating a pathetic 1-2 per cent XIRR on their fresh money. This was because much of the money was invested at elevated levels in 2017–18, just before the index fell sharply near the end date.
The cyclical value traps are even more destructive. Investors who saw a respectable 11.7 per cent trailing 5-year CAGR return in PSUs in June 2011 and blindly started a SIP ended up actively destroying their wealth, yielding a -2 per cent return over the next 60 months. The Power and Oil & Gas sectors mirrored this exact trends.
Yes, there are exceptions too such as Capital Goods and Industrials. They prove that if a new earnings cycle perfectly aligns with momentum, returns can persist. Whereas in themes like IT, FMCG, and Financial Services, a peaking trailing return reliably signalled that the easy money had already been made.
SIPs are often treated as a behavioural cure-all. They are not. SIP fixes the habit problem. It does not fix the entry-price problem. It ensures regular investing. It does not ensure that the chosen category is still attractively placed.
First takeaway is that a SIP in a diversified equity fund is not the same as a SIP in a narrow sector/thematic fund. A SIP started after a broad market correction is not the same as a SIP started after a euphoric category rally. The debit may be identical every month; the risk being bought is not.
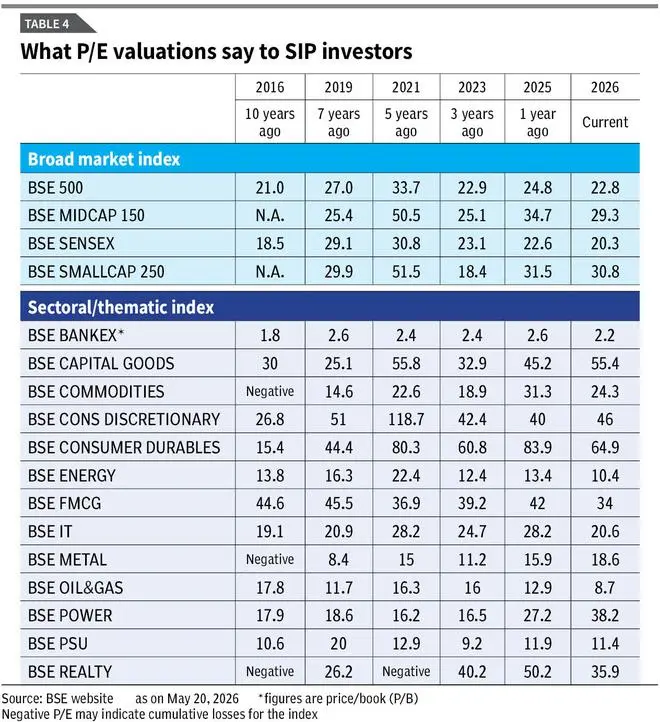
This brings to our second takeaway. We do not say that investors should avoid strong-performing categories. That would be too simplistic. The real lesson is that trailing returns should trigger questions, not commitment. What drove the return? Was it earnings growth, valuation expansion (see TABLE 4), policy excitement, liquidity or a temporary cycle? Has the index or category already doubled from its lows? Is the SIP being used to build long-term allocation, or to chase a hot table?
A top-5/10 SIP performers table is useful evidence of what has worked. It is poor evidence of what will work next.
Warren Buffett has emphasised his investment decisions which appear sudden are usually the result of a framework built over years: Clarity on why one is buying, what would change the thesis and when one should act. SIP investors need a similar discipline. A SIP can remain the route to accumulation, but it should not become an excuse for investing without a destination or review plan. Before starting, define the goal, time horizon, asset allocation and conditions for rebalancing or shifting accumulated gains through an STP. In euphoric or panic-driven markets, such a framework prevents both blind continuation and impulsive exit.
When we map out over two decades of rolling SIP returns across broad, sectoral and thematic indices, a system emerges (see TABLE 3).
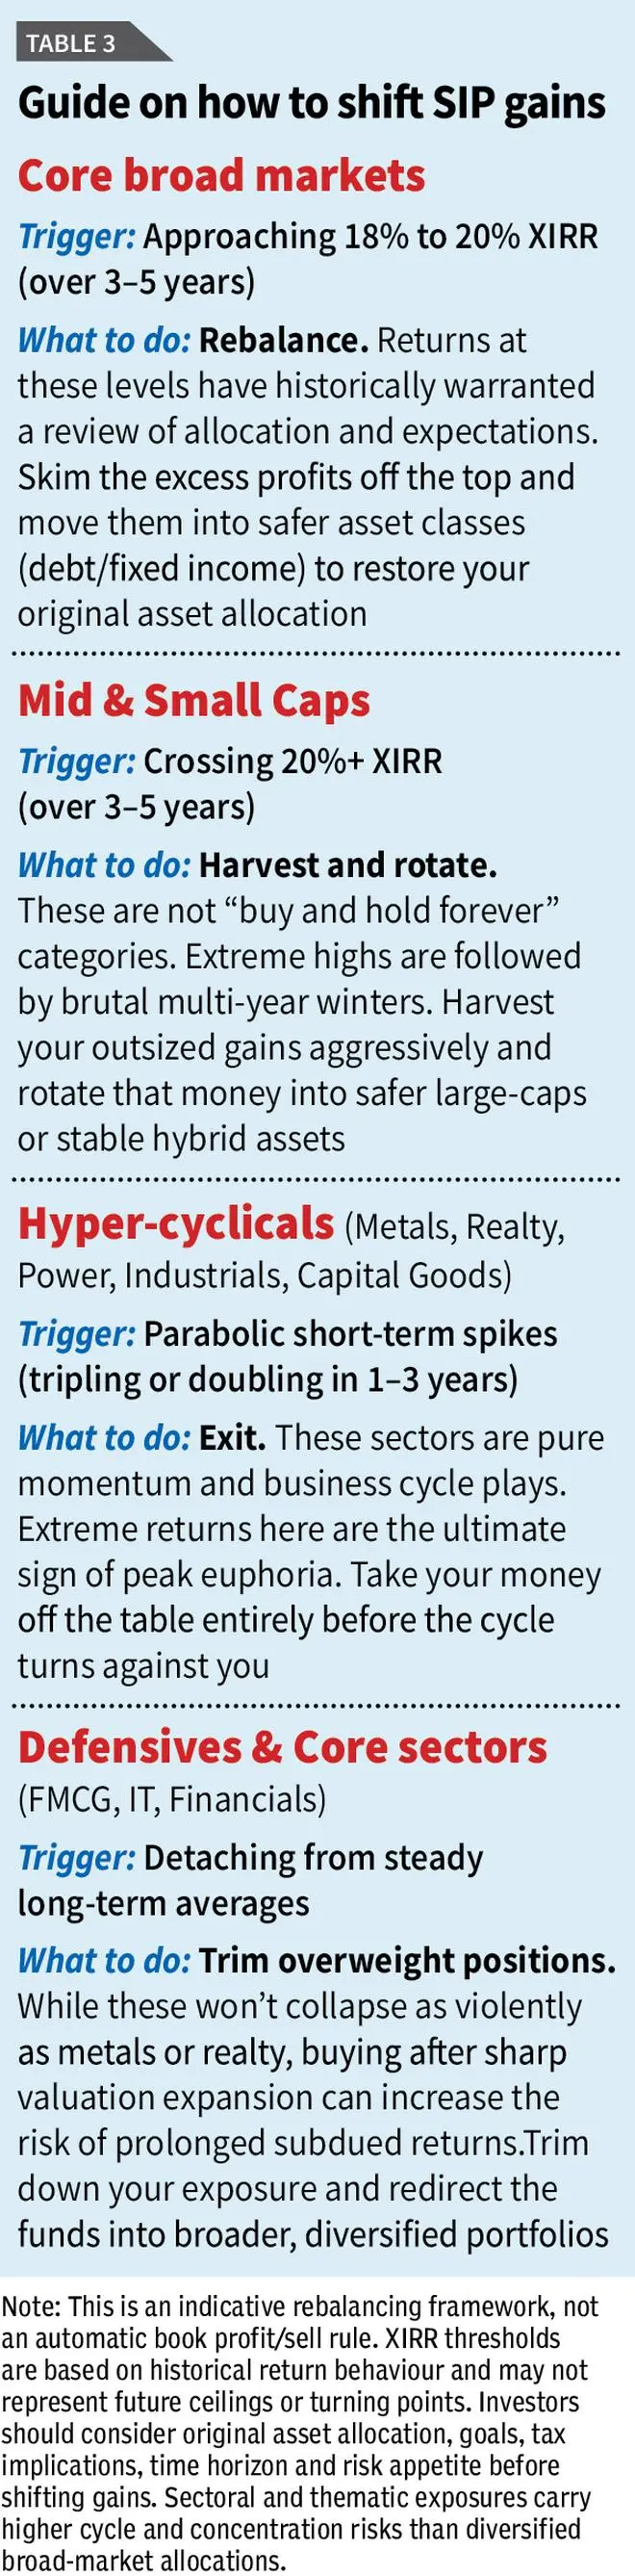
Exceptional returns are rarely a sign of permanent structural growth; they are almost always a signal of peak cyclical euphoria. Crucially, the data prove that when extreme returns flash, the culprits are usually sectoral indices, not the broad market.
While broad indices have strict historical speed limits, sectors can experience dizzying, unsustainable peaks. For example, the highest-ever five-year SIP return for BSE Industrials hit 54.6 per cent, and BSE Realty reached 48.8 per cent.
Broad market SIPs require a completely different set of rules. Because highly-diversified funds represent the broader economy, their historical ceilings are much lower. The data confirm that broad markets (Sensex, BSE 500) almost never breached a 25 per cent XIRR over a five-year period.
Because of these hard historical ceilings, the “euphoria zone” for a large-cap or flexi-cap SIP sits squarely between 18 per cent and 20 per cent. Over the last two decades, whenever a five-year SIP in the Sensex or BSE 500 breached the 18 per cent mark, it reliably signalled a market top. If your core equity portfolio hits this number, it is your mathematical signal to stop hoping for more and execute a standard asset-allocation rebalance, sweeping excess equity profits into safer places.
Mid- and small-cap funds carry a much harsher penalty because they behave almost exactly like the highly-volatile thematic sectors. Their historical peaks soar far above the broad market: The absolute highest five-year SIP return for the BSE Smallcap reached a staggering 39 per cent, while the BSE Midcap hit 33 per cent.
Because they are capable of such extreme highs, the cyclical winters that follow are unforgiving. Our historical backtesting shows that when a five-year SIP in a mid- or small-cap index simply crossed the 20 per cent threshold, the median forward three-year return from that exact moment was quite low. So when they deliver outsized 20 per cent+ returns over half a decade, even if they haven’t hit their absolute historical maximums, it is a mandate to harvest those gains and rotate into calmer waters.
Published on May 23, 2026
此内容由惯性聚合(RSS阅读器)自动聚合整理,仅供阅读参考。 原文来自 — 版权归原作者所有。