


The legendary energy trader John Arnold, recently made an interesting post on X: The fair market value of oil ticks up every day that goes by without an articulated plan for how to end the war’
It’s over 70 days since the US-Iran-Israel war started and the Strait of Hormuz has been made unnavigable; in this period, oil prices have gyrated wildly — up 39 per cent since day zero of the war, yet also down 15 per cent from the March 9 peak.
As the tug of war plays out in the commodities exchange, at stake are the global real economy and stock markets. After all, for the demand-supply mismatch to get sorted out without any major economic impact, the strait must open immediately to ease supply shock (doesn’t look to be the case currently) or prices must go so high that demand gets destroyed. As things stand today, cumulatively supply of 900 million barrels (mb) of oil has been lost and the counting is still on.
So are crude prices headed up or down? To understand this, let us look at the numbers that matter.
Prior to the war, crude oil prices were expected to trade much lower than the current levels. According to a US Energy Information Administration (EIA) release in February, despite supply disruptions amounting to 3 mb/d (million barrels per day), then the highest since September 2024 — due to outages in the US and Kazakhstan, Brent crude oil spot prices were expected to average $58 per barrel in 2026, nearly 16 per cent lower than the 2025 average price of $69 per barrel.
EIA had anticipated global oil production to exceed demand, resulting in inventory builds and eventually weighing on prices. In its February Short-Term Energy Outlook (STEO), global oil production and consumption for 2026 were projected at 107.85 mb/d and 104.79 mb/d respectively, implying a surplus of 3.06 mb/d. In comparison, excess supply in 2025 was estimated at 2.7 mb/d. But the war flipped the equation.
The tables turned on February 28, when the US and Israel attacked Iran and subsequently, the Strait of Hormuz was closed on March 4, impacting the flow of 20 mb/d of crude oil, accounting for nearly 20 per cent of global supply.
Brent crude futures surged to a high of $119.50 on March 9. Since then, prices have remained volatile, and the contract closed at $101.29 on May 8. Dated Brent (the benchmark for physical crude oil cargoes) marked a high of $144.46 on April 7.
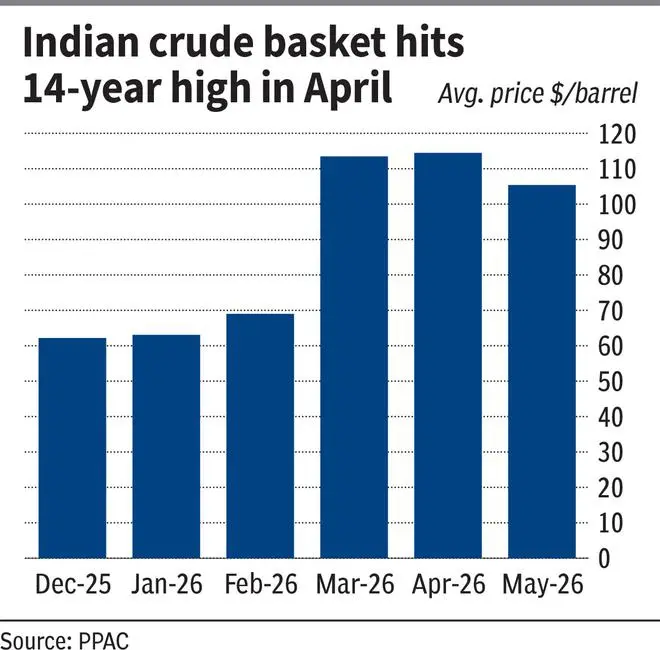
Consequently, the price of Indian basket of crude oil hit a 14-year high of $114.48 (per barrel) in April before moderating to $105.40 in May.
While crude oil prices surged in both the futures and physical markets, the latter saw a far sharper reaction. Dated Brent’s premium over Brent futures widened to an unprecedented $35.87 on April 9, as demand for immediately-deliverable cargoes shot up. Even during the onset of the Russia-Ukraine war, Dated Brent had peaked at $137.67 on March 8, 2022, and its premium rose only to $18.42 on March 9, 2022.
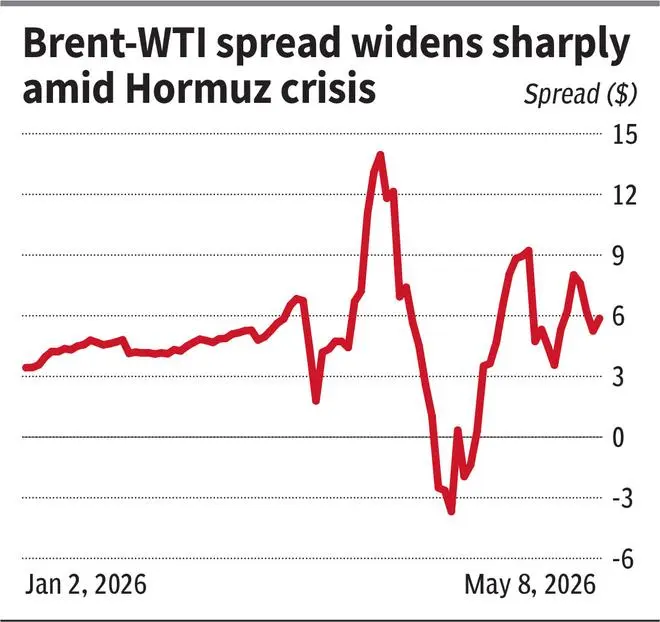
Also, the Brent-WTI futures spread widened sharply, as Brent, the global seaborne benchmark, reacted more aggressively to Hormuz-related supply risks, while record US production capped WTI’s upside. The spread later slipped into negative territory as panic eased with SPR releases, rerouting and arrival of previously-booked cargoes, while tighter US inventories and strong exports supported WTI relatively better.
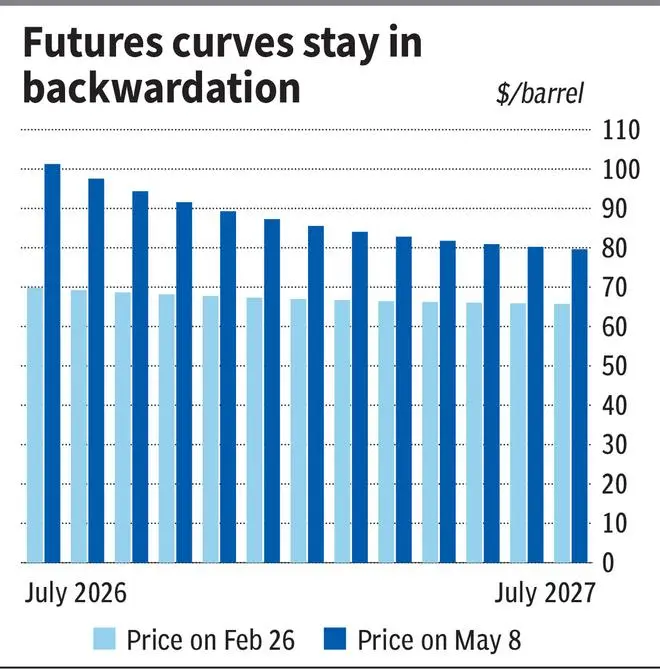
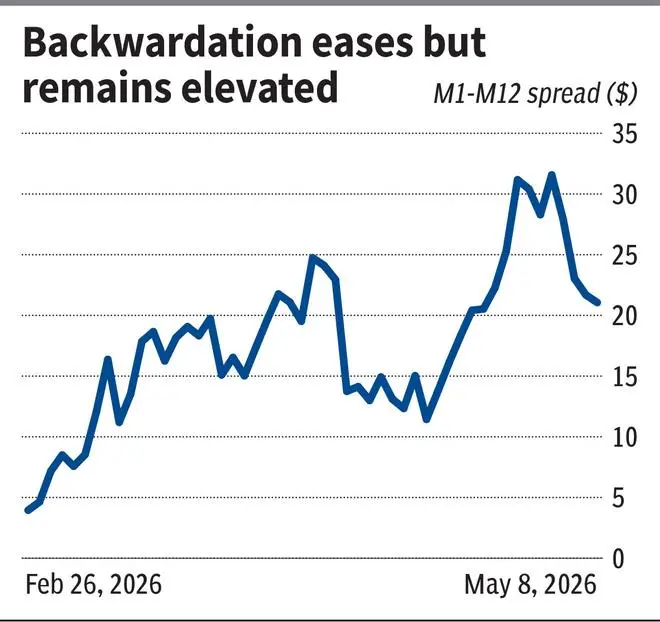
The scramble for near-term supplies also pushed Brent futures into steep backwardation, reflecting market’s willingness to pay more for immediate supplies. On February 26, just two days before the US struck Iran, the spread between the first-month and twelfth-month Brent contracts (M1-M12) stood at $3.95. It expanded sharply to $31.57 on May 4.
But prices, particularly of Dated Brent, by closing at $104.94 on Friday, has dropped 27 per cent from its peak of $144.46 over the last month.
Dated Brent is now closely trading with the futures contract, which is now at $101.29. Thus, the premium of the former over the latter has now significantly narrowed to $3.65 compared to its highest level of $35.87 on April 9, indicating that panic in the physical market is easing. Consequently, the M1-M12 spread has now moderated to $21.06.
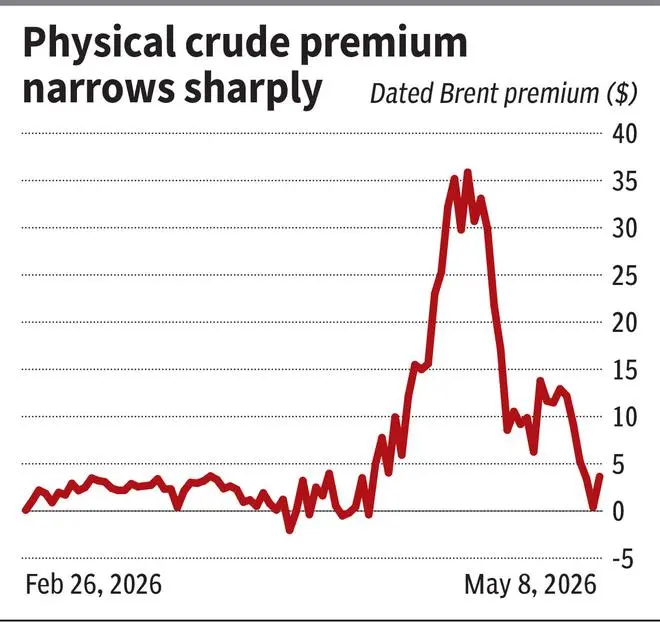
This could be because buyers are no longer bidding aggressively for cargoes. The current market sentiment points to temporary breathing room as panic-bought cargoes are now reaching destinations, SPR (Strategic Petroleum Reserves) releases are easing immediate scarcity, and buyers might have largely moved to the sidelines. This appears more like a wait-and-watch phase rather than genuine confidence in resolution.
So the important thing to note here is that the cooling in price will require hope to be transformed into reality, in the absence of which it may again start to move up.
Moreover, the steep backwardation in futures, the M1-M12 spread is still at elevated level of $21.06 despite the Dated Brent correction. This tells that the physical market shows panic easing, but the futures curve still prices in near-term scarcity and delayed relief. If Hormuz doesn’t show signs of reopening within weeks, refiners will likely be forced back into aggressive bidding, potentially reigniting physical tightness.
Note that even if the Strait reopens right now, operational constraints, maintenance backlogs and tanker logistics could extend full supply restoration to weeks or months. Especially after the production shut-ins (now at 7.5 mb/d as per EIA STEO) from Hormuz-dependent producers.
According to the International Energy Agency (IEA), the cumulative supply loss in March and April was 800 mb. IEA places the overall loss in oil exports exceeding 13 mb/d after rerouting 3.2 mb/d to bypass Hormuz. Rerouting has been through Saudi Arabia’s East-West Petroline and the UAE’s Abu Dhabi Crude Oil Pipeline (ADCOP).
Considering 13 mb/d loss in supply, the market has forgone approximately 104 mb in May so far, taking the total supply gap to a staggering 904 mb since the beginning of March, which is around 14,300 crore litres of oil. This is the equivalent of around 60 per cent of crude oil that India consumes annually!
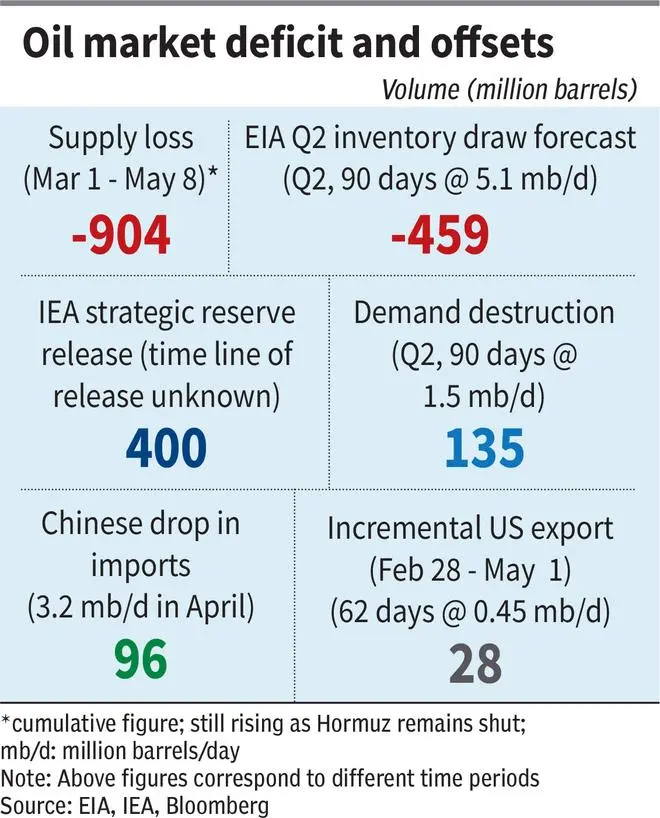
Though partial offsets have emerged as follows – the IEA had announced a coordinated release of 400 mb from strategic reserves on March 11 (US will be the largest contributor as EIA committed 172 mb); demand destruction of 1.5 mb/d in Q2, which is 135 mb for this period; incremental US exports averaging 0.45 mb/d since the beginning of the conflict in comparison to the first two months of this year.
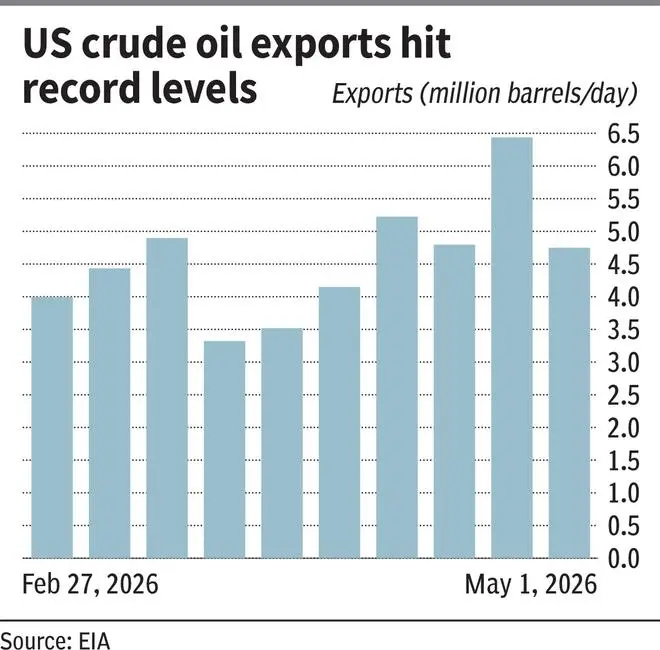
More recently, the US has been acting as an important buffer in terms of both production and exports to the global market. US exports hit a record 6.438 mb/d for the week ended April 24 compared to 3.322 mb/d for the week ended March 20, when SPR started to drop.
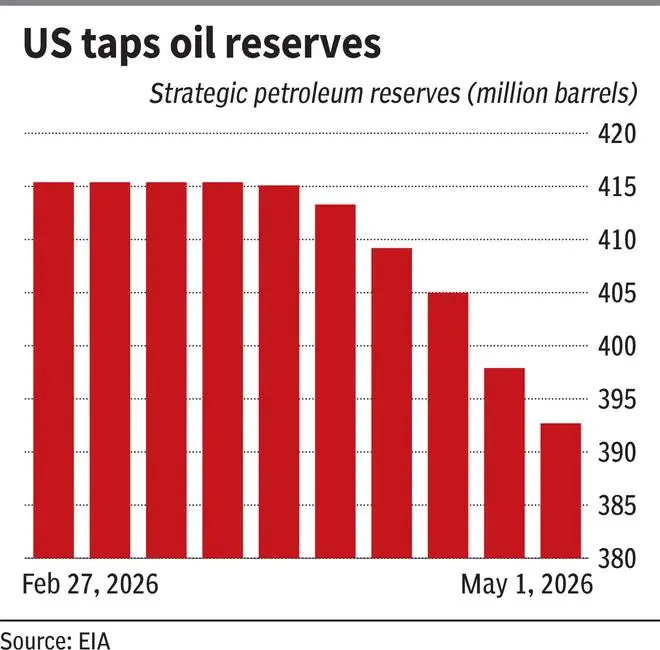
But while the US continues to support global supplies, its inventories are also being drawn down steadily. SPR declined from 415.4 mb on March 20 to 392.7 mb on May 1, a draw of 22.7 mb. This translates to around 0.55 mb/d during the period, suggesting that the incremental export of 0.45 mb/d was supported mainly by reserves.
Yet the offsets cannot come for a complete aid as the risk of prolonged closure of Hormuz and the strain it can have on reserves very much exists.
In our story on April 12, we discussed the distinction between a “flow” problem and a “stock” problem. The “flow” referred to residual supplies continuing to arrive from shipments that had crossed before disruptions began. The “stock” issue emerges if Hormuz remains shut for longer, causing flows to decline steadily and inventories to deplete.
The market now appears to be transitioning from a flow problem to a stock problem, as inventories are increasingly being tapped. To mitigate the impact of supply disruptions, consumers and refiners have started drawing down oil inventories.
EIA anticipates a 5.1 mb/d (around 459 mb) inventory collapse in Q2 (CY26), suggesting underlying tightness persists. On the other hand, the IEA’s April Oil Market Report (OMR) shows inventory draw outside of the Middle East Gulf at 6.6 mb/d (205 mb) in March as refiners scrambled for accessible cargoes, while crude inventories continued piling up in the Gulf, effectively trapped behind a closed Strait.
Comparing 400 mb release and considering EIA’s comparatively lower pace of inventory draw of 459 mb (5.1 mb/d for three months as mentioned above) in Q2, the release cannot even fully cover the draws in 90-day period, ending June.
IEA also notes that crude oil inventories in importing Asian countries declined by 31 mb in March, with further draws expected in April. Where inventories failed to bridge the supply gap, demand itself has taken a hit. Most notably, Asian petrochemical producers have curtailed operating rates as feedstock availability tightened.
China, the world’s largest crude oil importer, has reduced imports from 11.7 mb/d before the war to 8.2 mb/d in April, implying a demand reduction of 3.5 mb/d, according to a Bloomberg report. The sharp reduction in imports is emerging as one of the biggest balancing forces in the market, potentially taking some pressure off the global draining reserves.
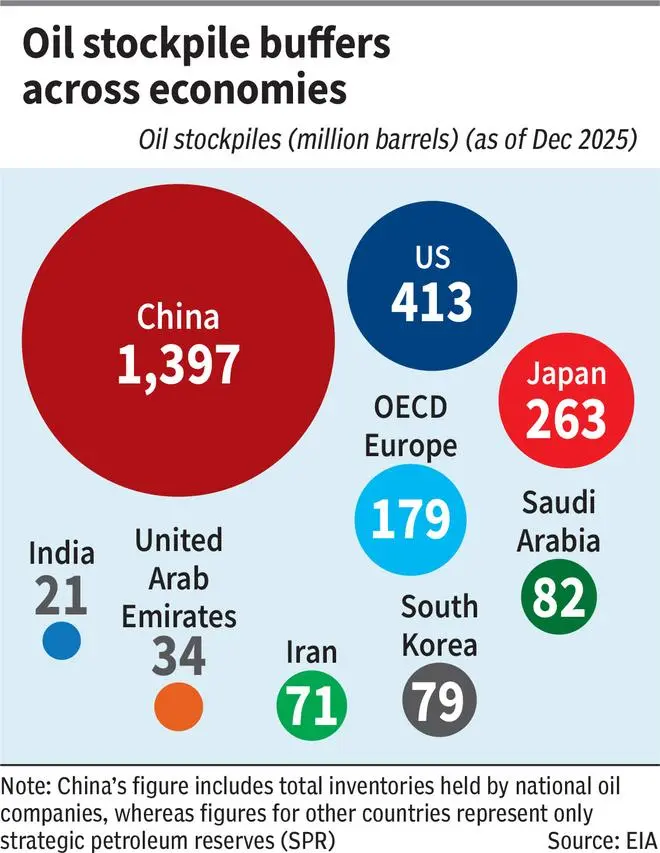
While the IEA members hold inventory stockpiles of 1,800 mb (1,200 mb are emergency stock piles and further 600 mb of industry stocks held under government obligation), how much of them is accessible is uncertain. Assuming full access to 1,800 mb at an inventory draw of 5.1 mb/d, we have 353 days of stocks left. But draining to the tee is never an option. Besides, large minimum balances need to be maintained in storage facilities to keep the system running.
However, as per a JP Morgan report, the global inventory is 860 mb. Out of this, 280 mb have been drawn down, leaving 580 mb of usable inventory. According to them, the global oil inventories are declining at a rate of 8 mb/d. In this case, we’re running dangerously close to the bottom with only about 73 days of stocks left.
If elevated oil prices sustain for a prolonged period, it could trigger demand destruction and weigh on prices. In such a scenario, supply disruptions may eventually lose some of their impact.
In its April OMR, the IEA forecasts oil demand growth to contract 80 kb/d (0.08 mb/d) in 2026 compared to previous estimate of a growth of 730 kb/d (0.73 mb/d), cutting 810 kb/d (0.81 mb/d) of demand for the year. It also forecasts a 1.5 mb/d decline in Q2CY26 demand, the sharpest quarterly drop since the Covid-19 pandemic.
The EIA, on the other hand, has reduced its 2026 demand growth estimate from 1.2 mb/d to 0.6 mb/d. Taking both projections into account, the loss in demand could be in the 0.6-0.81 mb/d range.
Assuming an average demand loss of around 0.705 mb/d (average of the above-mentioned range) between April and December this year, the implied reduction works out to nearly 190 mb for the period, partially offsetting the supply shortfall.
That said, there are two competing arguments from the demand perspective. One is that elevated prices will eventually destroy demand, leading to lower prices and reducing the impact of supply disruptions over time. The other is that inventories currently being depleted will eventually need to be replenished, potentially keeping demand elevated and crude prices firm even if Hormuz reopens.
Not necessarily. While the 27 per cent correction in Dated Brent from its April peak and its premium over futures dropping to $3.65 suggests immediate panic is easing, upward pressure on crude prices remains embedded in the market structure.
At a net loss of 13 mb/d, the supply crisis, which has now reached a cumulative loss of approximately 900 mb, will deepen for each additional day that Hormuz remains closed. Production shut-ins cannot reverse instantly even if the Strait reopens, as operational normalisation will take weeks and global inventory depletion means buffer capacity is thinning, supporting the upside risks.
.
.
EIA, in April STEO, has made upward revision in Brent crude oil spot price to an average $96 in 2026 compared to $58 in February STEO. Note that April STEO was released on April 7. One should closely watch their May STEO, scheduled to be released on May 12 for updated projections factoring in the recent developments.
One should also note that the IMF has warned that oil at $125 could push countries outside the US and China into recession.
Brent crude futures ($101.29/barrel) began 2026 on a strong foot as it saw a notable uptick in January, even before the war broke out. It had surpassed a falling trendline resistance at around $63 in early January. After some consolidation in the first half of February, the contract saw a sharp rally and hit a four-year high of $119.50 on March 9.
But since then, Brent crude oil futures has been trading in a broad sideways trend, between $94 and $115, accompanied by high volatility, consequently witnessing price swings of both sides within the range.
Although currently, the contract is in a broad range, there is an upward bias, as the support at $94 holds true and the price is above 21- and 50-day moving averages.
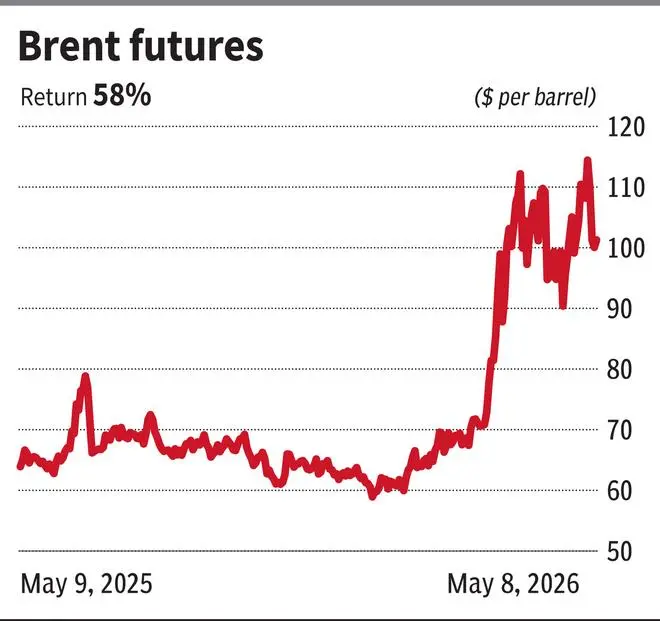
In case Brent crude futures gather enough strength to break out of $115 and manage to witness a weekly close above it, we will most likely see another leg-up, potentially lifting the price to $128 and $140, as indicated by Fibonacci extension levels.
But if the bears gain traction and drag Brent crude futures below the base at $94, the near-term outlook can turn weak. In this case, the downswing can extend to $88 quickly. A breakdown below this can lead to a fall to $80.
As it stands, the bias is bullish and $128 appears a realistic target. However, the volatility is expected to remain at elevated levels.
MCX-Crude oil futures (₹9,024), like Brent crude futures, looked positive since the start of the year. The rally exploded towards the end of February, which took the contract to ₹10,549 on March 9 in the first swing. Then, unlike Brent crude futures, MCX crude futures witnessed another leg-up and hit a life-time high of ₹10,990 on April 7.
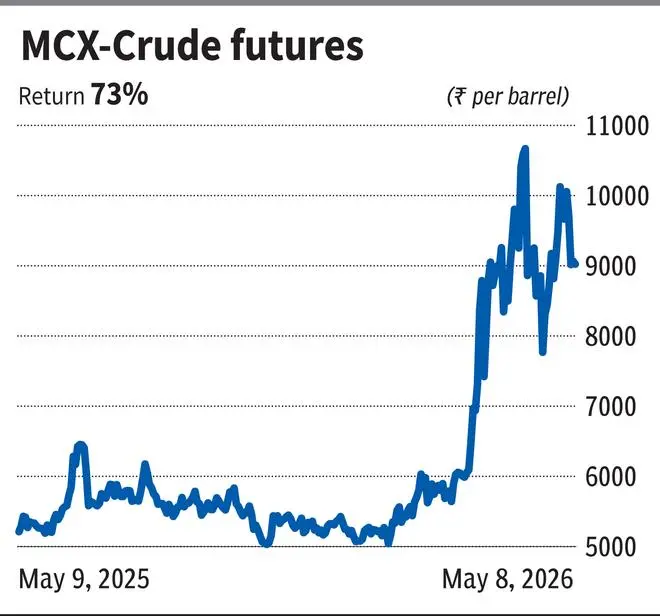
The prevailing price action shows that the bulls have not exhausted the fuel. Key support levels are at ₹8,500 and ₹8,000. The latter is the key price-point from the outlook perspective. That is, until this level holds, the positive inclination will persist.
A regain in traction for the bulls can lead to MCX crude oil futures to fresh highs, with potential barriers at ₹12,000 and ₹12,400. On the other hand, in case of weakness build-up, leading to the breach of the support at ₹8,000, the contract can fall to ₹7,500 or even to ₹6,750.
Published on May 9, 2026
此内容由惯性聚合(RSS阅读器)自动聚合整理,仅供阅读参考。 原文来自 — 版权归原作者所有。