





Information Technology (IT) stocks have been beaten down badly this year. The BSE Information Technology (IT) index, down about 25 per cent (year-to-date) is the worst performing sector so far. The index declined 15 per cent last year as well and was the second worst performer. From the peak of 45,792 made in December 2024, the index is down about 40 per cent.
In our Big Story, “Sectors to play in 2026”, written in January this year, we had given a buy in the BSE IT index. The index was then at 36,795 and we had forecast for a rally to 49,500 by the end of this year. This view has gone wrong. The BSE IT index tumbled well beyond our stop-loss level of 30,600 to touch a low of 27,428 last month. It is currently at 27,648.74
Can the IT index fall more? If yes, how far can it fall? Where can the index find its bottom? As an investor, is this the right time to do a bottom fishing or should you wait for some more time? Here is our take based on technical analysis.

There is no concrete sign of either a bottom or a trend reversal visible on the charts currently. However, there are some strong supports coming up for the index. The first one is at 26,930, which is the 100-Month Moving Average (MMA). This will be an important support to watch. Because during the Covid market crash, the IT index found a bottom just above this 100-MMA.
The second important support is in the 24,700-24,250 region. A trendline and the 61.8 per cent Fibonacci Retracement support are poised in this region.
Resistances are at 36,000 and then in the 39,500-40,000 region.
We are now going to discuss two possible scenarios here.
Firstly, we have to see if the IT Index sustains above 26,930 (100-MMA) itself and then goes above 36,000 or not. If it does, then that could be an initial sign of relief and an early indication of a trend reversal.
Second scenario will be if the index breaks below the 100-MMA support (26,930). In this case, there can be an extended fall to 24,700 or 24,250. For now, we do not expect a fall beyond 24,250. There are good chances for the BSE IT index to find a bottom in the 24,700-24,250. This will be another 12 per cent from the current levels.
A strong bounce from the 24,700-24,250 support zone and a subsequent rise above 30,000 will give a breather. Thereafter, a rise above 36,000 will give early signs of a trend reversal.
In both the scenarios, 39,500-40,000 is going to be a very crucial level to watch. Ideally, the BSE IT index has to rise above 40,000 to confirm a trend reversal and become convincingly bullish. Only then will the doors open for a fresh rally to 52,000-53,000 over the long term, that is over the next two years or so.
So, as seen from the charts, it looks like a wait-and-watch situation for now.
The picture on the log chart is pretty clear. The BSE IT index is now at a strong long-term support if we look at the log chart. Before we get into the details, let us first see what a log chart is. Then we will see how significant it is to use this log chart in technical analysis.
So, here we try to explain what a log chart captures in simple terms.
In a normal chart, the absolute value will be captured as it is. For example, assume that the BSE IT index moves from 100 to 200 in January and then from 200 to 400 in February. On the candle chart, the size of the January candle will be 100 points (100 to 200) and that of February will be 200 points (200 to 400). That is the size of the February candle (200 points) will be double that of the January candle (100 points).
The log chart, on the other hand, captures the percentage change between two points rather than the absolute values. If we take the same example given above, the movement between 100 and 200 in January and 200 and 400 in February, both will be a 100 per cent move. So, if we plot a candle for these two months, then both will be of the same size in a log chart.
In technical analysis, the log charts are used for analysing long historical data. It helps to identify the long-term trend and make forecasts. Many a time, the log chart helps identify crucial supports and resistances, and also major reversal points, which cannot be spotted on the normal absolute price chart.
Any unexpected high volatility in the market caused due to a natural disaster (Covid) or geopolitical tensions are normalised when a log chart is used.
In technical analysis, we use log chart in conjunction with the absolute chart to get better clarity when the latter does not give you a clear picture.
BSE IT index – Log chart analysis
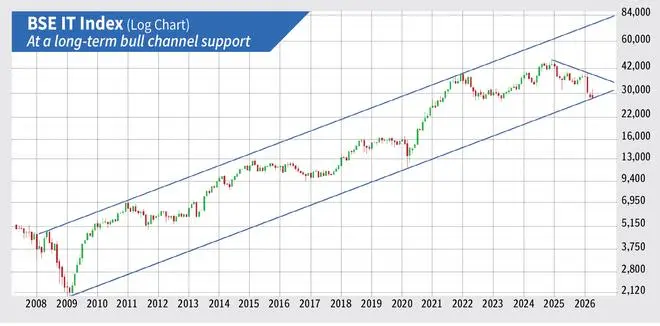
The outlook for the BSE IT index is strongly bullish, if we look at its log chart. There is a long-term trendline support at 27,400. Another support is 26,650. In addition to this, the price action since 2008 indicates a bull channel. The index is now hovering above the lower end of this channel. So, from a long-term perspective, there are good chances for the BSE IT index to go up towards the upper end of this channel in the coming years.
But given the current scenario, such a strong rise may look unlikely, considering the fundamental factors especially given the AI disruption. But based on the log chart, such a rise is a possibility.
Given the current negative sentiment, one possible scenario could be is that, the BSE IT index may run into a sideways range for some time. The trading range could be 26,500-40,000. Once the fundamental situation improves, then maybe the index can make a bullish breakout above 40,000 and go up towards 53,000 first and then to the upper end of the channel in the coming years.
If we compare the BSE IT index movement from 2009 to 2011 and 2020 to 2022, an interesting pattern is coming out. The index bottomed at a low of 1,987.81 in February 2009 and then surged to a high of 6,921.41 in January 2011. Similarly, from a bottom of 10,937 in March 2020, the index peaked at 38,713 in January 2022. In both instances, the index skyrocketed by about 250 per cent in about 22-23 months.
This year in March, the index touched a low of 27,428 and is attempting to bounce. If the same pattern that was seen earlier has to repeat, then the index can see a peak in January 2028. But the question is whether a 250 per cent surge is possible. The answer could be NO, given the current fundamental background.
However, if one has to go purely by the charts, then that possibility cannot be ruled out. So, we may have to keep an eye on this.
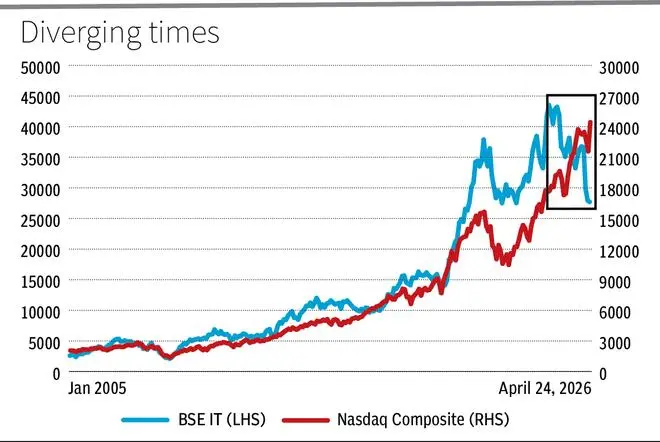
The BSE IT and the NASDAQ Composite have always moved in tandem. But there has been some divergence since 2025. The NASDAQ Composite index has surged 29 per cent since December 2024. The BSE IT index, on the other hand, has tumbled 36 per cent over the same period.
The NASDAQ Composite (24,837) index looks bullish for a rise to 27,000-27,500 in the coming months. If the current divergence between the two indices continue to exist, then the rise in NASDAQ Composite index may not aid the BSE IT index to rise back. Conversely, if both start to move together again, then it can help the BSE IT index to revive.
We will have to wait and watch.
Combining all the factors discussed above, there is no concrete evidence that the BSE IT index has already bottomed out.
The absolute chart indicates that there is another 8-12 per cent downside left from here. However, on the log chart, the index is already close to long-term support. So, we suggest investors enter this index in a staggered manner.
Investors can consider investing 20 per cent of the intended capital at current levels. Buy another 30 per cent at 26,800. The balance of 50 per cent can be invested when the BSE IT index falls to 25,600.
The average entry in this case will be 26,370. Keep the stop-loss at 20,800. Trail the stop-loss up to 28,800 when the index goes up to 33,300. Revise the stop-loss higher to 34,600, 42,300 and 47,500 when the index goes up to 38,800, 45,600 and 49,800 respectively. Exit the trade and book profits when the index goes up to 51,500
Now, what if the index reverses higher from around 26,500 itself and does not fall to 24,700-24,250. One will miss out on the third entry level of 25,600. In this case, investors will have to be ready to buy more at higher levels. The third entry can be split at 20 per cent at 32,300 and 30 per cent at 37,800. In this scenario, the average entry level will be 31,370. The stop-loss, target and other strategies can be the same as was mentioned in the previous case.
On the charts, the individual stocks and bellwethers like TCS, Infosys, HCL Technologies and Wipro are not giving a clear picture to take a convincing investment decision. So, we suggest investors go for other alternate instruments that are available in the market.
There are many direct mutual fund (index funds) schemes and exchange-traded funds for investors who wish to consider investing in the IT sector. Among the ETFs, Nippon India ETF Nifty IT, ICICI Prudential Nifty IT ETF and Kotak Nifty IT ETF can be considered.
Those looking for direct mutual fund schemes can look for ICICI Prudential Nifty IT Index Fund, Nippon India Nifty IT Index Fund and Axis Nifty IT Index Fund.
The levels mentioned in the investment strategy above can be considered as a proxy for entry and exit from mutual funds or ETF.
There is always a risk of the forecast going wrong. So, strictly adhering to the stop-loss is a must.
Published on April 25, 2026
此内容由惯性聚合(RSS阅读器)自动聚合整理,仅供阅读参考。 原文来自 — 版权归原作者所有。