





The Indian rupee has been in the news recently for its sharp depreciation against the dollar. After declining to a new low of 87.95 on February 10 this year, the rupee witnessed a strong recovery. The domestic currency surged over 5 per cent from its all-time low and made a high of 83.76 in May.
The dollar index tumbling about 11 per cent from a high of 109.9 in February to a low of 97.9 in April aided the recovery in the Indian rupee. But thereafter, the rupee declined again, giving back almost all the gains and is now currently at 87.66. Indeed, the dollar index continued its fall, after a slight recovery and made a low of 96.38 on July 1. The 11 per cent fall in the first half of this year has been the worst for the greenback in the last 50 years.
So, what dragged the rupee lower when the dollar continued to stay weak? With the dollar index witnessing a recovery over the last one month, what is the way forward for the Indian rupee? Here is an analysis.
Different factors dragged the rupee from the May-high of 83.76 to the current levels. The initial trigger for the bearish reversal from the low of 83.76 came on the back of the India-Pakistan conflict. Operation Sindoor, carried out by India in the first week of May, dragged the rupee below 85.
Secondly, in mid-June, the escalation in the Israel-Iran war triggered a sudden spike in the Crude Oil price. Brent Crude oil spiked about 15 per cent from around $68 to $78 in just one week. This sharp rise in oil price knocked the rupee down by 2 per cent from around 85.4 to 86.9 against the dollar that time. However, the ceasefire announcement, followed by a sharp fall back in the crude oil price, aided the rupee recovering towards 85.20 by early July.
But this recovery lost steam as foreign money outflows began to weigh on the domestic currency. The foreign portfolio investors (FPIs) pulled out $2.05 billion from the equity segment in July. This dragged the Nifty 50, the benchmark equity index, by 3 per cent. It dragged the rupee below 87 again and the currency was down 2 per cent for the month.
Indeed, the trigger for the fall below 87 in rupee came towards the month-end on July 30. The US President Donald Trump announced a 25 per cent tariff on Indian imports and that dragged the rupee to a low of 87.80 in the final trading day of the month.
An additional tariff of 25 per cent on the US imports of Indian goods came in as a surprise last week. However, this has not caused any significant impact on the rupee movement. This additional tariff will come into effect from August 27.
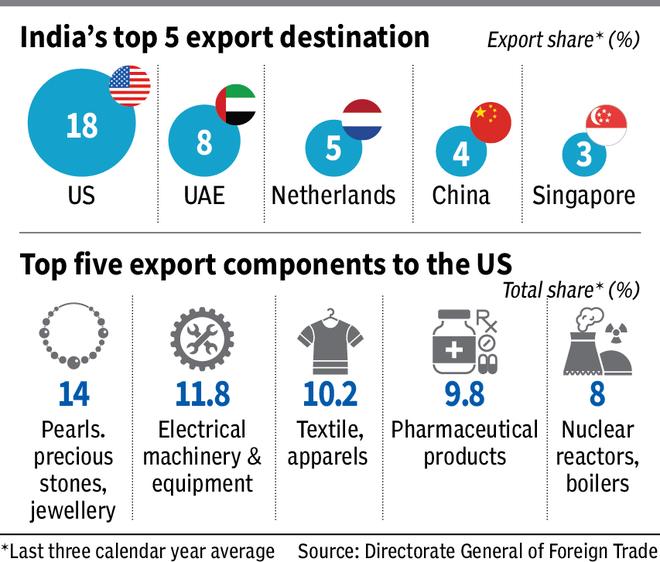
The US is the largest export (merchandise) destination for India, accounting for an average of 18 per cent on total exports. The average export volume to the US has been on an average (three calendar years) of about $79 billion. Among the components, pearls, precious stones, jewellery etc have accounted for 14 per cent (three-year average) of the total exports. Electrical machinery and equipment etc account for about 12 per cent and all textiles, apparel and clothing form 10 per cent of the total exports to the US.
According to various research reports, the total 50 per cent tariff levied is likely to bring down India’s annual growth by 30-50 basis points. The Reserve Bank of India (RBI) in its latest Monetary Policy Statement has projected the Indian economy to grow 6.5 per cent. The impact on the overall economic growth might look minimal. But impact on specific sectors such as textiles and apparels that form a major part of the in the US exports pie might be hit badly.
Overall, this could have some impact on the total trade balance, though the quantum is not very clear at the moment. As such, that could keep the rupee weak going forward.
High import tariffs in the US increase the danger of a global slowdown or within the US itself. A global slowdown will occur if the US companies cut down their imports to avoid high tariffs. On the other hand, if they continue with their imports, then they have to pass the increased cost to the US consumers. That, in turn will see the inflation in the US going higher.
The US Headline Consumer Price Index (CPI), currently at 2.67 per cent (year on year), has been going up over the last two months. If the tariff impact comes into play, then that would leave the doors open for the Headline CPI to go up to 3 per cent and even higher.
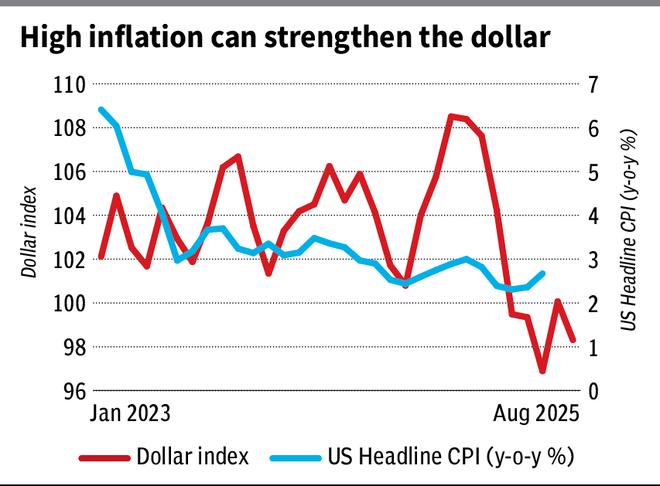
As seen from the graph above, the US Headline CPI and the dollar index have a good directional correlation. As such, if the inflation goes up in the coming months, then the dollar can also strengthen more.
High inflation will also close the doors for the US Federal Reserve to cut interest rates further. This will also be dollar-positive.
The FPIs pulling out money, especially from the Indian equity segment, has also been one of the major contributors for the rupee weakness. Since September last year, the time when the Indian stock market started to reverse lower from its all-time peak, the FPIs have pulled out about $23.5 billion from the equity segment.
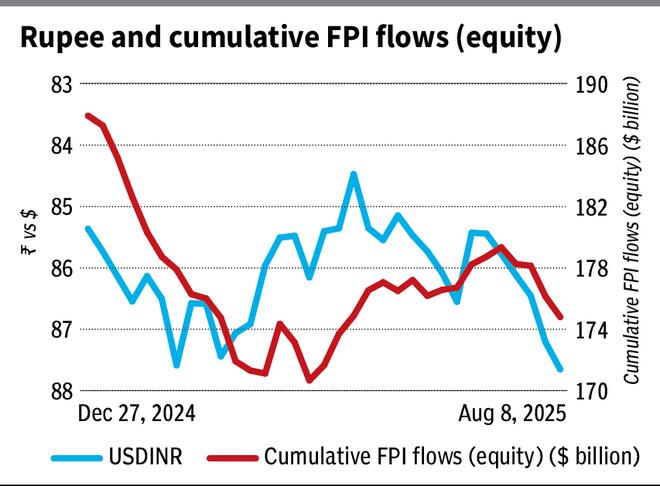
Data show that the cumulative flow (since 2004) fell from around $199.65 billion by September-end to $175 billion now. So, unless the FPIs stop their selling spree and start buying Indian equities, that too consistently, the rupee is unlikely to gain ground.
Broadly, we see that the impact of tariffs, possible dollar strength on the back of high inflation in the US and the foreign money outflows, is likely to keep the rupee weak.
In order to gauge how much the rupee can weaken more from here is what we arrive using chart analysis.
Indian rupee: The recent fall below 87 confirms a head and shoulder bearish reversal pattern on the chart. Short-term support is in the 88.10-88.20 region. The rupee touched a low of 87.89 and recovered slightly from there. A further rise to 87.10-87 is possible in the near term. The region between 87.10 and 86.90 is a very strong resistance zone for the rupee, which can limit the upside. As such, we can expect the rupee to reverse lower again from this 87.10-86.90 resistance zone and fall back to test the 88.10-88.20 region.
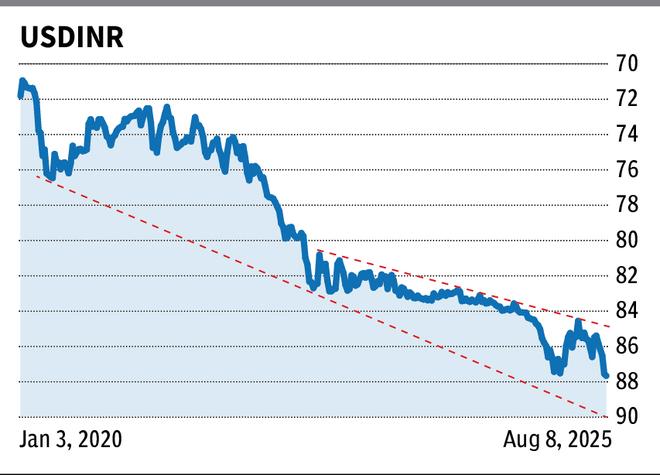
An eventual break above 88.20 can then drag the rupee down to 89.50-89.70 or even 89.90-90, which is the target region of the head and shoulder pattern. For now, a rise above 90 could be less probable. So, there are good chances for the rupee to see a recovery towards 87.50-87.
But if there is high volatility in the market, then the rupee may remain vulnerable to break 90 and fall even to 90.70-91. This will be a worst-case scenario.
If the RBI intervenes in the market now, then the rupee can remain in a sideways range of 86.90-88.20 for some time. Also, if the rupee manages to break 86.90, it can see an extended rise to 86.50, but not beyond that. In both cases, the expected fall to 89.50-90 will be delayed.
Dollar index: The dollar index (98.18) touched a low of 96.38 in July and has risen back well from there. On the charts, the region around 96 is a very strong long-term trendline support. So, there are good chances that the dollar index has found its bottom already. From a long-term perspective, if the dollar index sustains above 96, a rise to 106-108 cannot be ruled out. A decisive breakout above 102 can clear the way for this rally.
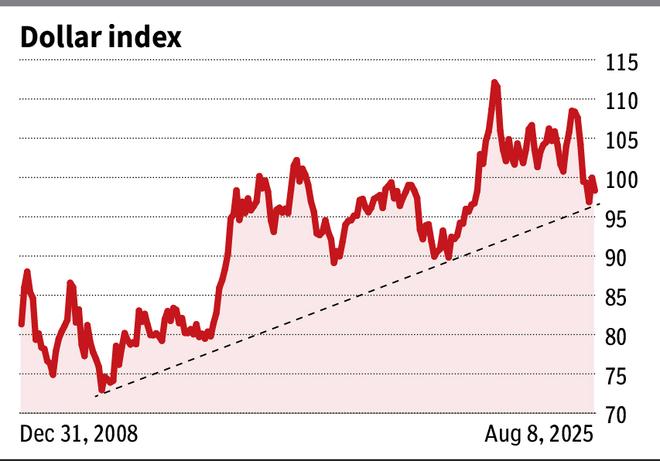
However, a base formation in the form of a sideways consolidation between 96 and 102 is a possibility for a few months before the rise to 106-108 happens. This can drag the rupee down to 90 in the coming months.
In order to cross-check the expected fall to 90 on the rupee, we see how the rupee can perform against the other majors and derive where the USDINR can be possibly headed.
EURINR: The EURINR cross is currently at 102. The outlook is bullish with good support at 101. The cross can rise to 106 at least from here. In a best-case scenario, there is room upto 110 as well.
The euro (EURUSD: 1.1640) has still room on the upside to test 1.20. It has a strong support at 1.12. So, 1.12-1.20 is the possible range that can be seen on the euro for now. This suggests that the dollar index can remain in the range of 96-102 for some time.
For a range of 1.12-1.20 on the EURUSD and 101-106 on EURINR, we get an average value of 89.33 for the USDINR.
JPYINR: The JPYINR (0.5933) has an immediate support at 0.59. Below that, 0.57 is the next strong support. It can rise to 0.61 or 0.62. The USDJPY (147.74), on the other hand, can oscillate in a range of 145-155.
So, taking a range of 0.57-0.62 on the JPYINR and 145-155 for the USDJPY, we get an average value of 90 for the USDINR.
GBPINR: The GBPINR (117.89) looks bullish for a rise to 121 and even 125. It has good support at 116. The GBPUSD (1.3450) can rise to 1.37 or 1.40 and can then fall back to 1.30-1.28.
For a wide range of 1.28-1.40 on the GBPUSD and 116-125 on the GBPINR, we get an average of 89.30 on the USDINR.
Published on August 9, 2025
此内容由惯性聚合(RSS阅读器)自动聚合整理,仅供阅读参考。 原文来自 — 版权归原作者所有。