





Artificial intelligence (AI) is here and the world as we knew is changing rapidly. AI tools have evolved greatly and are complementing workflows in all disciplines. The software industry is a good example. Gone are the days where knowledge of syntaxes of programming languages was a skill an engineer would be proud of. With AI in the picture now, prompt engineering has become the more sought-after skill—whether they can construct smart prompts to leverage the power of AI and bring about a leap in efficiency.
How about the field of personal finance? Can AI tools help a humble retail investor leapfrog his capabilities? This is a tricky question to answer, as it involves one’s hard-earned money. While there is no doubt that AI tools have become more mature and powerful than before, they could still hallucinate and generate wrong outputs. We tried experimenting with free AI tools available. In short, we found them to be extremely handy in generating quick analyses, compiling data available on the web, building stock-screeners and making complex calculations. This is a boon for investors who are crunched for time. At the same time, these tools are prone to be inaccurate that it is not safe to bet real money based purely on an AI-generated analysis.
The best way then, is to use AI-generated results to gain a quick perspective and treat them as a launchpad for your further analyses—and this alone, in our view, makes a good case for AI tools to be part of one’s personal finance arsenal. In this story, we share a few simple use-cases for fundamental investors to get started and also highlight the limitations of AI tools so that you can steer clear of those pitfalls.
Often you would find yourself new to a sector and would appreciate a crisp primer on the sector to get started. We prompted Google’s Gemini to generate a primer on the tyres industry. We recommend a pointed prompt as below to guide the model in getting the answers you need.
Assume you are a veteran of the Indian tyres industry. Generate a sector primer. Focus on factors such as the incumbents and their market share, the segments they serve, the raw materials, input cost volatility, margins that can be expected and the sector’s cyclicality.
Here are a few pointers we learnt from the output.
* MRF, Apollo, CEAT, JK Tyre and Balkrishna Industries together control over 85 per cent of the organised market
* MRF has the deepest distribution network, Apollo has a presence in Europe through the Vredestein brand and Balkrishna Industries is a leader in off-highway tyres
* Replacement/ after-market sales generate higher margins than sales to OEMs
* Natural rubber and carbon black (a derivative of crude oil) are key raw materials and their prices impact margins, which could range between 10 per cent and 17 per cent
* The industry is semi-cyclical, given the OEM demand is tied to new vehicle sales (cyclical) and replacement demand is tied to wear and tear (non-cyclical)
AI could compile such a primer in seconds, which could have taken days otherwise. You can also use the ‘Deep Research’ feature for a thoroughly-researched output, but it takes a few hours to generate the output depending on the prompt.
As a fundamental investor, you cannot shy away from reading verbose documents like annual reports and earnings call transcripts. AI tools are here to make it simple, and this is the use-case we found to be the most useful.
We were curious to know how Maruti Suzuki’s cost structure and margins were impacted in FY23, when crude oil and commodities’ prices spiked after the outbreak of the Russia-Ukraine war. Apart from higher logistics costs, suppliers of cast/ forged and plastic parts are dependent on crude derivatives and generally pass on cost inflation back to OEMs like Maruti. Since we are in a similar situation today, reading the FY23 annual report would give meaningful perspective.
We uploaded the annual report into NotebookLM, a Google product. The USP of this product is that it largely sticks only to the documents uploaded to generate its answers and also gives citations. We learnt that the company did undergo commodity cost pressures. Yet, it managed to expand its EBIT margin from 3.5 per cent in FY22 to 7.3 per cent, driven by operating leverage (19 per cent volume growth) and calibrated price hikes.
Now, going into FY27, can FY23 repeat itself for Maruti? Back then in FY22, sales volume was impacted due to the semiconductor shortage, giving the company a low base to work with in FY23. The same cannot be said about FY27, as OEMs have had a good year in FY26 post the GST cuts. Hence, to protect margin, the company is left with the sole option of hiking prices/ scaling discounts back. This leaves us with closely tracking price hikes and any resultant impact on demand as key monitorable.
For earnings call transcripts, readers can use Perplexity Finance, where transcripts of the recent 10 quarters are readily available (under ‘Earnings’ tab). It also segregates them into topics. You can choose a topic from the drop-down list. For instance, the management’s prepared remarks, platform synergies and scaling, margins and risks in modules and polymers segment, strategy for aerospace and semiconductor business are some of the topics we found in Samvardhana Motherson’s Q3 FY26 earnings call.
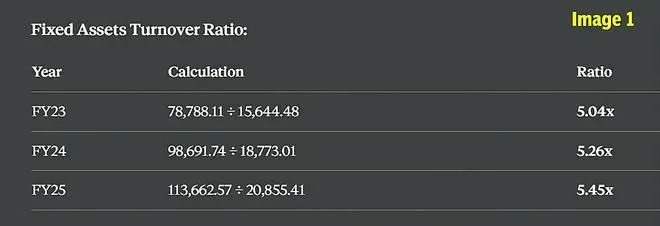
Here’s another extrapolated use-case. Some ratios such as EBITDA margin and fixed assets turnover ratio are not readily available in quarterly earnings releases. You can just upload those PDFs into the AI model of your choice and get them calculated in a jiffy. We prompted Claude to calculate fixed assets turnover ratio of Samvardhana Motherson for FY23-25. The screenshot of the output can be found in Image 1.
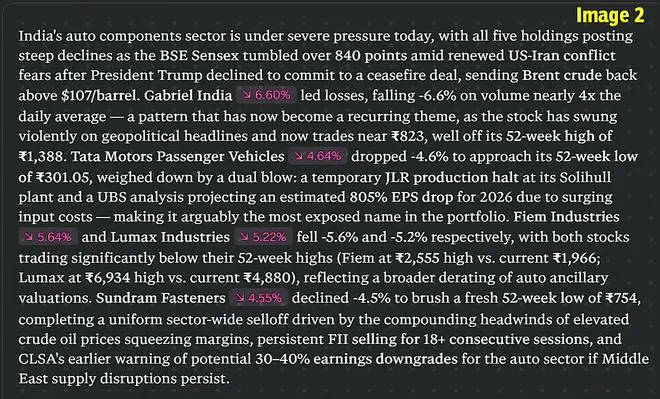
It is not practical for retail investors to watch the market through the day. Perplexity Finance and Google Finance (Beta) can help solve this to an extent. Once trading for the day closes, you can get a summary of how your stocks performed. All you need to do is create a custom watchlist. While Perplexity gives you a readymade summary (under ‘Watchlist’ tab), you will need a prompt to do the same on Google Finance (Beta). We had created a watchlist with stocks from the auto sector on Perplexity Finance. A screenshot of the market brief for March 27 is given for reference (see Image 2).
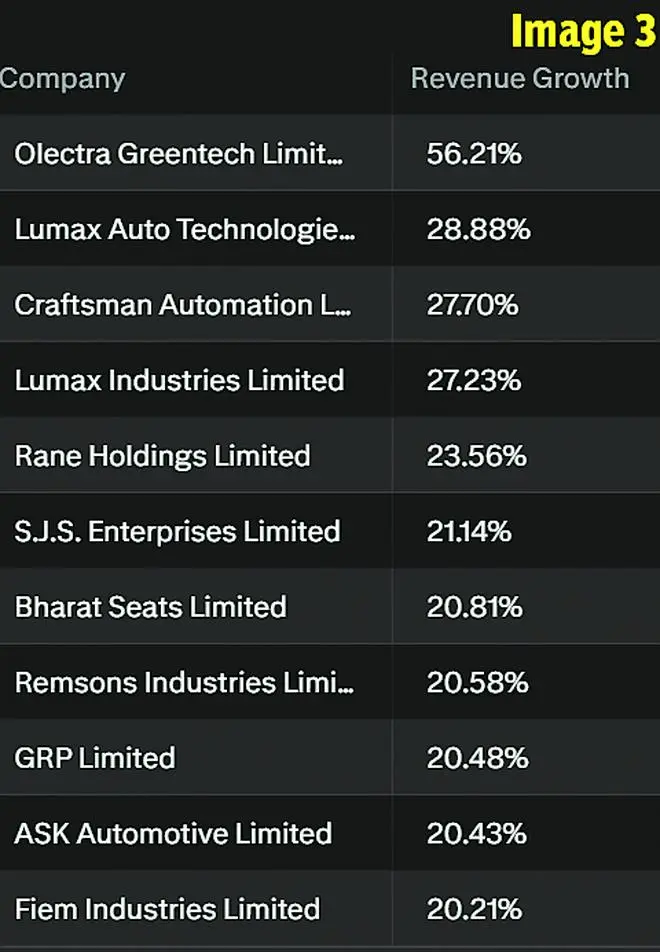
Building screeners to filter stocks is inevitable in bottom-up investing. Though there are free screeners available online, they work with fixed syntaxes. It takes some time to learn how exactly they work and would be difficult for some investors who may not be savvy enough. For this specific use-case, an investor can use the ‘Screener’ feature of Perplexity Finance. It lets you frame your conditions/ parameters in natural language itself. Here is a simple screener we tried. To identify fast growing auto ancillary stocks, we gave the following prompt. The output is given in Image 3.
Prompt: Filter auto ancillary companies that had revenue growth of over 20 per cent in FY25
If you prefer the discounted cash flows (DCF) model for valuation decisions, AI tools can handle that too. Simply put, under DCF method, future free cash flows are discounted for time value to estimate an investment’s worth. The method requires you to assume values for the variables involved and the model itself is only as good as the logical accuracy of the assumptions. But once done with this step, you can use any of the AI models to run simulations. This use-case could very well find favour with investors who may not be familiar with spreadsheets.
Prompt:
Calculate Infosys’ market value of equity per share using discounted cash flow model. Also indicate if there is any upside left from current market price of ₹1,275.
Assume the following variables.
Free cash flow to firm (FCFF) for FY26 = ₹30,000 crore.
FCFFs to grow at 5 per cent between FY27 and FY30.
Perpetual growth rate for FCFFs at 2 per cent.
The company is net-debt free and so, cost of debt can be taken as nil.
For cost of equity, assume risk free rate at 4.4 per cent, equity risk premium at 7.1 per cent and beta of 0.9 times.
Number of shares outstanding at 406 crore.
We replicate the output in short here, without the calculation steps.
Output: Expected per-share equity value = ₹951
At current price, there is no margin of safety. Instead, the market price is about 34 per cent above the DCF‑derived intrinsic value.
Readers can play around with the same prompt by altering variables to simulate a bull case, a bear case and a neutral case.
We have barely scraped the surface in this story, and we admit that the possibilities are endless. However, the technology is in its infancy and has some rough edges to be smoothened. Once you decide to adopt AI for your finances, you should thoroughly know its limitations as your portfolio may be one hallucination away from disaster. Here are some of the limitations we observed during our short time testing the models.
Charts with valuation multiples (P/E, P/B for example) in a time-series are really useful. A P/E time-series, based on daily prices, is a classic example. Such charts help put current valuations in perspective, relative to the past. We tried building a daily P/B chart for SBI with Perplexity. What we got instead was a P/B chart as of financial year-ends, also not without errors (see Image 4).
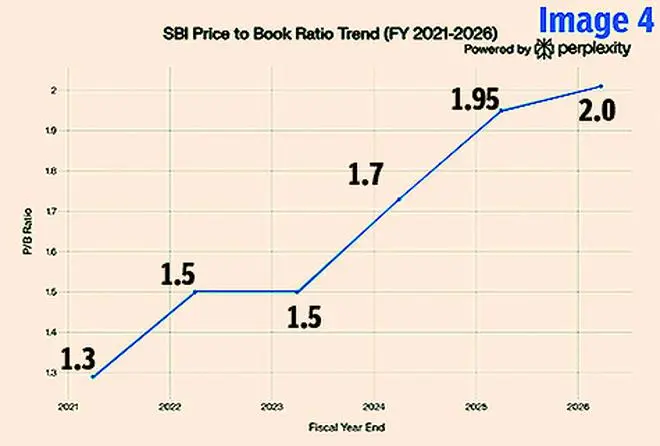
Note that while P/B values for FY21-24 are largely accurate, that of FY25 and the current P/B are not. Actual P/B ratio as of FY25 end is 1.4x and the current P/B ratio is 1.6x – which are 2x, according to Perplexity..
Next, we tried comparing revenue growth (year on year) of TCS, Infosys and HCLTech over the last four quarters. Perplexity does have quarterly financial data under the ‘Financials’ tab. Ideally, the model should have picked up data from here to build the output table. Instead, it tapped web sources to do it. This meant some values were incorrect (see Image 5).
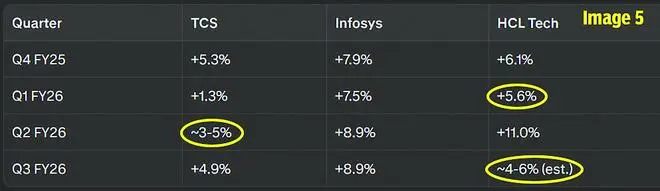
Note that TCS’ revenue in Q2 FY26 actually grew 2.4 per cent and HCLTech’s revenue grew 8.2 per cent and 13.3 per cent in Q1 FY26 and Q3 FY26 respectively.
Next, take a look Image 3 again. It includes Olectra Greentech, which is an OEM and not a supplier of auto components.
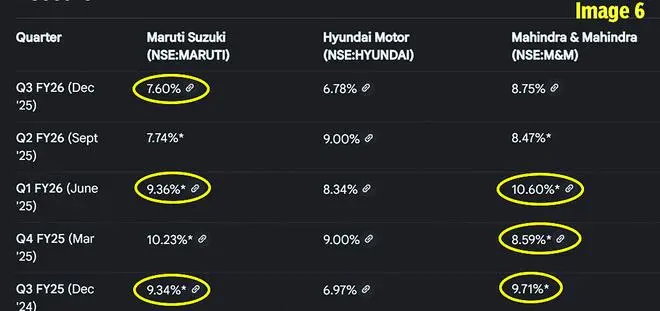
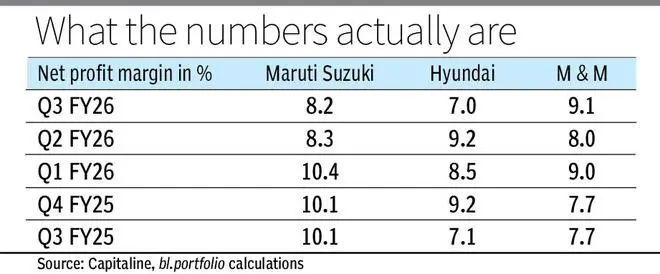
Moving on, we tried prompting Google Finance (Beta) to compute net profit margin of Maruti Suzuki, Hyundai and Mahindra & Mahindra for the last five quarters. Similar to Perplexity, Google Finance too, natively houses quarterly financial data. However, it sourced data from web sources to build the output table. Though some numbers come close to actuals, some differ widely (see Image 6 along with the infographic table).
Similarly, other niggles do exist. However, for the use-cases we mentioned earlier and beyond, AI is too powerful a tool for retail investors to not take advantage of. We suggest readers to use these AI platforms as a supplementary source in their regular course of investing and keep experimenting until more effective, reliable workflows are discovered.
Attribution to AI products in the story are meant neither as endorsements nor as criticisms
Published on March 28, 2026
此内容由惯性聚合(RSS阅读器)自动聚合整理,仅供阅读参考。 原文来自 — 版权归原作者所有。