












More than ten years after the launch of Make in India, manufacturing continues to sit at the core of India’s development strategy. The objective, to increase manufacturing’s share in GDP from 15-16 per cent to 25 per cent, has been consistently reaffirmed through policy frameworks, industrial corridor initiatives, and Production Linked Incentive (PLI) schemes across 14 sectors. Substantial fiscal resources and regulatory focus have been committed to achieving this target. Yet, a fundamental contradiction persists: the country still measures manufacturing activity with considerable delay.
India’s most detailed manufacturing dataset, the Annual Survey of Industries (ASI), is released with a lag of 18-24 months. Manufacturing Gross Value Added (GVA), as reported in the National Accounts Statistics (NAS), becomes available nearly a year after the reference period and is subject to multiple revisions. At the State level, these estimates are published even later. While the Index of Industrial Production (IIP) provides monthly updates, it remains an imperfect proxy due to limited coverage, high volatility, and persistent measurement concerns. For a country aspiring to be globally competitive in manufacturing, this creates a significant information deficit.
At the same time, India already collects a high-frequency, reliable indicator that spans States and sectors: electricity consumption. The relevant question is no longer whether electricity can serve as a proxy for manufacturing activity, but whether it can be systematically integrated into economic measurement.
A clearer signal
Manufacturing is inherently energy-intensive. Electricity powers machinery, assembly lines, and production processes. Unlike variables such as labour utilisation or capacity use, which are difficult to observe directly, electricity consumption is continuously metered, difficult to misreport, and available at high frequency, often monthly or even daily, with granular geographic and sectoral detail.
This relationship is supported by global evidence. During the Covid-19 pandemic, studies across Europe demonstrated that electricity demand closely tracked economic contraction and recovery when official data lagged. In China, sectoral electricity consumption mirrored factory shutdowns during lockdowns and rebounded ahead of official statistics during reopening phases. Similar findings emerge from developing regions: studies in West Africa, including Nigeria, show a statistically significant long-term relationship between electricity use and industrial output.
The empirical case from India
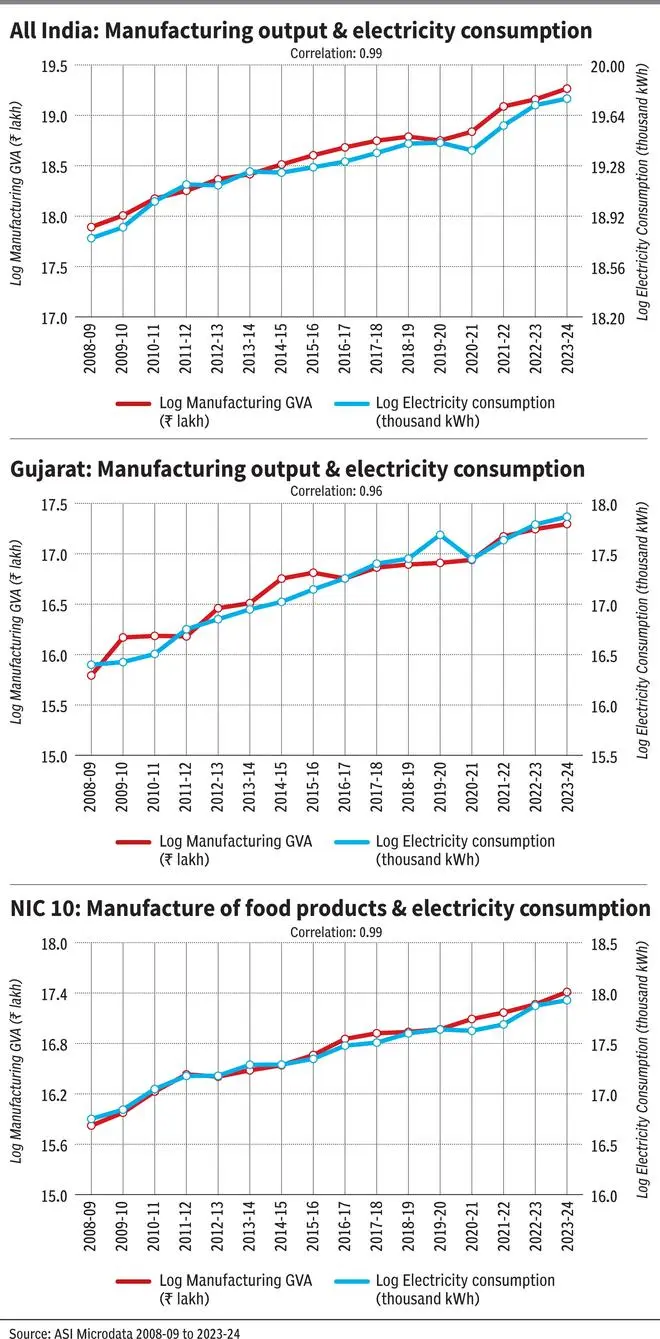
Indian data reinforce this global pattern. Over the past 15 years, manufacturing GVA and electricity consumption at the national level have moved almost perfectly together, with a correlation of 0.99. This relationship remains robust across policy shifts, economic cycles, and even the disruptions caused by the pandemic.
However, moving beyond correlation to real-time estimation requires a structured econometric approach. Electricity consumption data, particularly from industrial feeders and high-tension manufacturing connections already recorded by State discoms, can be mapped to industries classified under the National Industrial Classification (NIC). Aggregated at weekly or monthly intervals across States and sectors, and adjusted for scale, industrial composition, and long-term trends, such data can form the basis of a model that generates early signals of manufacturing activity, well before official GVA figures are released.
State-level patterns
This relationship also holds at the subnational level. Gujarat, with its strong manufacturing base, reliable power supply, and dense industrial clusters, provides a clear example, showing correlations close to 0.96. Similar patterns are observed in other manufacturing-intensive States such as Maharashtra, Karnataka, and Uttar Pradesh, where correlations remain around 0.9.
Sectoral insights
At the sectoral level, the relationship becomes even more compelling. Industries such as food processing, pharmaceuticals, automobiles, chemicals, rubber and plastics, machinery, and fabricated metal products show correlations exceeding 0.9.
Food processing offers a particularly strong case. As a labour-intensive sector closely tied to agriculture, it plays a critical role in employment, inflation management, and exports.
Here, electricity consumption closely tracks output trends over time, including during the recovery phase after the pandemic. Under Make in India, the PLI scheme allocates ₹10,900 crore to food processing to expand capacity and boost production in segments such as ready-to-eat foods, processed fruits and vegetables, and marine products. For a policy agenda focused on jobs and value addition, this is especially relevant.
In contrast, electricity consumption is a weaker indicator in sectors like repair and installation services, where output is more service-oriented.
What needs to change now
Leveraging electricity data as a real-time proxy for manufacturing requires coordinated institutional action. The Ministry of Statistics and Programme Implementation (MoSPI) should lead this effort by establishing an expert group to design the measurement framework, including data architecture and standardised indicators.
This initiative must involve the Central Electricity Authority (CEA) and State discoms, which already collect detailed consumption data but do not maintain systems designed for statistical integration.
Clear, standardised guidelines from the CEA would enable consistent mapping of electricity usage to industrial activity (by NIC classification) and ensure comparability across States.
States would also need support to link electricity connection data with administrative factory records maintained by Chief Inspectors of Factories. Over time, such integration could strengthen the ASI sampling frame and improve coverage of smaller and under-represented enterprises, particularly MSMEs.
As India transitions towards cleaner energy and improved efficiency, electricity intensity may evolve. Nevertheless, electricity demand will continue to reflect industrial cycles. In this context, the direction and timing of change are often more important than absolute levels.
Make in India is ultimately about building factories, creating jobs, and enhancing competitiveness. Continuing to measure manufacturing performance with a lag of nearly two years is no longer viable. Faster, data-driven signals are not just desirable — they are essential.
Kumar is President, and Seth is Head, Center of Data for Economic Decision-making (CoDED) at Pahle India Foundation
Published on April 21, 2026