





The new national accounts, or GDP, series with 2022-23 base year raises the question of whether the deflators being used are accurate. Inaccuracies on account of the use of the wholesale price index with an outdated base year seem to persist in the new series.
The new NAS series 2022-23 uses double deflators, against single deflators in the NAS 2011-12 series. The issue of appropriate deflators, however, persists, principally on account of the WPI effect.
NAS series 2022-23, like the earlier NAS series, uses WPI and CPI as deflators for different commodities. WPI is used as deflator for over 50 per cent of NAS value added. WPI is a commodity index with base 2011-12. It has fixed basket and fixed base. It loses its representative character once it gets dated.
Various studies on Index of Industrial Production, which too has fixed base and fixed basket, have demonstrated a downward bias in growth rates once the series becomes dated. Such index series should be revised every five years and the change should become effective as early as feasible. There are no such studies for WPI because alternative measures with whom the characteristics could be compared are not available.
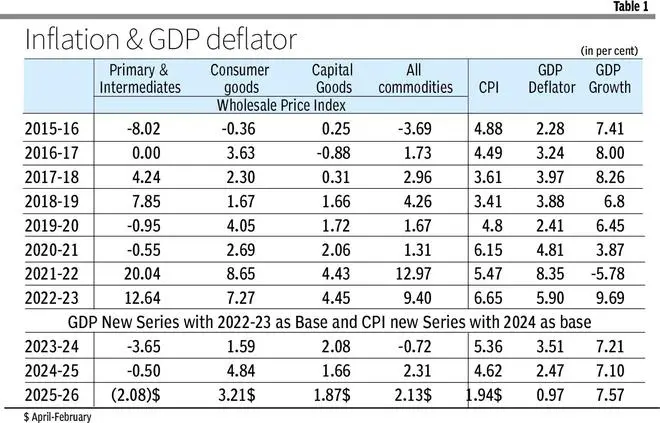
We, however, use two approaches to consider the representativeness of WPI. First, we compare the GDP deflator with sub groups of WPI and CPI since 2015-16, the year of beginning of structural changes in economy (table 1).
WPI trends
WPI for all commodities has remained moderate from 2015-16 to 2020-21, the period which witnessed demonetization, GST reforms and pandemic. The GDP deflator during this period remained somewhere between WPI and CPI.
However, in 2017-18, GDP deflator was higher than both WPI and CPI; in 2018-19, it was between CPI and WPI. The deflator is perhaps influenced more by WPI for primary articles and intermediates, in relation to final products. The same appears to be true in the new series of NAS and CPI. There may be significant under-reporting of inflation for capital goods and consumer goods vis-a-vis primary articles.
Sticky capacity utilization confirms that product life cycle for consumer products has shortened with constant replacement. If that is correct, WPI may have become less representative.
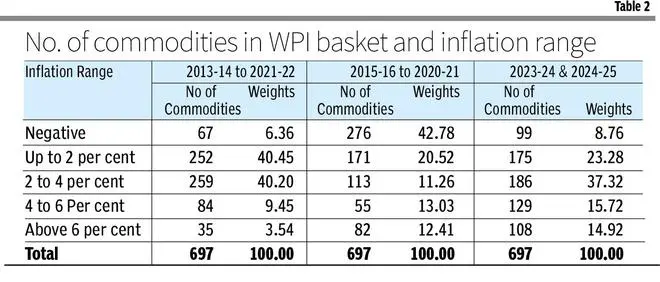
The range of inflation for overall basket of WPI for selected years (table 2) is revealing. The number of commodities with inflation below 2 per cent increased to 447 in 2025-26 (April-February). They have a weight of around 63 per cent during 2015-2021, the years of structural volatility, much higher than in last two years or earlier period from 2013-2022. A similar bias appears in 2025-26. This points to the fact that commodity composition is gradually shifting away from being representative with decline in response rate, or a repeat of previous quotations.
Inflation dynamics
The increasing number of commodities with negative inflation may be largely due to the product having ceased to report. The new GDP series (2022-23) also coincides with an increase in number of commodities with inflation higher than the benchmark range of RBI under inflation targeting.
Yet, during April February 2025-26, 526 commodities having weight of 93 per cent had inflation up to 2 per cent, while 277 commodities with weight exceeding 53 per cent had negative or zero inflation. This indicates that WPI, the key deflator for NAS, has become less representative.
Consequently, the real GDP growth was just marginally lower than the nominal GDP growth and deflator fell to an historic low of less than 1 per cent.
The new series of WPI should get into operation quickly. WPI should be replaced by a comprehensive PPI. This would solve the problem of appropriateness of the commodities and deflators. Till such time, the new NAS series will continue to be not fully reflective of actual growth.
Gopalan is former Secretary, Economic Affairs, and Singhi is former Senior Economic Adviser, Ministry of Finance. Views expressed are personal
Published on April 20, 2026