


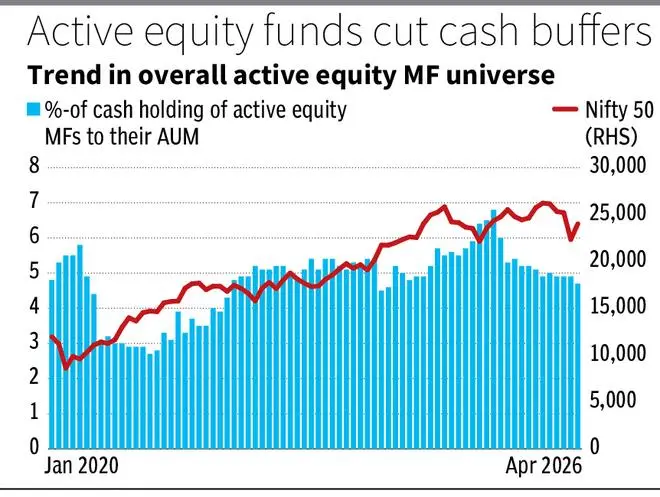
Active equity mutual funds have sharply cut their cash buffers over the past year. Cash holdings fell from ₹3 lakh crore in April 2025 to ₹1.68 lakh crore in April 2026, while cash as a share of active equity fund AUM declined from 6.8 per cent to 4.7 per cent. This matters because cash levels offer a useful, though sometimes imperfect, signal of fund managers’ risk appetite, valuation comfort and market positioning.
bl.portfolio analysed the cash holdings of 577 actively-managed equity-oriented schemes, including diversified, sectoral and thematic funds, between April 2025 and April 2026. This was done to understand how managers positioned portfolios amid volatile market conditions, including the US tariff shock, West Asia conflict-related risk and uneven market performance across large-, mid- and small-cap segments.
Sustained retail flows have provided steady liquidity, with SIP (systematic investment plan) inflows averaging nearly ₹29,500 crore a month over the last one year.
For market context, in the one-year period ended May 15, 2026, the Nifty 50 TRI (includes dividends) declined 4.5 per cent. In contrast, the Nifty Midcap 150 TRI gained 8 per cent, the Nifty Smallcap 250 TRI rose 4 per cent and the Nifty Microcap 250 TRI advanced 2 per cent.
The nearly 2 percentage point decline in cash as a share of active equity fund AUM marks a clear reversal from April 2025, when cash levels were at a six-year high.
Elevated cash holdings usually coincide with market uncertainty, rich valuations or heavy inflows awaiting deployment. The April 2025 spike likely reflected caution after a strong market run and valuation concerns.
The subsequent fall in both absolute cash and cash as a share of AUM suggests that funds deployed part of their liquidity buffers. This could be either due to improving conviction or the need to reduce cash drag, where uninvested money hurts returns when markets rise.
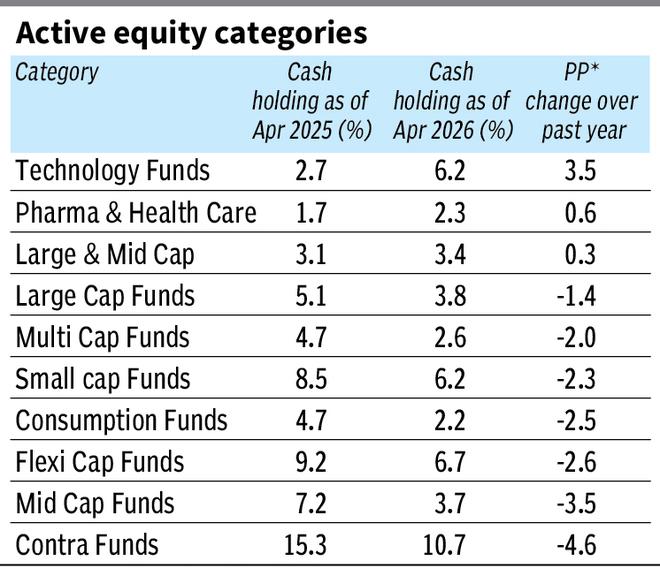
Among diversified equity categories, mid-cap, small-cap, flexi-cap and value funds saw significant reductions in cash holdings over the year.
Mid-cap funds reduced cash holdings by over 3.5 percentage points, while flexi-cap and small-cap funds cut cash by over 2.6 percentage points and 2.3 percentage points, respectively.
Contra funds also saw a steep fall of more than 4.6 percentage points, showing that even strategies built around selective, out-of-favour opportunities reduced liquidity buffers.
However, some sectoral categories moved in the opposite direction. Technology and pharma & healthcare funds increased cash buffers, with technology funds alone seeing a rise of over 3.5 percentage points. This divergence suggests greater caution in sectors exposed to global demand, currency movements, regulatory risks or valuation uncertainty.
Within thematic funds, several sub-categories saw notable reductions in cash allocations. Funds focused on rural opportunities and housing reduced cash meaningfully. In contrast, themes such as commodities and manufacturing saw a marginal increase in cash, suggesting some caution in more cyclical pockets.
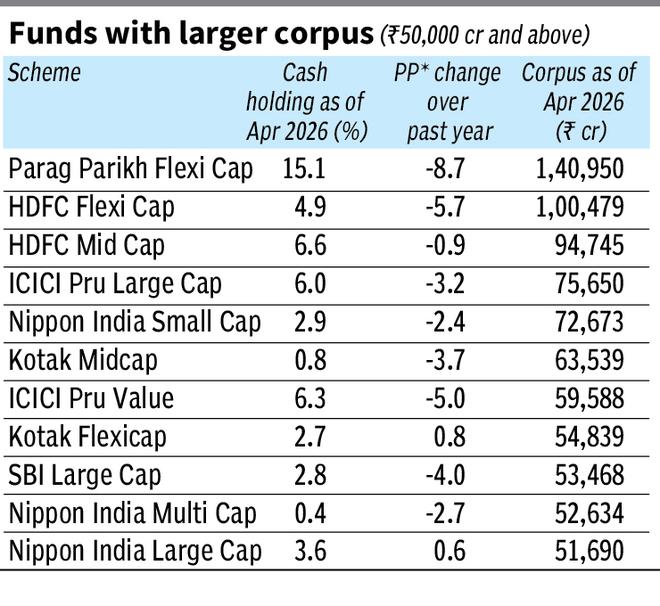
The trend was visible even among schemes with assets exceeding ₹50,000 crore.
Nine of the 11 large schemes saw cash levels decline over the past year. Parag Parikh Flexi Cap reduced cash holdings from nearly 24 per cent to 15 per cent, while HDFC Flexi Cap cut its allocation by over 5.6 percentage points. Large-cap funds from ICICI Prudential and SBI also reduced liquidity positions significantly.
For large schemes, cash management is also shaped by liquidity considerations, as deploying or exiting large positions can be harder, especially outside the most liquid large-cap names. Therefore, lower cash levels may signal greater willingness to participate in the market, but also the pressure on funds to avoid prolonged cash drag when peers may be deploying capital.
Despite the overall decline, some schemes continued to hold elevated cash positions, suggesting differentiated strategies rather than an uniform industry stance.
Value-oriented schemes such as DSP Value held over 18 per cent cash, while contra strategies such as SBI Contra Fund maintained allocations above 15 per cent.
Flexi-cap funds such as Parag Parikh also retained relatively high cash levels even after reducing cash year on year.
Such elevated cash holdings need not reflect caution alone. In value and contra strategies, cash may reflect valuation discipline, while in fast-growing schemes it may also represent recent inflows awaiting deployment.
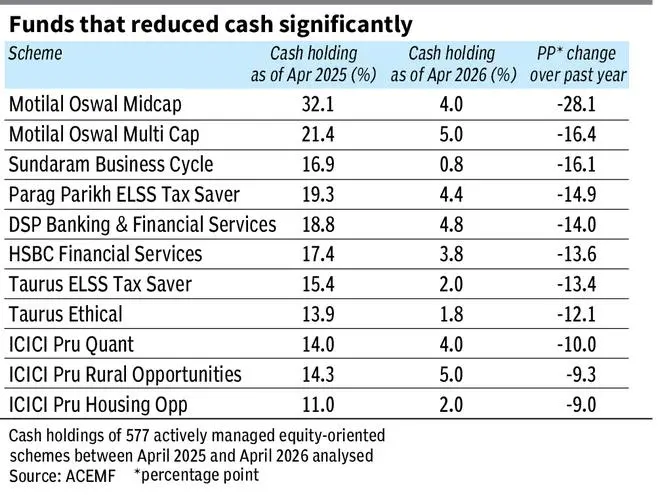
Among schemes that sharply reduced cash levels over the year, Motilal Oswal Midcap cut its cash allocation from over 32 per cent to just 4 per cent, a reduction of more than 28 percentage points.
Motilal Oswal Multi Cap and Sundaram Business Cycle also reduced cash by over 16 percentage points each. Such sharp changes should be read fund by fund.
The broader point is that many active managers appear to have cut cash drag, especially as mid- and small-cap segments delivered positive returns despite large-cap weakness.
For investors, lower cash is a two-sided signal. It helps funds participate better when markets recover, but leaves them with less ready money to buy stocks during corrections.
Cash levels should not be read mechanically. High cash may reflect valuation discipline, recent inflows or liquidity management. Low cash may reflect conviction, cash-drag concerns or the need to stay close to benchmarks.
Unutilised cash is not idle. It is usually parked in TREPS (Tri-Party Repo Dealing System) and other short-term instruments, so that funds still earn some return while waiting to invest. TREPS annualised yields have ranged between 3.1 per cent and 7 per cent over the last five years.
Cash levels are therefore useful, but not decisive. They must be read with the fund’s mandate, valuation style, flows, market-cap exposure and long-term performance.
Published on May 16, 2026
此内容由惯性聚合(RSS阅读器)自动聚合整理,仅供阅读参考。 原文来自 — 版权归原作者所有。