









GDP: Old vs new series | Photo Credit: Khanchit Khirisutchalual
The year 2026 witnessed the much-anticipated release of the new GDP series with an updated base year. The initial exuberance surrounding the new series, however, has gradually given way to some trepidation over the emerging growth scenario.
India was projected as an emerging economic $4-trillion powerhouse. However, the new GDP series, presumably closer to on-ground economic realities, raises the question of whether the actual data tells a different story. Accounting for the low nominal GDP and sustained depreciation, have we overestimated the GDP till now?
On February 27, the Ministry of Statistics and Programme Implementation (MoSPI) officially released the new GDP series with a base year of 2022-23. This series replaces the previous 2011-12 base year to better reflect the current economic structure.
This series revision is significant and timely, as recently the IMF’s 2025 Article IV report downgraded India’s National Accounts Statistics to C category. The new series indeed addresses many concerns regarding the methodological rigour, data availability and data quality, specifically due to an outdated base year. To begin with, the MoSPI released the aggregate data for four years: 2022-23 to 2025-26.
While the new series shows some interesting features, it also throws up challenges. The data clearly show that the old series was consistently overestimating nominal GDP by around 3-4 per cent (Table 1).
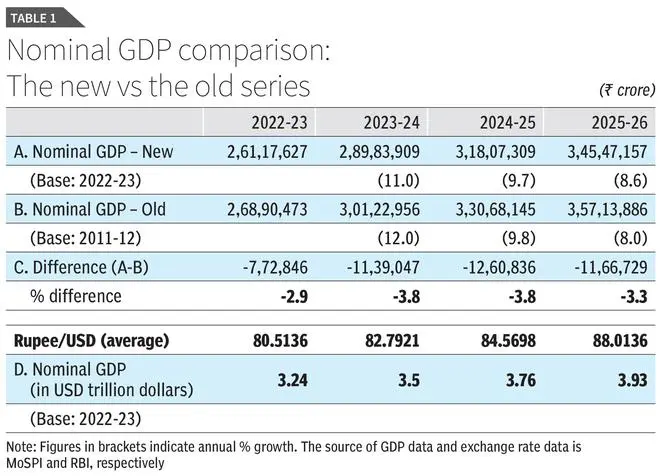
Besides methodological changes like the shift to double deflation (MOSPI, year-end review 2025), the new series uses extensive data from annual surveys such as the Annual Survey of Unincorporated Sector Enterprises (ASUSE) and the Periodic Labour Force Survey (PLFS) and integrates administrative data to capture the sectors contributions accurately (MOSPI, 2025). Further, the use of a mixed methodology by combining Household Consumer Expenditure Survey, production and administrative data, and the commodity flow approach provided robust consumption estimates. This has led to a clearer picture emerging of the actual contributions made (both income and expenditure side), which however bares the consistent overvaluation (Table 1).
We examine this downward revision by comparing new and old nominal GDP, separately for expenditure approach and value-added (production) approach and we do find a systematic pattern.
The old series overestimated the nominal consumption data consistently, by a whopping 10-12 per cent (Table 2). It also revised the investment data upward, roughly by 1-2 per cent. The new series in a way reaffirmed the subdued nature of Indian consumption story in the aftermath of Covid pandemic.

Is the downward reset of aggregate GDP uniformly spread across major sectors? No, here again we find a systematic pattern. The tertiary sector, mainly the services which accounts for over 56 per cent of the economy, witnessed a massive downward revision to the tune of 7-8 per cent (Table 3).

On the other hand, the primary sector comprising mainly agriculture and related activities had an upward revision in the range of 4-6 per cent. With the tertiary sector being the mainstay of the Indian growth story, and secondary showing a below optimum growth, this is worrying.
First, the size of economy has taken a sharp dip. With rupee depreciating sharply from ₹80/USD to ₹88/USD (see table 1) and simultaneously the downward revision of nominal GDP, India’s GDP in dollar terms has grown really sluggishly during 2022-23 to 2025-26.
Based on average rupee/USD exchange rate, India’s economy has grown from $3.24 trillion to $3.93 trillion (Table 1).
In four years’ time, it has expanded by $0.69 trillion. Note that the pace of expansion has slowed down considerably during 2025-26 due to unprecedented depreciation dynamics. With increasing geo-political tensions, ongoing wars and Trump’s tariff tantrums, depreciation pressure is likely to intensify.
The following implications emerge:
First, it needs to be acknowledged that making India $30 trillion by 2047 is becoming difficult.
Second, methodological issues need to be highlighted to understand the caveats to the growth narrative. If the imputation of performance of organised sector for unorganised sector was a source of overestimation, then nominal GDP during Covid times would be even smaller as the effect was disproportionately higher for unorganised sectors.
Third, while we largely consider the dynamics of nominal GDP here, the confounding observation of nominal GDP shrinking and real GDP booming deserve attention: this must be linked to the dynamics of GDP deflator. Notwithstanding double deflation methods (by definition the use of different deflators for outputs and inputs), in absence of sector specific price indices (particularly for services), we continue to use a mix of CPI and WPI.
Therefore, if the WPI usage is relatively higher for inputs adjustment, real GDP estimate would be mechanically higher as WPI inflation during last few years has been subdued. This point, in fact, is being raised for some time now (see Subramanian 2019, and Anand, Felman, & Subramanian 2026).
Finally, deceleration in nominal GDP needs to be looked at from the point of firm level dynamics, examining trends in nominal sales and pricing behaviour to suggest what ails growth.
Das is ICICI Bank Chair Professor, Indian Institute of Management Ahmedabad (IIM-A) and RoyTrivedi is Associate Professor, National Institute of Bank Management (NIBM). Views expressed are personal
Published on April 17, 2026
此内容由惯性聚合(RSS阅读器)自动聚合整理,仅供阅读参考。 原文来自 — 版权归原作者所有。