惯性聚合 高效追踪和阅读你感兴趣的博客、新闻、科技资讯
阅读原文 在惯性聚合中打开

推荐订阅源

H
Help Net Security
博客园 - Franky
GbyAI
GbyAI
Threat Intelligence Blog | Flashpoint
爱范儿
爱范儿
IT之家
IT之家
酷 壳 – CoolShell
酷 壳 – CoolShell
aimingoo的专栏
aimingoo的专栏
博客园_首页
MongoDB | Blog
MongoDB | Blog
CTFtime.org: upcoming CTF events
Recent Announcements
Scott Helme
Scott Helme
有赞技术团队
有赞技术团队
M
MIT News - Artificial intelligence
C
CERT Recently Published Vulnerability Notes
K
KPMG report finds enterprise disconnect between AI and its ROI | CIO
Jina AI
Jina AI
F
Fortinet All Blogs
N
Netflix TechBlog - Medium
L
LangChain Blog
L
LINUX DO - 最新话题
OSCHINA 社区最新新闻
OSCHINA 社区最新新闻
cs.AI updates on arXiv.org
H
Hacker News: Front Page
MyScale Blog
MyScale Blog
P
Palo Alto Networks Blog
G
Google Developers Blog
Google DeepMind News
AI
AI
T
Troy Hunt's Blog
Microsoft Azure Blog
阮一峰的网络日志
阮一峰的网络日志
cs.CL updates on arXiv.org
Vercel News
Vercel News
Microsoft Security Blog
罗磊的独立博客
S
Secure Thoughts
大猫的无限游戏
大猫的无限游戏
博客园 - 叶小钗
人人都是产品经理
人人都是产品经理
Blog — PlanetScale
Blog — PlanetScale
博客园 - 司徒正美
Apple Machine Learning Research
钛媒体:引领未来商业与生活新知
钛媒体:引领未来商业与生活新知
博客园 - 三生石上(FineUI控件)
S
Security @ Cisco Blogs
Cloudbric
Cloudbric
E
Exploit-DB.com RSS Feed
Attack and Defense Labs

博客园 - 行进中开火

转载:EBS上用过的一些接口表整理信息 注释还是不注释,这是个问题 如何提升工作中的影响力 与客户“调情” 外包的烦恼 软件开发外包管理的“一二四” 如何在 SQL 服务器中设置到 Oracle 的链接服务器并进行故障排除 linux下mysql 启动问题 linux下编译GD(freetype+libjpeg+libpng+gd-devel) asp.net连接Mysql(connector/net 5.0) 图解:理解样式表的逻辑 - 行进中开火 - 博客园 用户体验这点事儿 外包管理注意“小事情” 项目外包软件项目管理之我见 Moving SQL Server 2005 Databases to SQL Server 2000 转:我对SOA的认识以及心得 从LiveJournal后台发展看大规模网站性能优化方法 jquery技巧总结 sql server系统表详细说明
简单的SQL Server性能调优 - 行进中开火 - 博客园
行进中开火 · 2009-02-16 · via 博客园 - 行进中开火

目的是查看系统(应用程序+数据库)调用SQL Stored Procedure存储过程和SQL语句的性能,查出哪儿慢?哪个存储过程最耗用时间?

1. 打开Profiler:

    "Start - Programs - SQL Server2005 -  Performance Tools - Sql Server Profiler"

2. 点击工具栏第一个button - "New Trace..."

3. 在第一个Tab : General中打勾 "Save to table", 输出到表。

    在弹出的窗口中选择master数据库, 表名随意,例如jq

4. 在第二个Tab : Events Selection中,不要选择Security安全和Session部分,只选择存储过程和SQL。

5. 点击RUN。

如果出现错误:“only TrueType fonts are supported. There id not a TrueType font”,则在Profiler的 Tools菜单->Options中选择"Choose Font..."选择其他字体即可。

6. 开始监控后,启动Application,运行多久随意,可以监控高峰时段也可以。监控结束后,点击Stop。


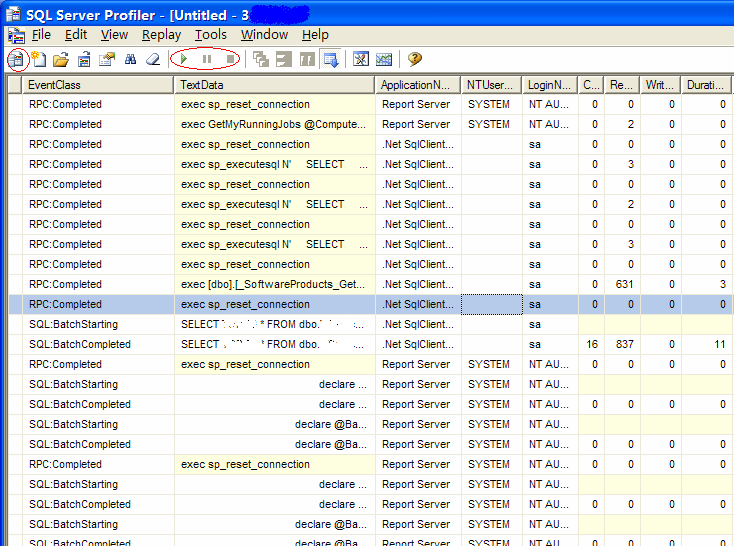
7. 打开SQL Server management studio, 链接到master数据库,输入sql语句:

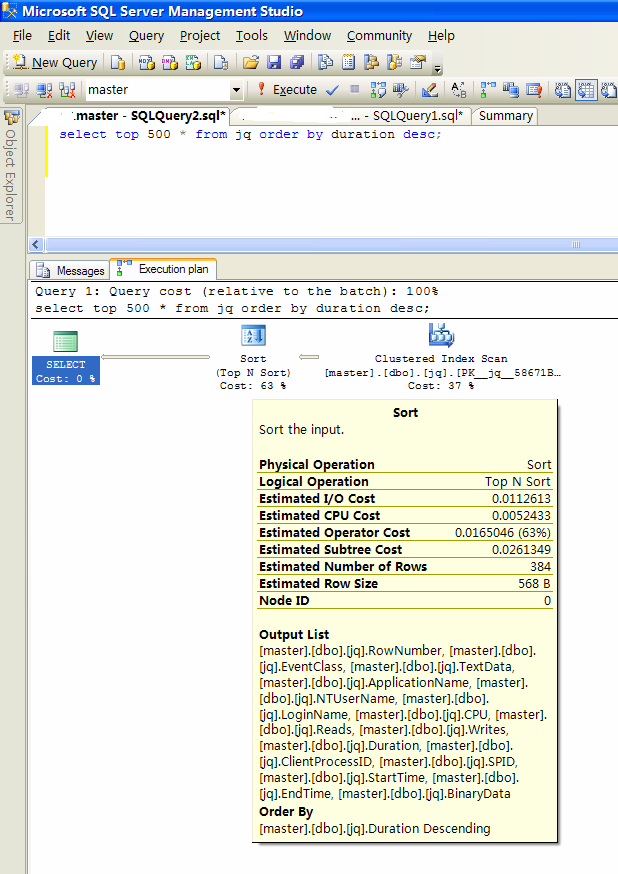
    select top 500 * from jq order by duration desc;

8. 可以看到耗时最久的存储过程。接下来具体分析每个存储过程的SQL语句。

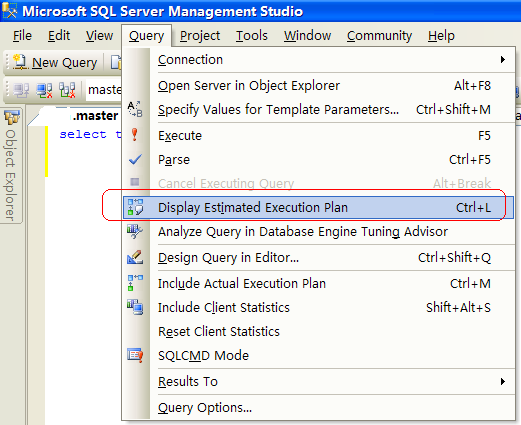
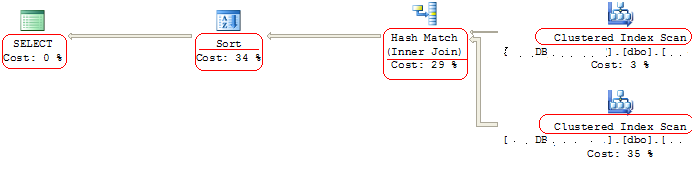
    可以通过执行计划( Execution Plan )来检测。

    菜单:"Query" - "Display Estimated Execution Plan."


9. 修改SQL语句并调优,重复以上步骤。