


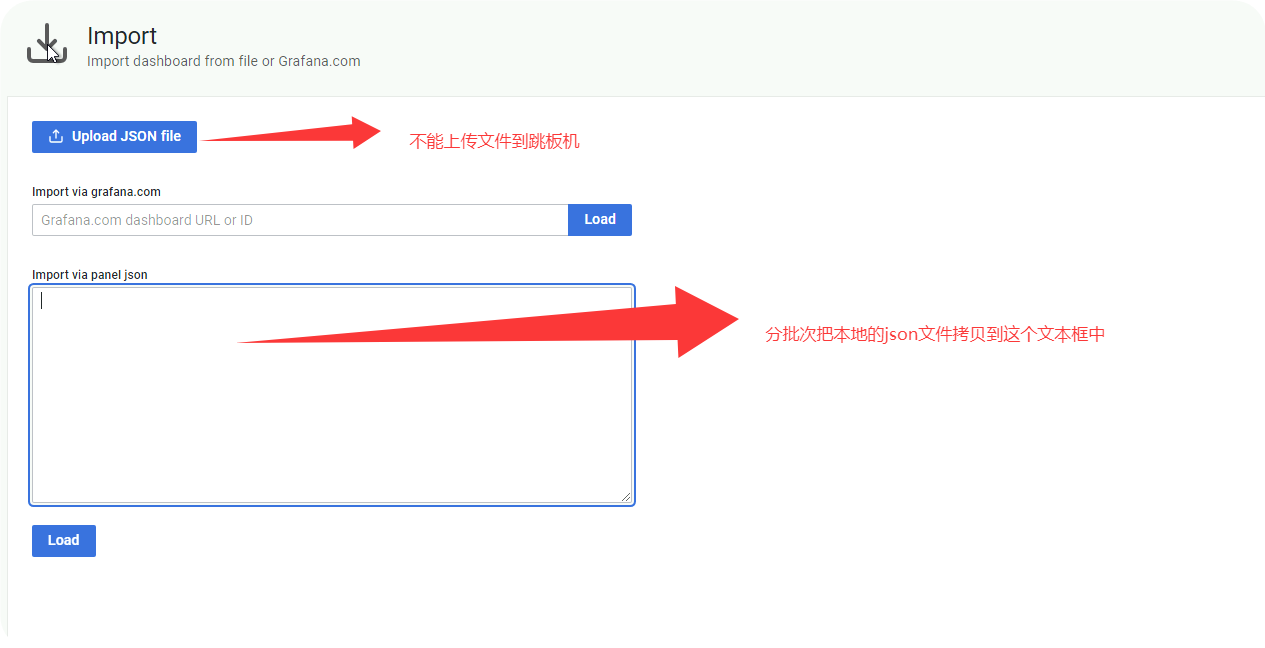
json文件无法上传到跳板机,同时拷贝数据的长度也受到了限制

[root]# cat node.ini
[program:nodeexporter]
command=/app/taishi/monitor/node_exporter-1.9.1.linux-amd64/node_exporter
environment=PATH="/app/taishi/bin:%(ENV_PATH)s"
priority=10
process_name=%(program_name)s
user=cloudadmin
redirect_stderr=true
stdout_logfile_maxbytes=1000MB
stdout_logfile_backups=10
stdout_logfile=/app/taishi/logs/node_supervisord.log
View Code
[root]# cat elasticexporter.ini
[program:esexporter]
command=/app/taishi/monitor/elasticsearch_exporter --es.all --es.indices --es.cluster_settings --es.indices_settings --es.shards --es.snapshots --es.timeout=10s --web.listen-address=":9114"  --web.telemetry-path="/metrics" --es.ssl-skip-verify --es.uri="https://elastic:Transfar@172.16.27.21:9200"
environment=PATH="/app/taishi/bin:%(ENV_PATH)s"
priority=10
process_name=%(program_name)s
user=cloudadmin
redirect_stderr=true
stdout_logfile_maxbytes=1000MB
stdout_logfile_backups=10
stdout_logfile=/app/taishi/logs/elastic_supervisord.log
esexporter.ini

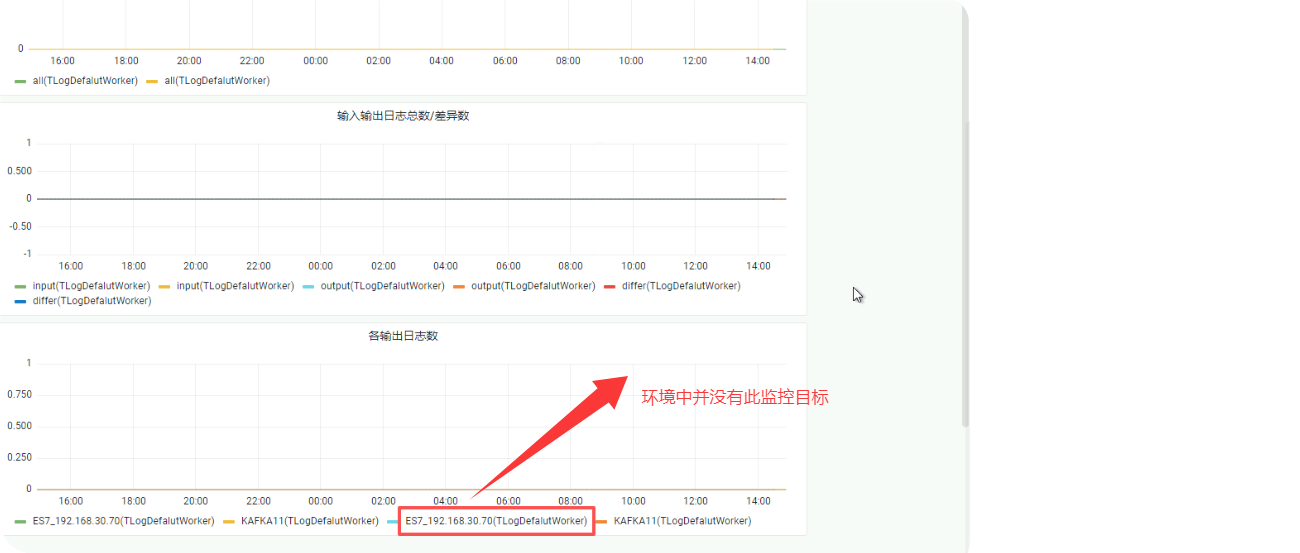
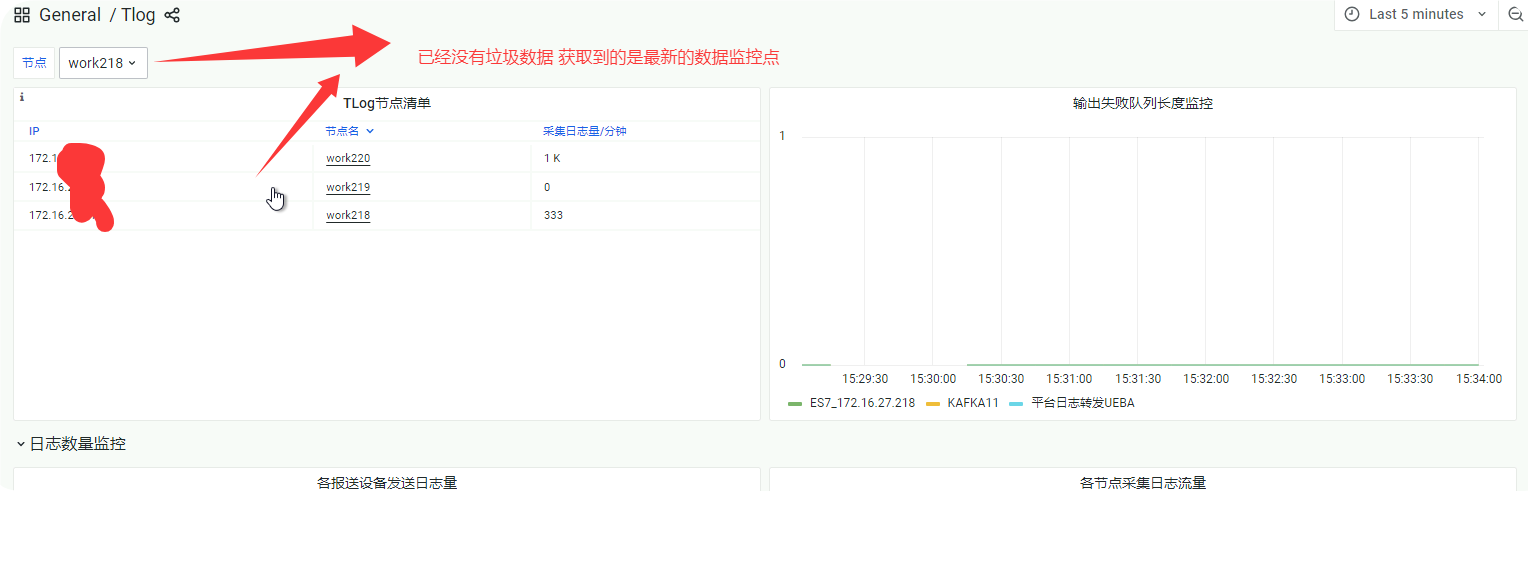
1.清空pushgateway的数据目录并重启服务
2.清空prometheus的数据目录并重启服务
3.稍微等待一段时间并重新打开监控页面
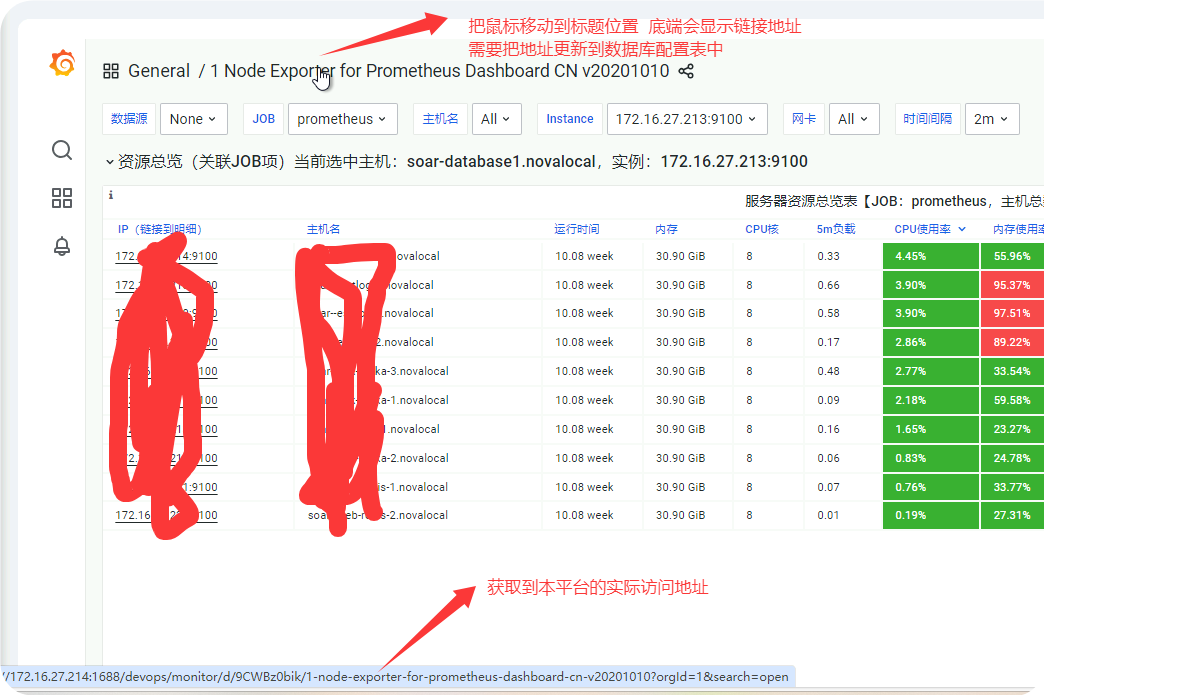
修改数据库配置数据
mysql -h172.163.27.211 -P6306 -utaishi -p222222
select vals from sys_config where id='1b94681dae7011eb8afd000c2935c408';
update sys_config set vals="https://172.16.27.214:1688/devops/monitor/d/9CWBz0bik/1-node-exporter-for-prometheus-dashboard-cn-v20201010?orgId=1&refresh=1m&kiosk=tv" where id='1b94681dae7011eb8afd000c2935c408';
数据库操作脚本
修改完数据库后重新打开第三方系统页面通过菜单即可打开嵌套的监控大屏
测试简单的导入dashboard
cat > test_dashboard.json << 'EOF'
{
  "dashboard": {
    "title": "Test Dashboard",
    "panels": []
  },
  "overwrite": true
}
EOF

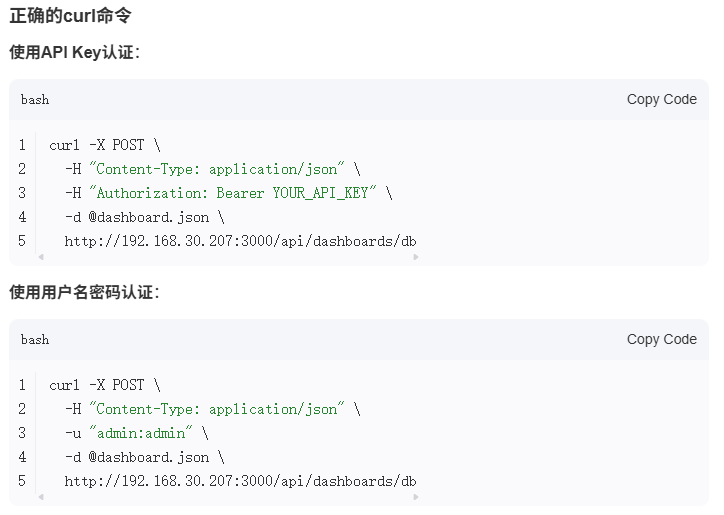
curl -X POST -H "Content-Type: application/json" -u "admin:admin" -d @test_dashboard.json http://192.168.30.207:3000/api/dashboards/db
测试导入
现有的dashboard导入问题

修改dashboard.json格式
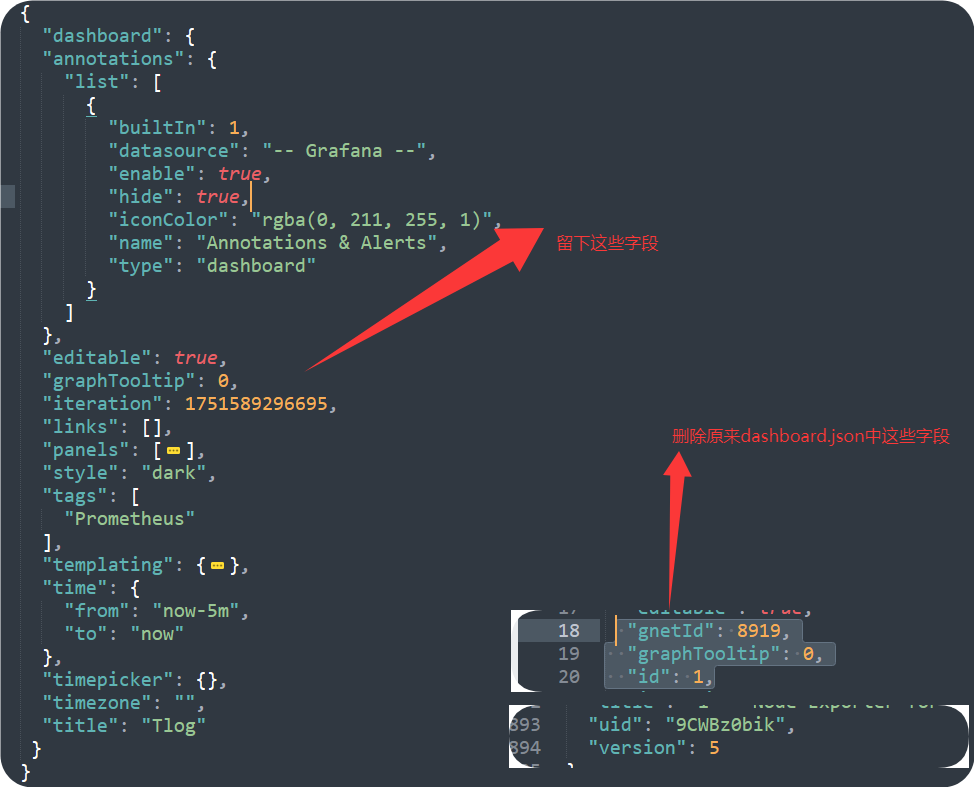
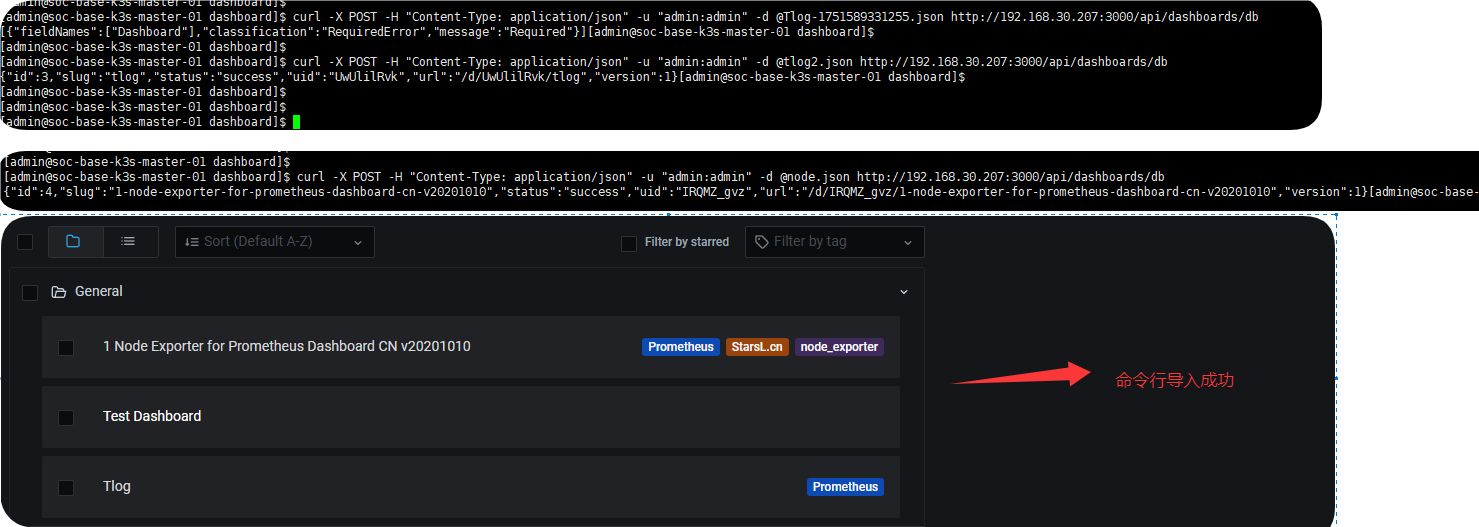
curl -X POST -H "Content-Type: application/json" -u "admin:admin" -d @node.json http://192.168.30.207:3000/api/dashboards/db
导入结束
此内容由惯性聚合(RSS阅读器)自动聚合整理,仅供阅读参考。 原文来自 — 版权归原作者所有。