





Matplotlib 是 Python 的绘图库,它能让使用者很轻松地将数据图形化,并且提供多样化的输出格式。
Matplotlib 可以用来绘制各种静态,动态,交互式的图表。
Matplotlib 可以绘制线图、散点图、等高线图、条形图、柱状图、3D 图形、甚至是图形动画等等。
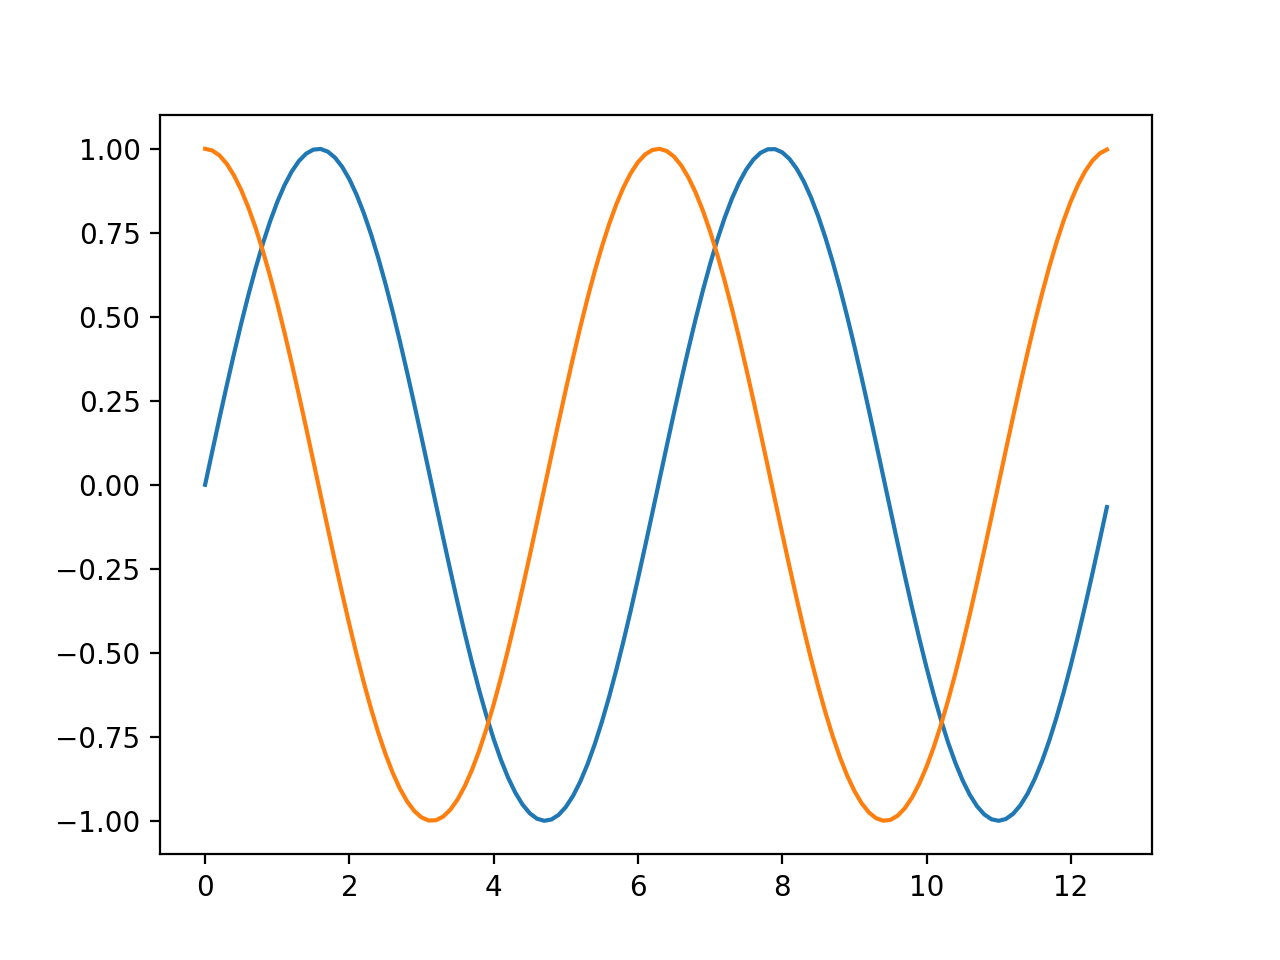
1.绘制一个正弦和余弦图,在 plt.plot() 参数中包含两对 x,y 值,第一对是 x,y,这对应于正弦函数,第二对是 x,z,这对应于余弦函数。
import matplotlib.pyplot as plt
import numpy as np

x = np.arange(0,4*np.pi,0.1)   # start,stop,step
y = np.sin(x)
z = np.cos(x)
plt.plot(x,y,x,z)
plt.show()
2.
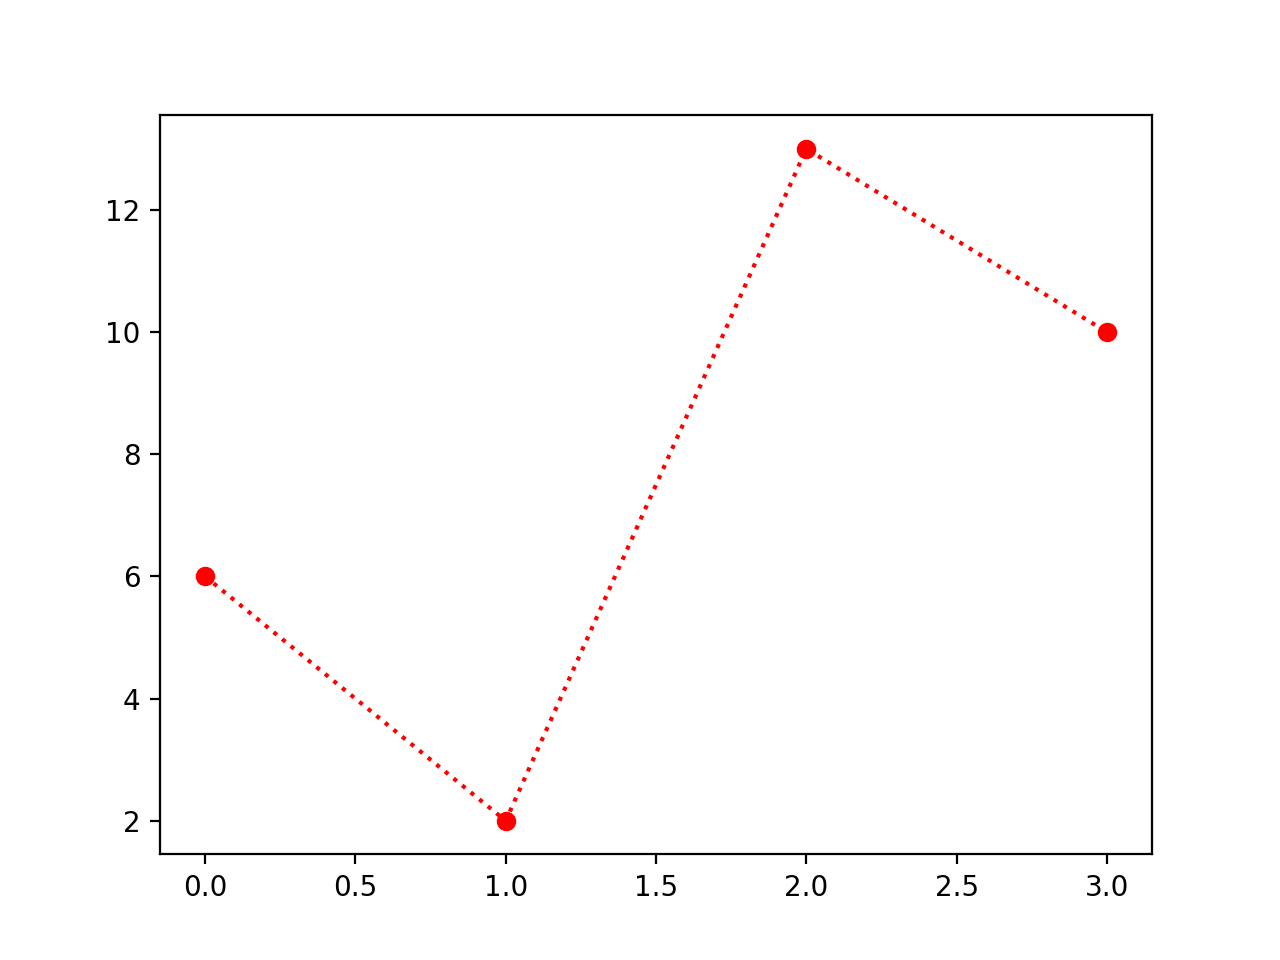
import matplotlib.pyplot as plt
import numpy as np

ypoints = np.array([6, 2, 13, 10])

plt.plot(ypoints, 'o:r')
plt.show()
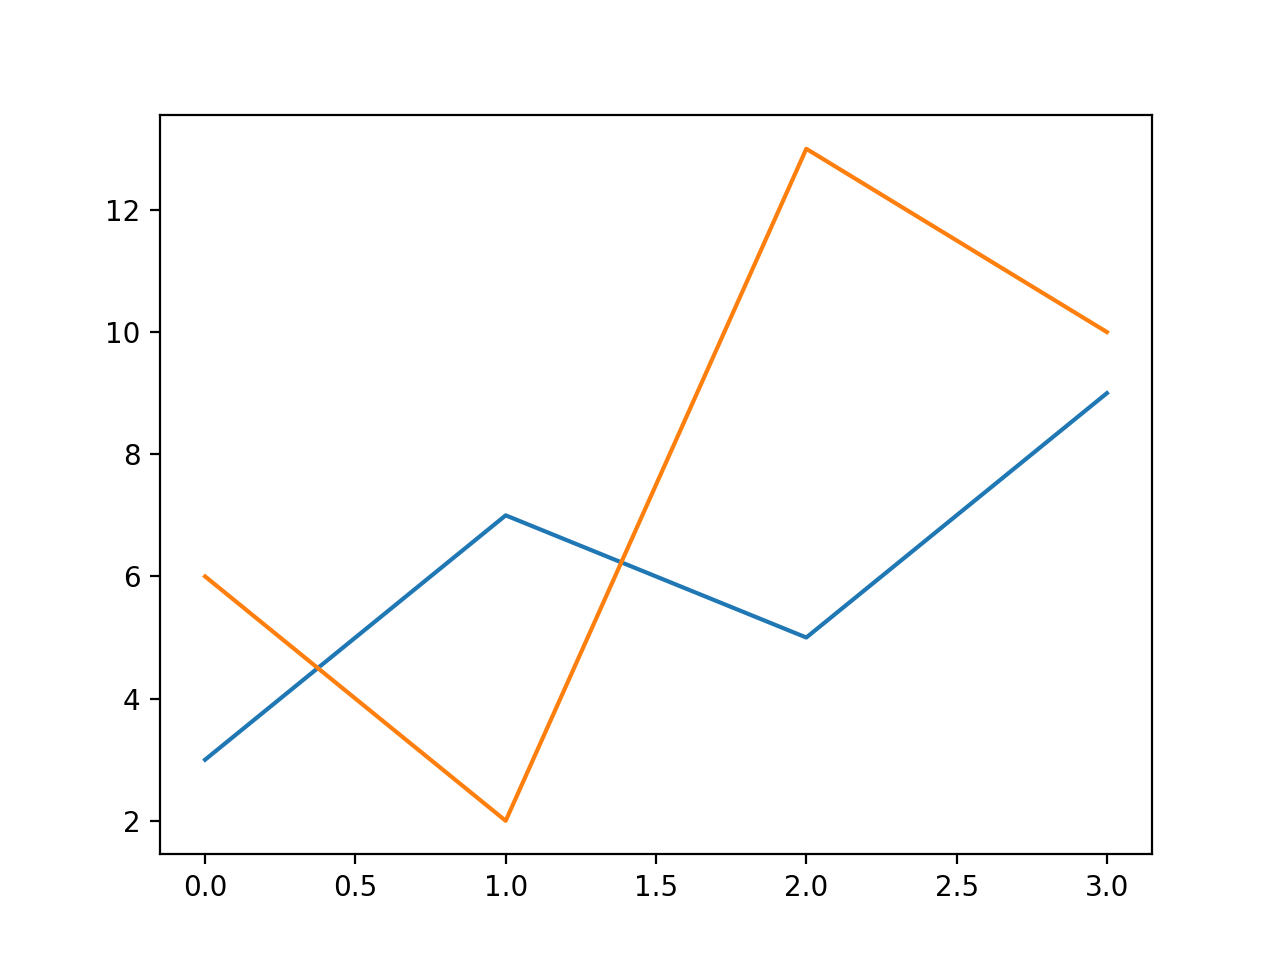
3.对 x,y 值来绘制多条线
import matplotlib.pyplot as plt
import numpy as np

y1 = np.array([3, 7, 5, 9])
y2 = np.array([6, 2, 13, 10])

plt.plot(y1)
plt.plot(y2)

plt.show()
4.
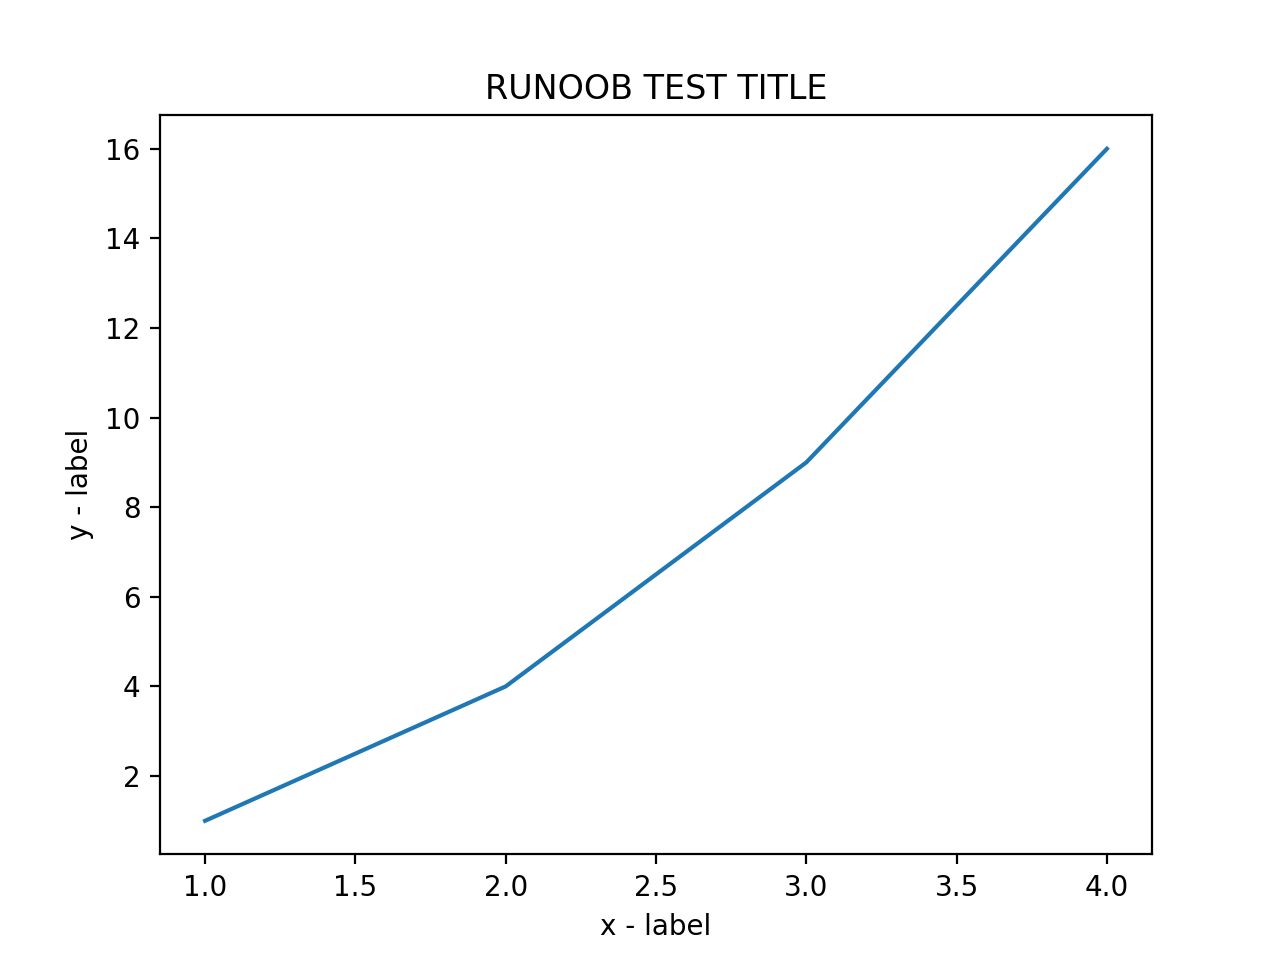
import numpy as np
import matplotlib.pyplot as plt

x = np.array([1, 2, 3, 4])
y = np.array([1, 4, 9, 16])
plt.plot(x, y)

plt.title("RUNOOB TEST TITLE")
plt.xlabel("x - label")
plt.ylabel("y - label")

plt.show()
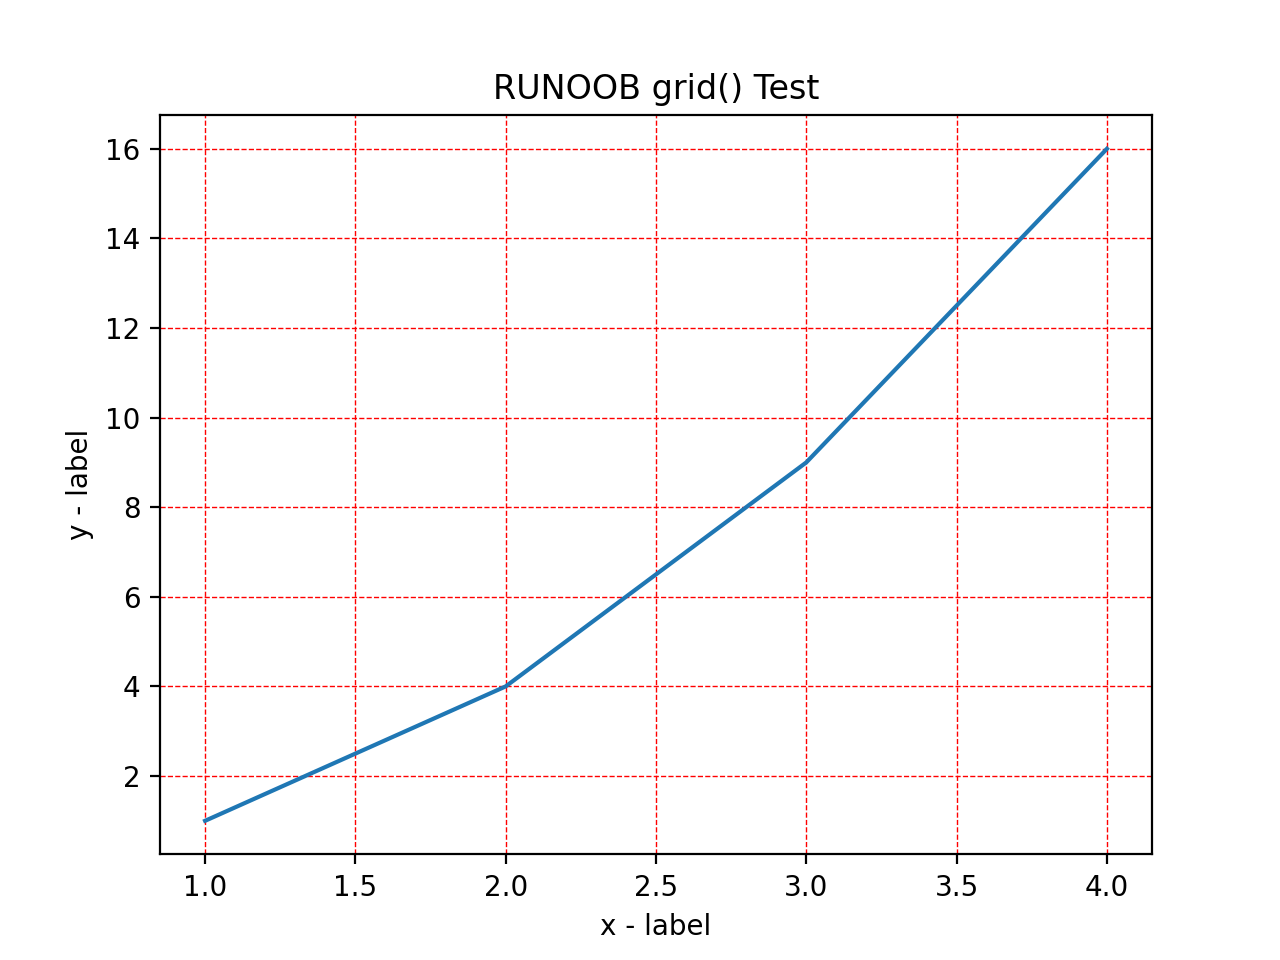
5.网格线
import numpy as np
import matplotlib.pyplot as plt

x = np.array([1, 2, 3, 4])
y = np.array([1, 4, 9, 16])


plt.title("RUNOOB grid() Test")
plt.xlabel("x - label")
plt.ylabel("y - label")

plt.plot(x, y)

plt.grid(color = 'r', linestyle = '--', linewidth = 0.5)

plt.show()
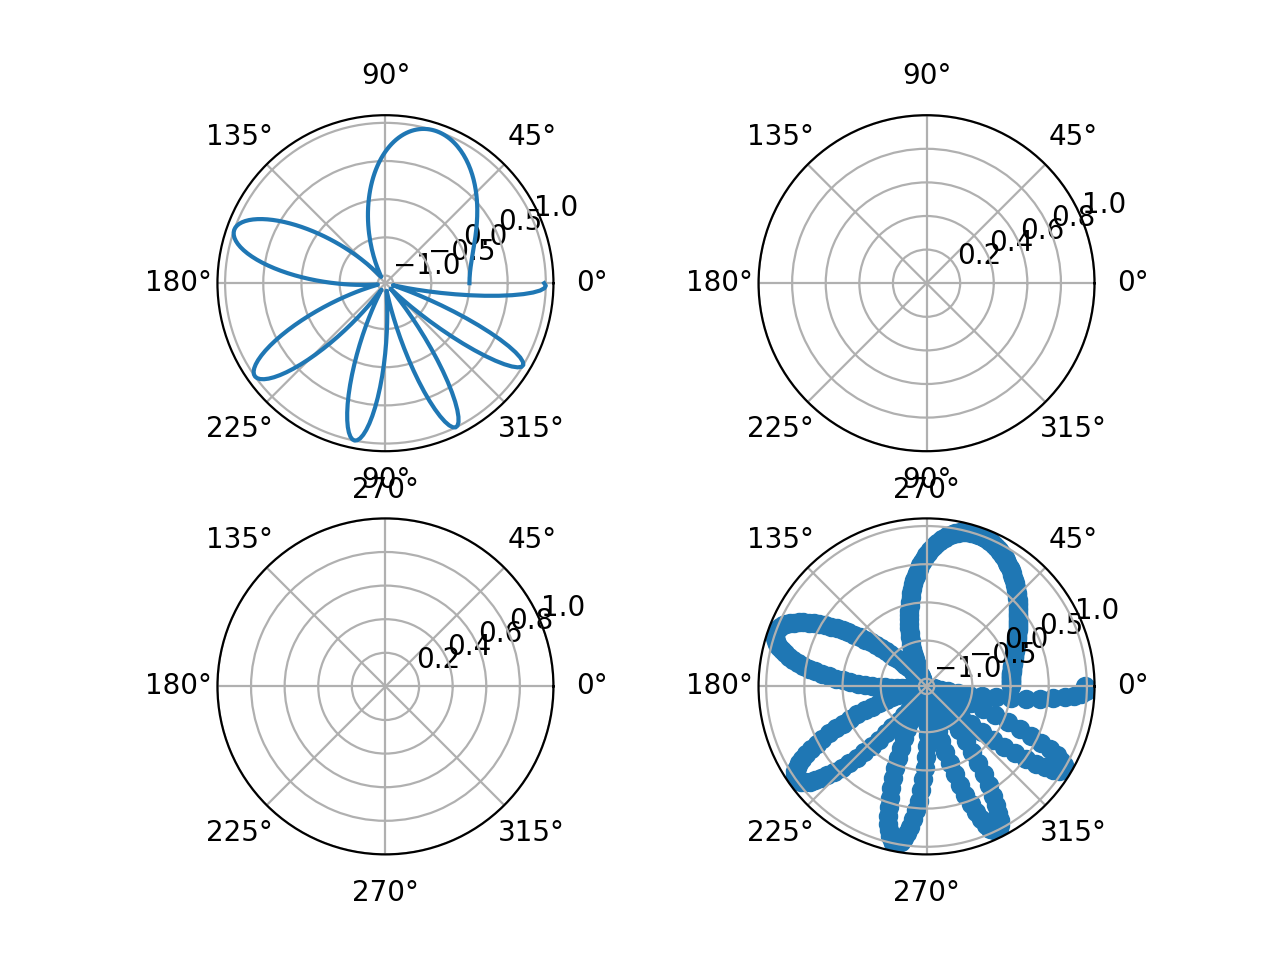
6.绘制多图
import matplotlib.pyplot as plt
import numpy as np

# 创建一些测试数据 -- 图1
x = np.linspace(0, 2*np.pi, 400)
y = np.sin(x**2)

# 创建四个子图 -- 图4
fig, axs = plt.subplots(2, 2, subplot_kw=dict(projection="polar"))
axs[0, 0].plot(x, y)
axs[1, 1].scatter(x, y)

plt.show()
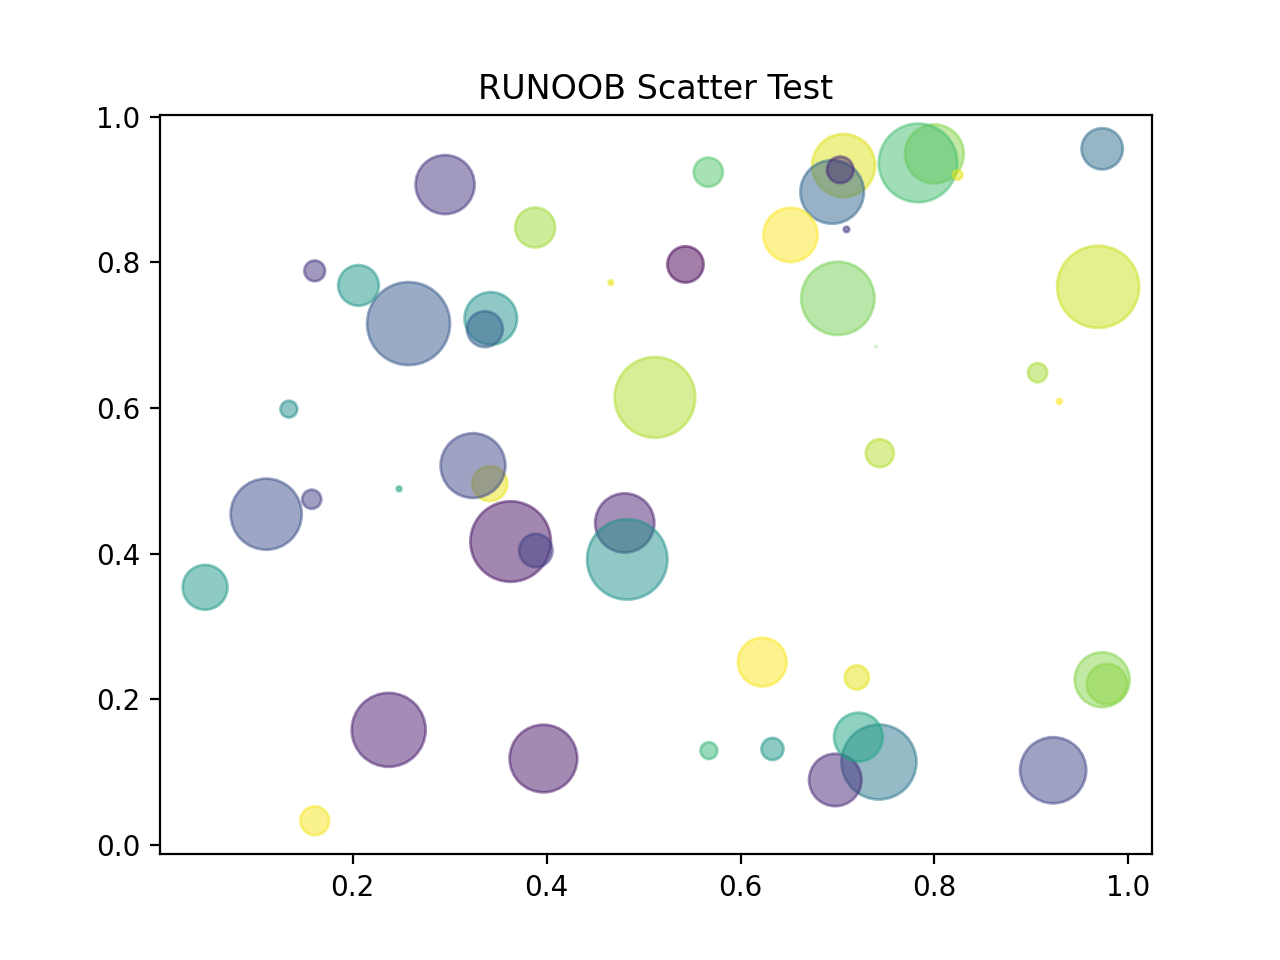
7.散点图
import numpy as np
import matplotlib.pyplot as plt

# 随机数生成器的种子
np.random.seed(19680801)


N = 50
x = np.random.rand(N)
y = np.random.rand(N)
colors = np.random.rand(N)
area = (30 * np.random.rand(N))**2  # 0 to 15 point radii

plt.scatter(x, y, s=area, c=colors, alpha=0.5) # 设置颜色及透明度

plt.title("RUNOOB Scatter Test") # 设置标题

plt.show()
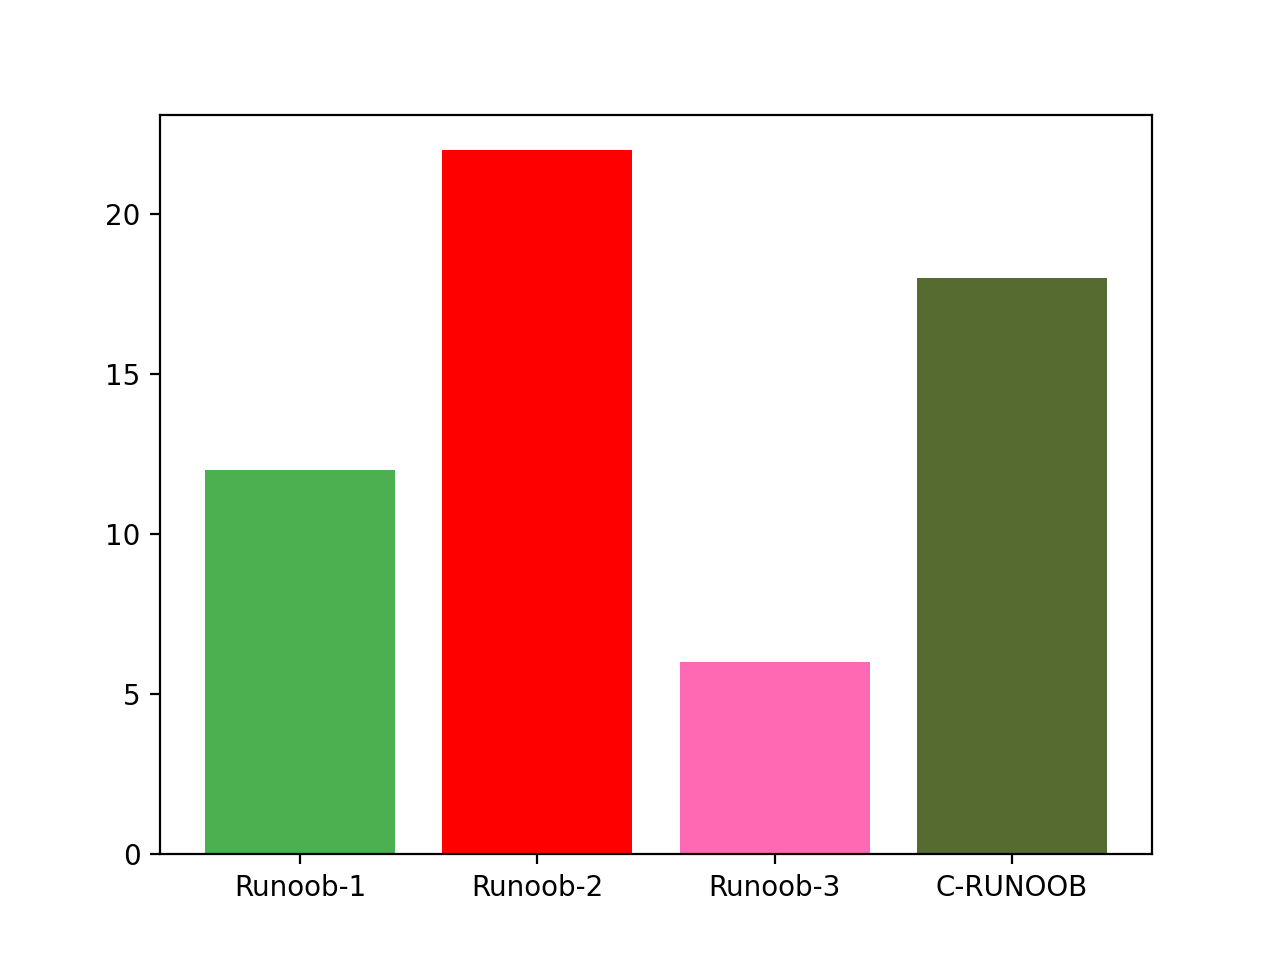
8.柱状图
import matplotlib.pyplot as plt
import numpy as np

x = np.array(["Runoob-1", "Runoob-2", "Runoob-3", "C-RUNOOB"])
y = np.array([12, 22, 6, 18])

plt.bar(x, y,  color = ["#4CAF50","red","hotpink","#556B2F"])
plt.show()
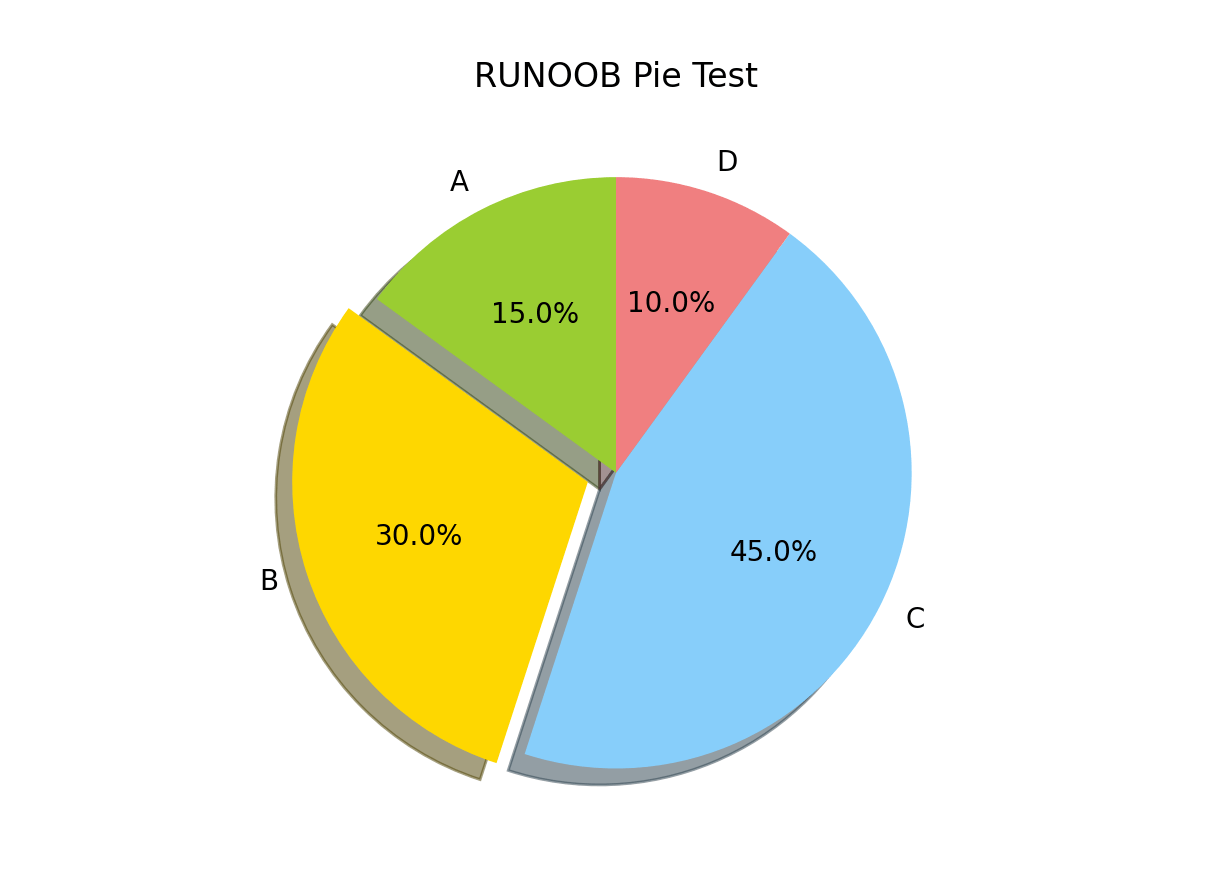
9.饼图
import matplotlib.pyplot as plt

# 数据
sizes = [15, 30, 45, 10]

# 饼图的标签
labels = ['A', 'B', 'C', 'D']

# 饼图的颜色
colors = ['yellowgreen', 'gold', 'lightskyblue', 'lightcoral']

# 突出显示第二个扇形
explode = (0, 0.1, 0, 0)

# 绘制饼图
plt.pie(sizes, explode=explode, labels=labels, colors=colors,
        autopct='%1.1f%%', shadow=True, startangle=90)

# 标题
plt.title("RUNOOB Pie Test")

# 显示图形
plt.show()
10.直方图
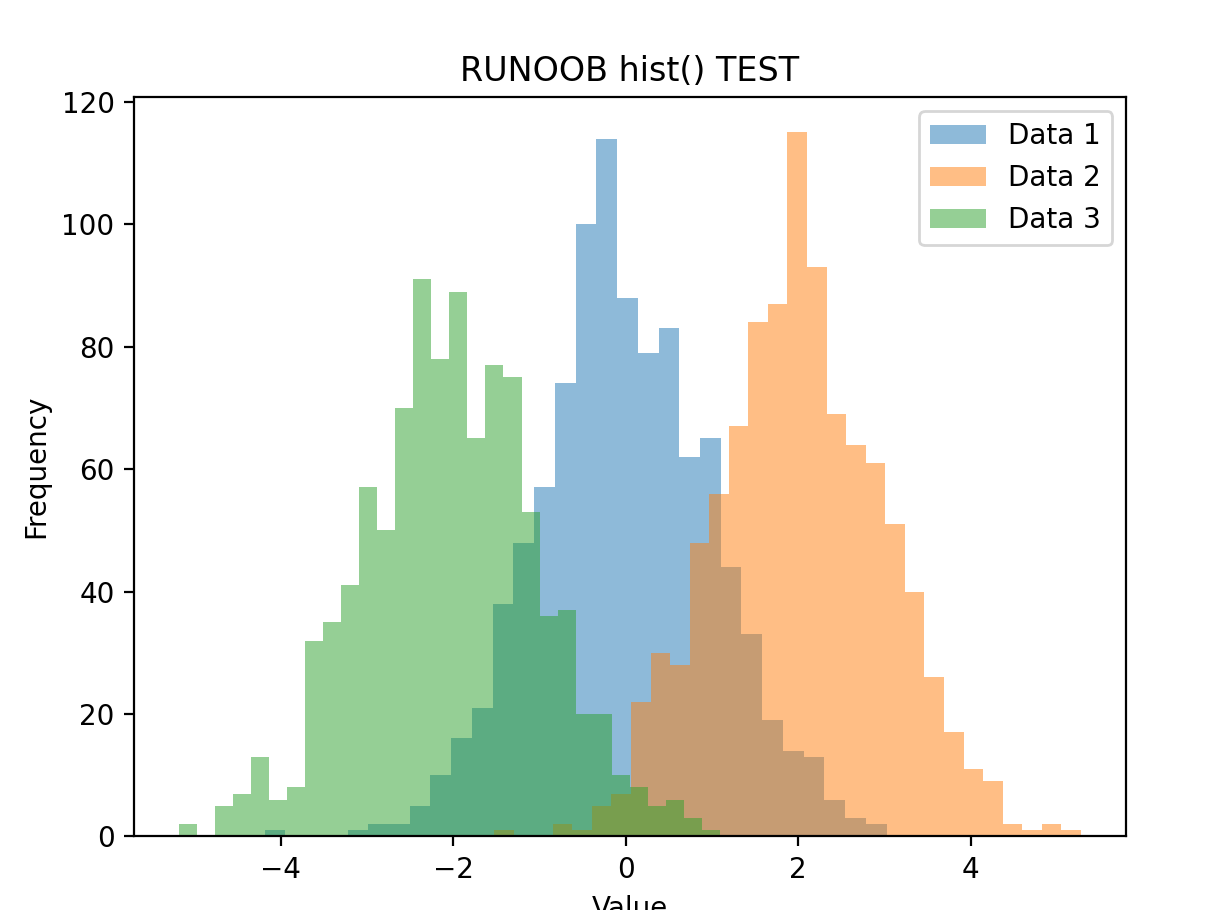
import matplotlib.pyplot as plt
import numpy as np

# 生成三组随机数据
data1 = np.random.normal(0, 1, 1000)
data2 = np.random.normal(2, 1, 1000)
data3 = np.random.normal(-2, 1, 1000)

# 绘制直方图
plt.hist(data1, bins=30, alpha=0.5, label='Data 1')
plt.hist(data2, bins=30, alpha=0.5, label='Data 2')
plt.hist(data3, bins=30, alpha=0.5, label='Data 3')

# 设置图表属性
plt.title('RUNOOB hist() TEST')
plt.xlabel('Value')
plt.ylabel('Frequency')
plt.legend()

# 显示图表
plt.show()
10.imshow()
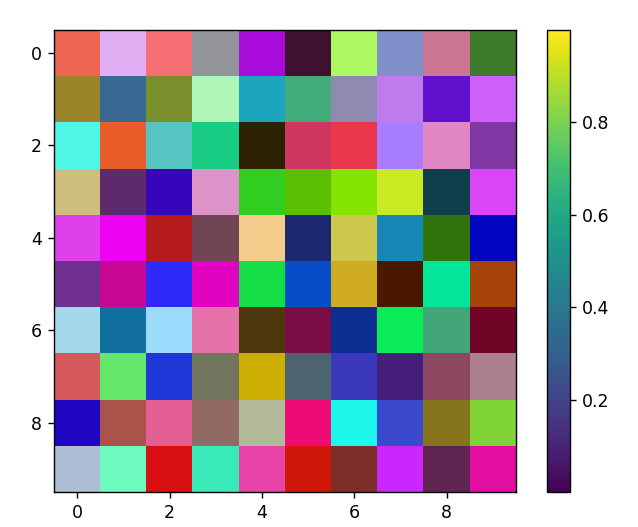
import matplotlib.pyplot as plt
import numpy as np

# 生成一个随机的彩色图像
img = np.random.rand(10, 10, 3)

# 绘制彩色图像
plt.imshow(img)

# 显示图像
plt.colorbar()
plt.show()
此内容由惯性聚合(RSS阅读器)自动聚合整理,仅供阅读参考。 原文来自 — 版权归原作者所有。