惯性聚合 高效追踪和阅读你感兴趣的博客、新闻、科技资讯
阅读原文 在惯性聚合中打开

推荐订阅源

酷 壳 – CoolShell
酷 壳 – CoolShell
H
Hacker News: Front Page
P
Palo Alto Networks Blog
T
ThreatConnect
Apple Machine Learning Research
博客园_首页
T
True Tiger Recordings
P
Privacy & Cybersecurity Law Blog
B
Blog
IT之家
IT之家
Last Week in AI
Last Week in AI
F
Full Disclosure
Hacker News: Ask HN
Hacker News: Ask HN
C
Comments on: Blog
Microsoft Azure Blog
C
Cybersecurity and Infrastructure Security Agency CISA
Microsoft Security Blog
博客园 - 【当耐特】
N
News and Events Feed by Topic
NISL@THU
NISL@THU
腾讯CDC
雷峰网
雷峰网
Security Latest
Security Latest
李成银的技术随笔
M
Microsoft Research Blog - Microsoft Research
L
LangChain Blog
L
Lohrmann on Cybersecurity
cs.CL updates on arXiv.org
C
Check Point Blog
Y
Y Combinator Blog
Recent Announcements
博客园 - Franky
N
News | PayPal Newsroom
V
V2EX
A
About on SuperTechFans
The Register - Security
月光博客
月光博客
奇客Solidot–传递最新科技情报
奇客Solidot–传递最新科技情报
Google Online Security Blog
MyScale Blog
MyScale Blog
Cisco Talos Blog
Cisco Talos Blog
Vercel News
Vercel News
WordPress大学
WordPress大学
C
Cyber Attacks, Cyber Crime and Cyber Security
The Hacker News
The Hacker News
IntelliJ IDEA : IntelliJ IDEA – the Leading IDE for Professional Development in Java and Kotlin | The JetBrains Blog
爱范儿
爱范儿
A
Arctic Wolf
L
LINUX DO - 最新话题
freeCodeCamp Programming Tutorials: Python, JavaScript, Git & More

博客园 - 杭州铁锤

IC卡ID卡简介 博文阅读密码验证 - 博客园 win11系统优化(右键鼠标选项功能太多) Jmeter修改界面字体大小 SpaceDesk连接后黑白屏解决方法 博文阅读密码验证 - 博客园 混沌测试和异常测试区别 博文阅读密码验证 - 博客园 fiddler模拟弱网测试 Fiddler如何抓取HTTPS请求 Fiddler如何设置只抓取固定域名的数据 博文阅读密码验证 - 博客园 Tabby开源终端工具使用教程 人力资源工作内容和职责 基础的软件测试面试题及答案 软件测试团队的管理 性能并发指标 VSCode编辑器极简使用入门 JavaScript基础教程前言
搭建基于Grafana+Prometheus+Node_exporter的性能监控与分析平台
杭州铁锤 · 2025-05-28 · via 博客园 - 杭州铁锤

系统监控与分析是确保应用稳定性和高效性的关键。Prometheus与Grafana的结合,为我们提供了一个强大而灵活的监控解决方案,能够实时地收集、处理并展示系统性能指标。本文将详细介绍如何在Linux环境下搭建基于Grafana、Prometheus和Node_exporter的性能监控与分析平台。

一、平台组件概述

1.Node_exporter

Node_exporter是一个轻量级的数据采集器,专门用于Linux系统,收集CPU、内存、磁盘、网络等硬件和操作系统级别的性能指标。它通过HTTP服务以Prometheus可理解的格式提供这些数据,是Prometheus监控生态系统中的重要一环。

2.Prometheus

Prometheus是一个开源的监控和警报工具,负责从配置的目标(如Node_exporter)中抓取度量指标数据,并将其存储在自己的时间序列数据库中。在性能监控平台中,Prometheus作为数据收集、存储和查询的中心,与Grafana等可视化工具协同工作,提供全面的系统监控能力。

3.Grafana

Grafana是一个开源的监控和数据分析平台,支持多种数据源,并提供了丰富的图表和可视化选项。通过Grafana,我们可以轻松地将Prometheus中的性能测试数据以图表形式展示出来,实现实时监控和数据分析。

二、平台搭建步骤

1. 安装并启动Node_exporter

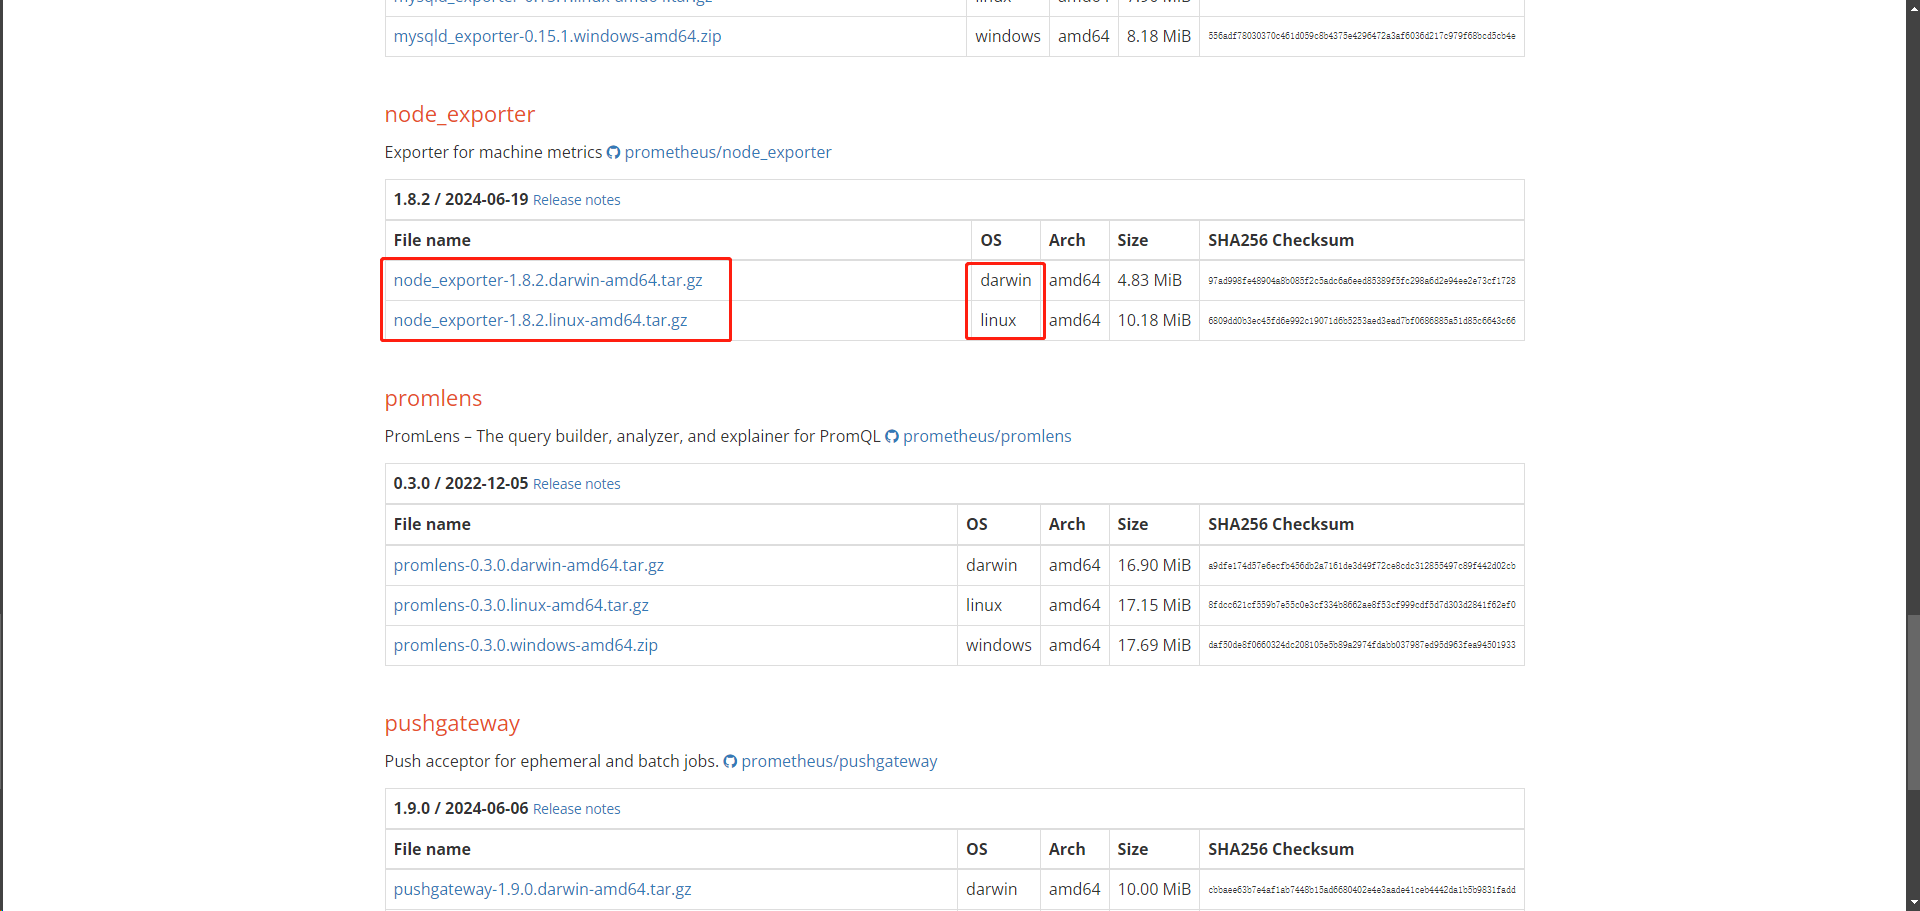
Node_exporter官网下载地址:https://prometheus.io/download/#node_exporter
选择Linux版本进行下载
image

# 进入创建的文件夹
cd /opt/performance

# 下载 node_exporter
wget https://github.com/prometheus/node_exporter/releases/download/v1.8.2/node_exporter-1.8.2.linux-amd64.tar.gz

# 解压
tar xvfz node_exporter-1.8.2.linux-amd64.tar.gz

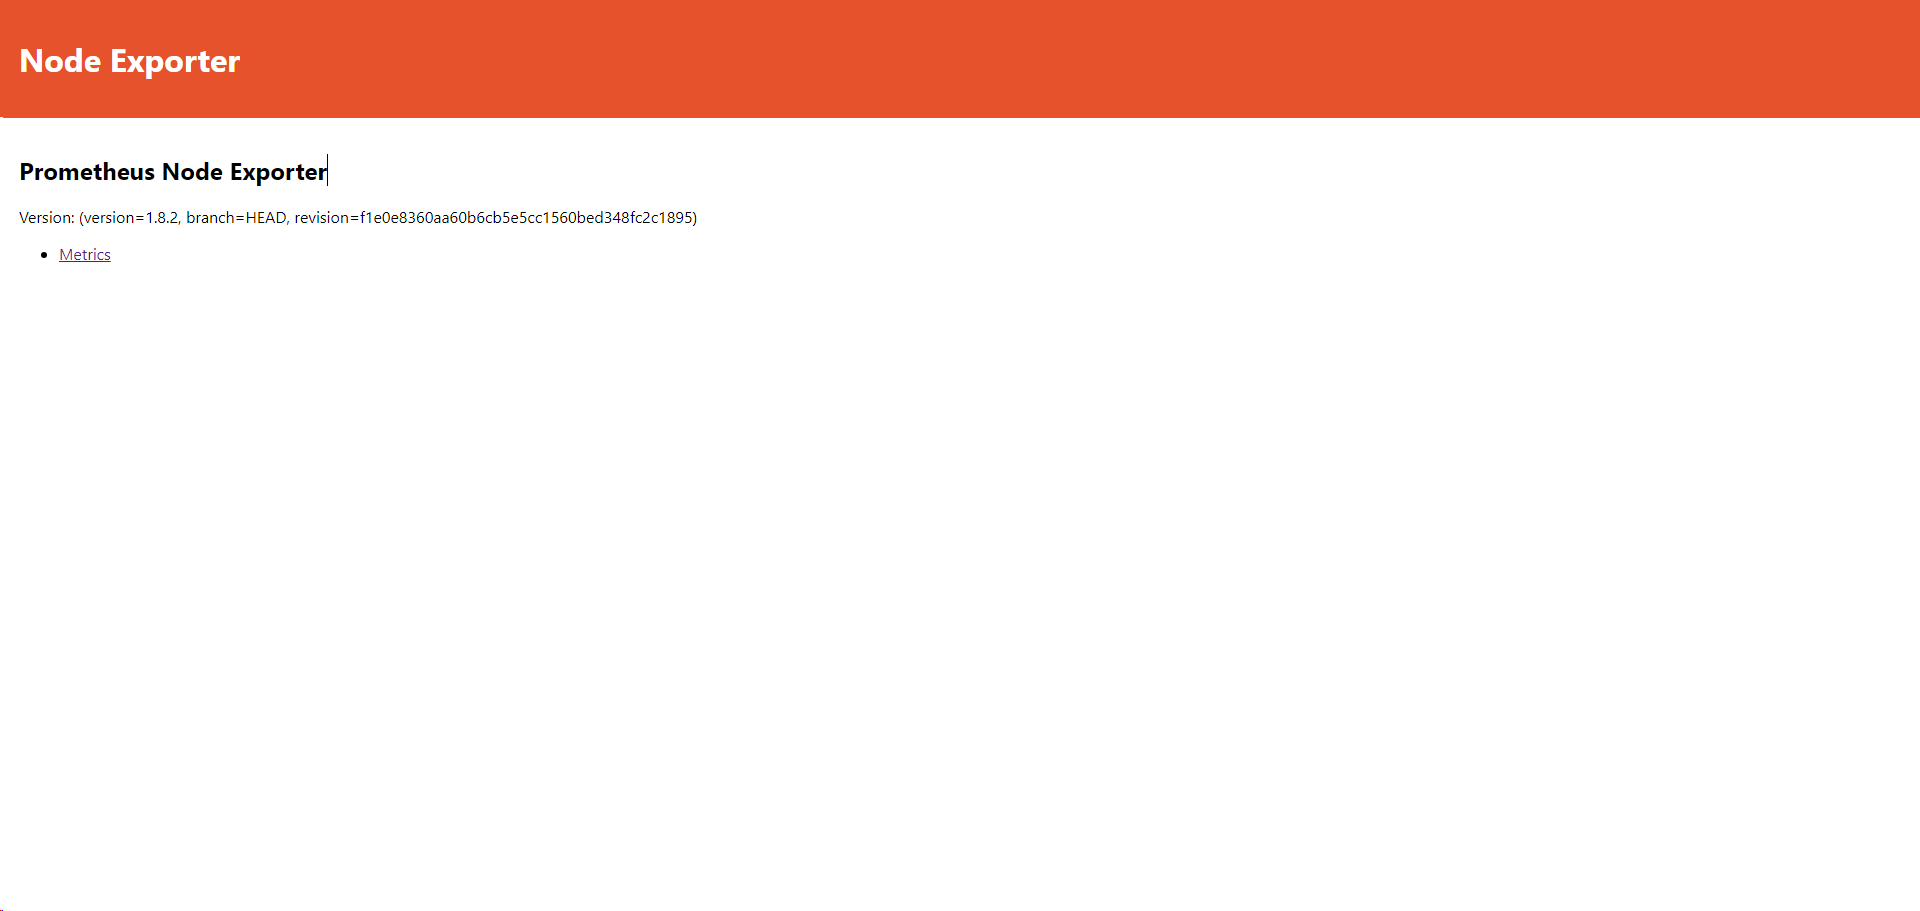
我们浏览器访问被监控服务器的9101端口,出现该页面,说明成功
image

如果浏览器无法访问该端口,可能是该端口的防火墙未开放

# 使用firewalld关闭防火墙

# 永久允许访问9100端口
sudo firewall-cmd --permanent --zone=public --add-port=9100/tcp

# 重新加载防火墙配置
sudo firewall-cmd --reload

2. 安装和配置Prometheus

Prometheus官网下载地址:https://prometheus.io/download/#/prometheus
image

# 进入创建的文件夹
cd /opt/performance

# 下载 Prometheus
wget https://github.com/prometheus/prometheus/releases/download/v3.0.0-beta.0/prometheus-3.0.0-beta.0.linux-amd64.tar.gz

# 解压
tar -zxvf prometheus-3.0.0-beta.0.linux-amd64.tar.gz

我们浏览器访问9090端口,出现该页面,说明安装成功
image

将Node_exporter输出配置到Prometheus中

vim prometheus.yml
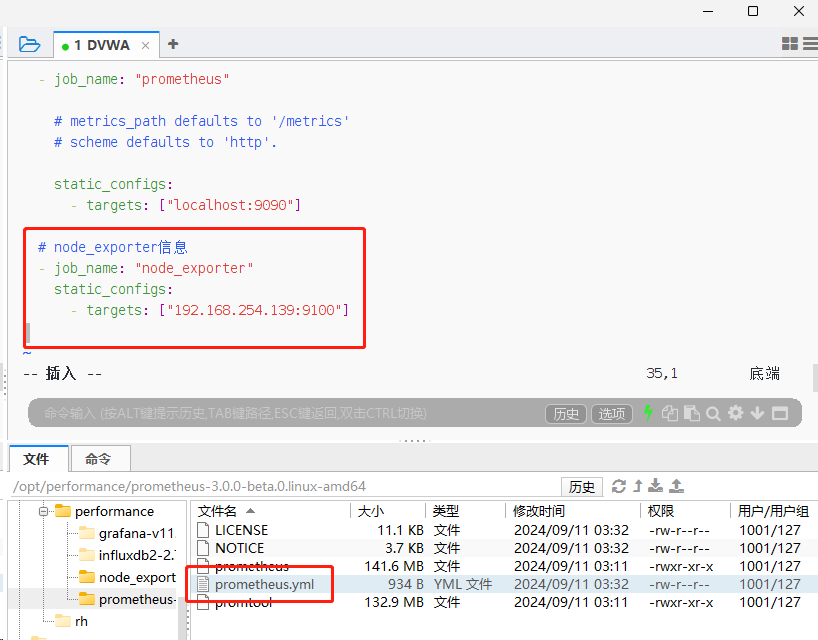
  • job_name: 任意字符串,可以理解为一个标识符
  • targets: node_exporter服务列表(ip + 端口号),可以多个

image

重启Prometheus服务

# 查找 Prometheus 进程ID
ps aux | grep prometheus

# 强制停止Prometheus进程
kill -9 [PID]

# 重新启动Prometheus服务
nohup ./prometheus --config.file=prometheus.yml &

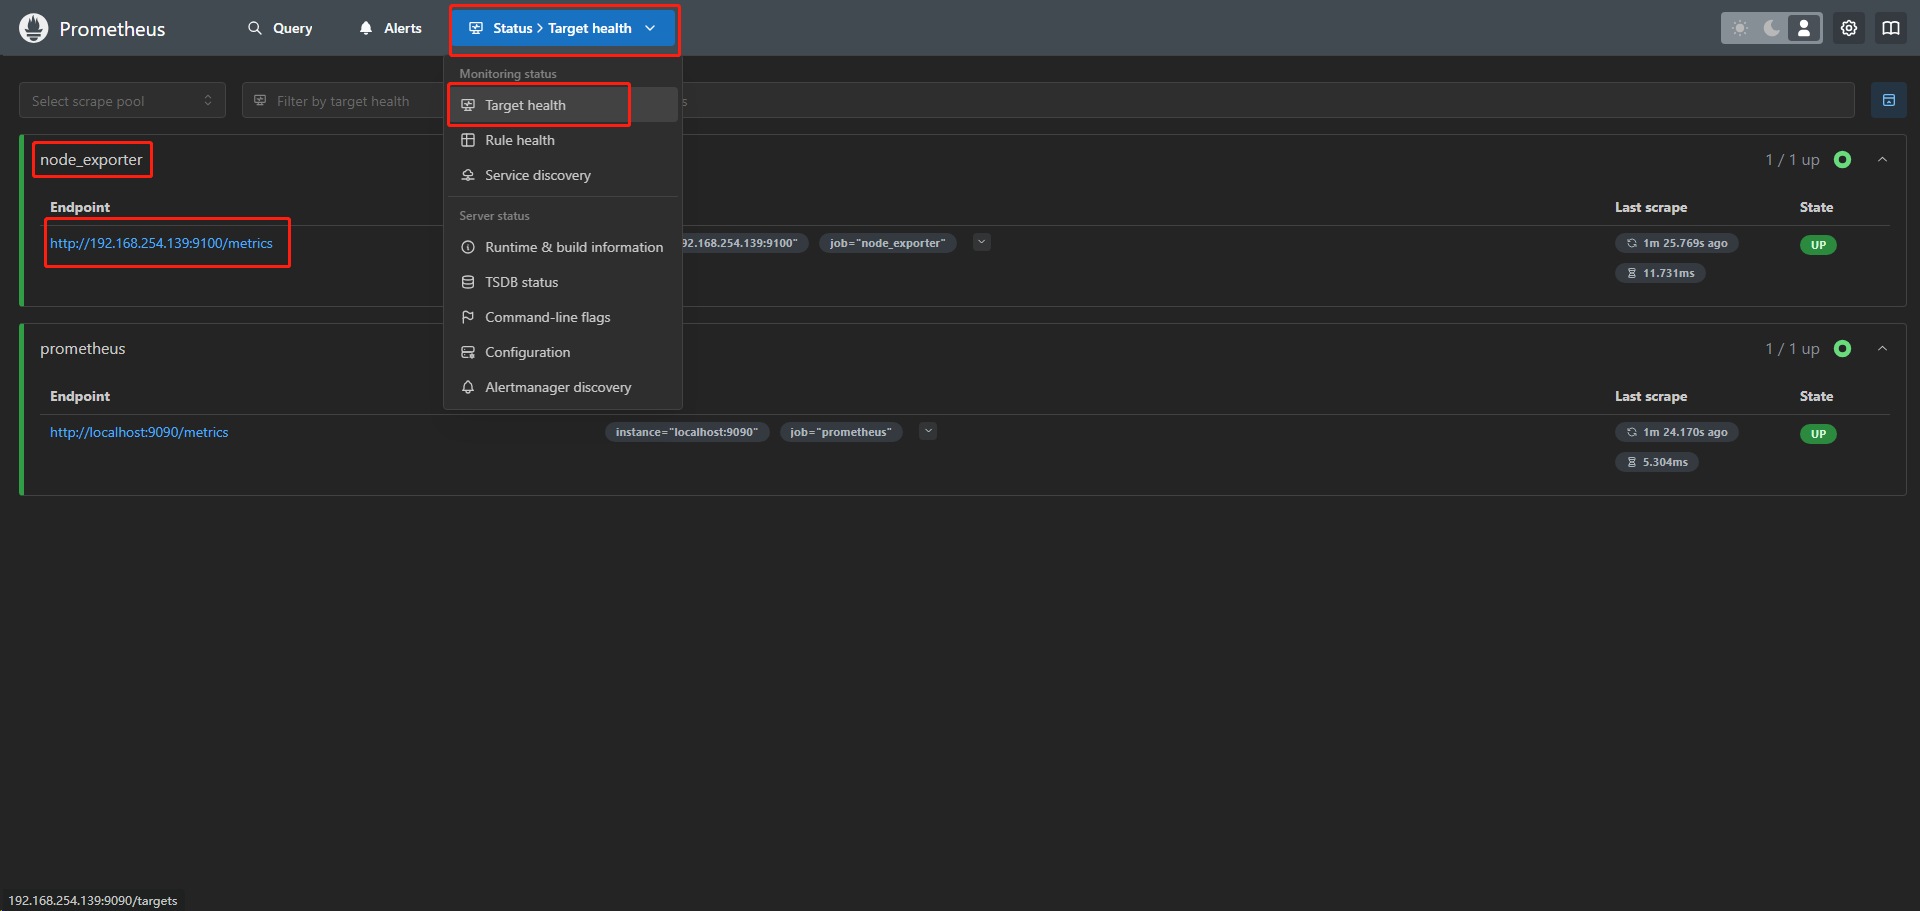
我们浏览器再次访问9090端口,并如下图点击目录,该页面中出现我们配置好的node_exporter,说明配置成功
image

3. 安装和配置Grafana

Grafana 官网下载地址:https://grafana.com/grafana/download
image

# 进入创建的文件夹
cd /opt/performance

# 下载 grafana
wget https://dl.grafana.com/enterprise/release/grafana-enterprise-11.1.3.linux-amd64.tar.gz

# 解压
tar -zxvf grafana-enterprise-11.1.3.linux-amd64.tar.gz

image

# 启动服务
./bin/grafana-server &

访问页面,成功显示。用户名 & 密码 均为 admin
image

4. 创建仪表板和分析视图

I. 添加数据源
点击 Configuration -> Data sources 进入数据源界面,再点击 Add data source 进入新增数据源界面。
image

点击 Prometheus,创建Prometheus数据源。

image

根据下面的图片提示,填写表单:
image

点击 Save & test
image

II. 创建仪表盘
点击 Dashboards -> Browse 进入仪表盘界面,再点击 New - > import 进入导入仪表盘界面。

image

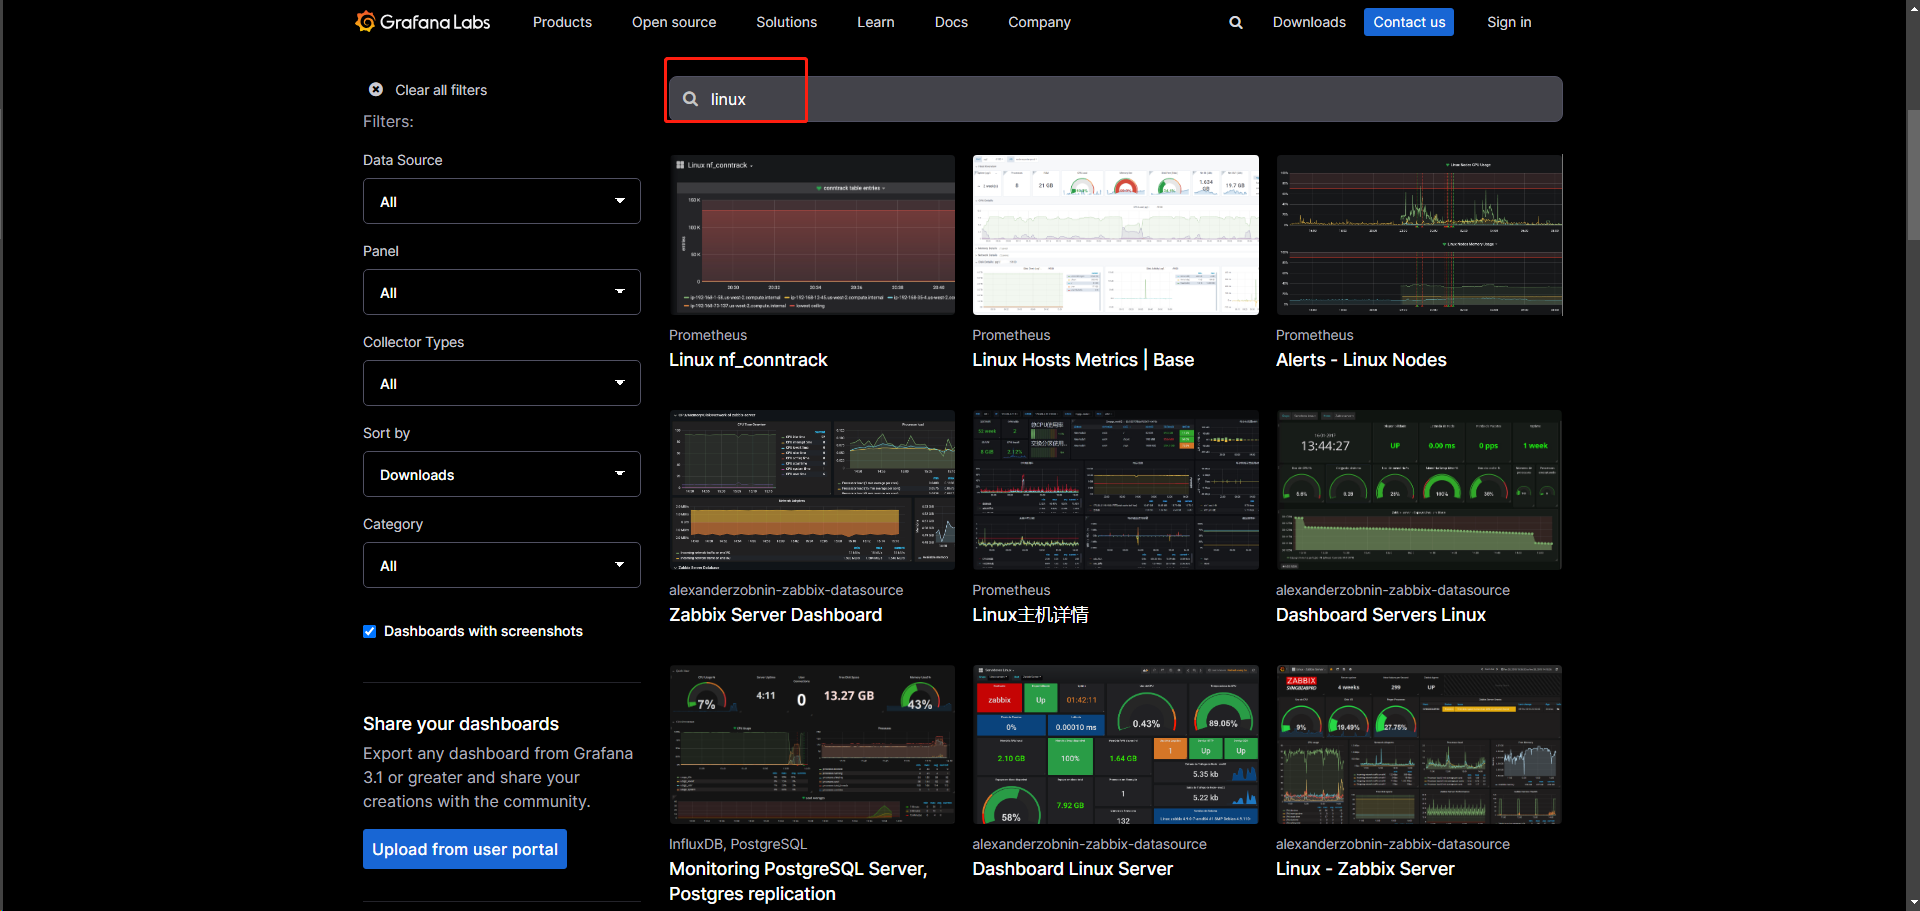
仪表盘模板大全:https://grafana.com/grafana/dashboards/
可根据关键字查询想要的一些模板
image

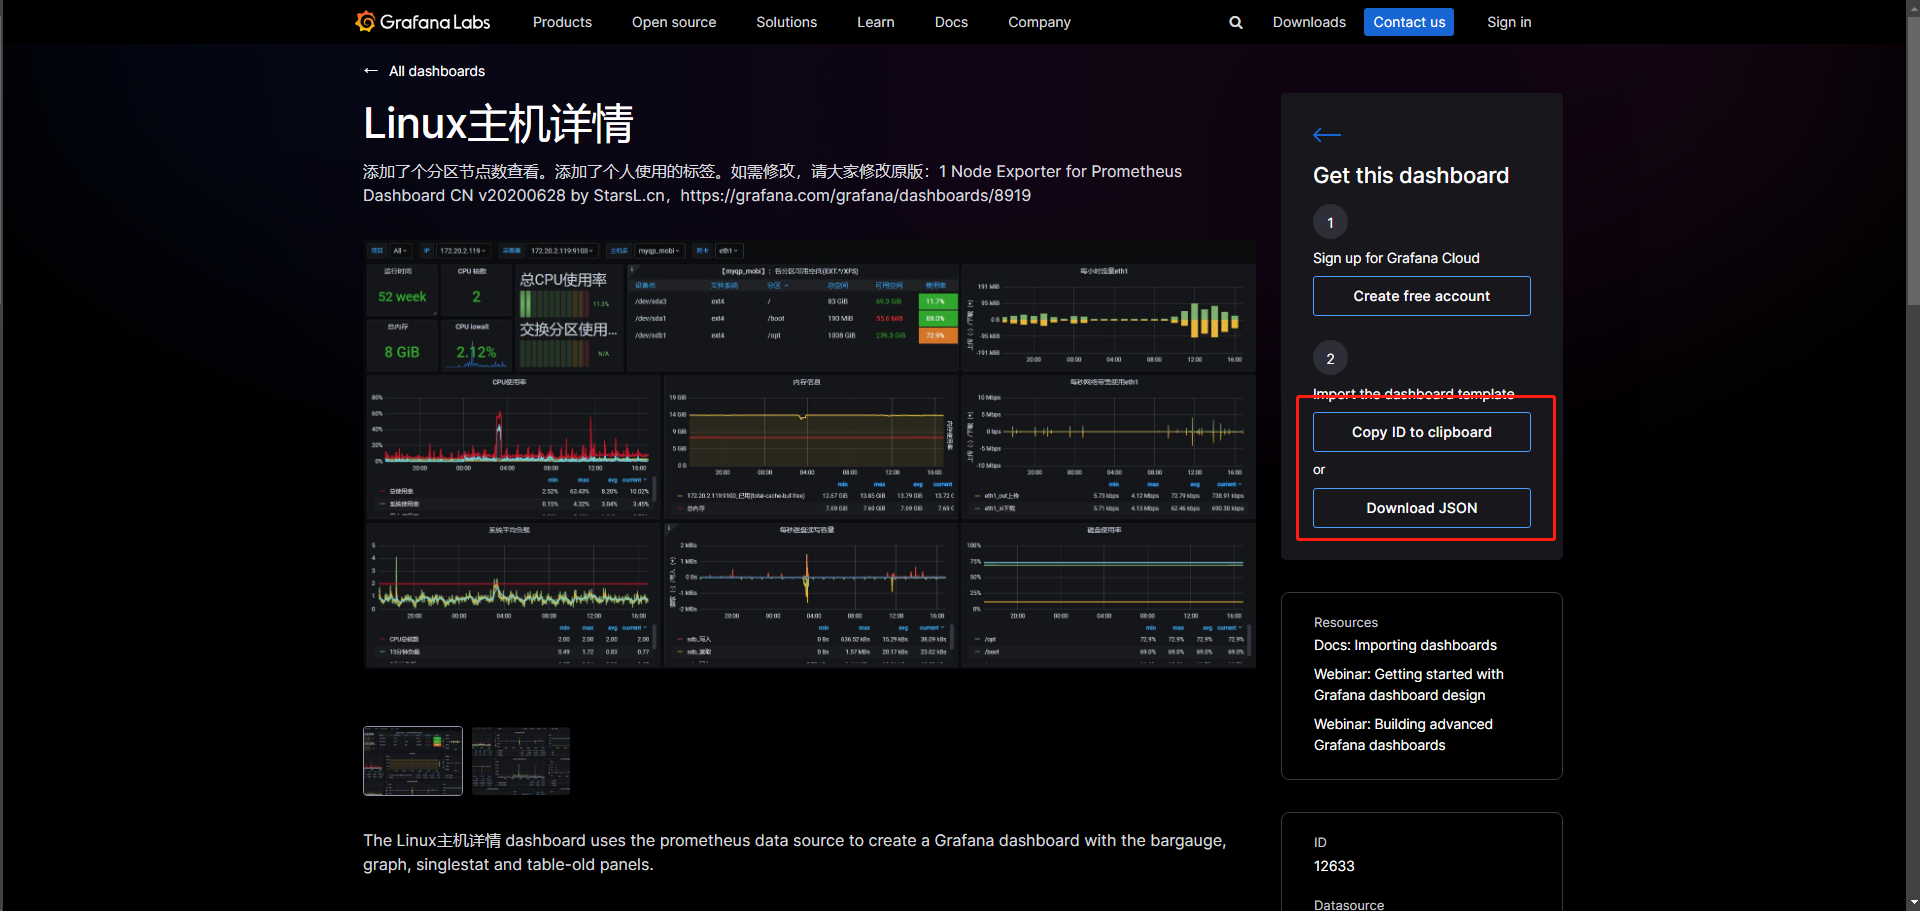
点击详情可获取id或获取json文件,若配置环境无网络情况下选择json文件。
image

我这里输入仪表盘ID:12633,点击导入仪表盘。

image

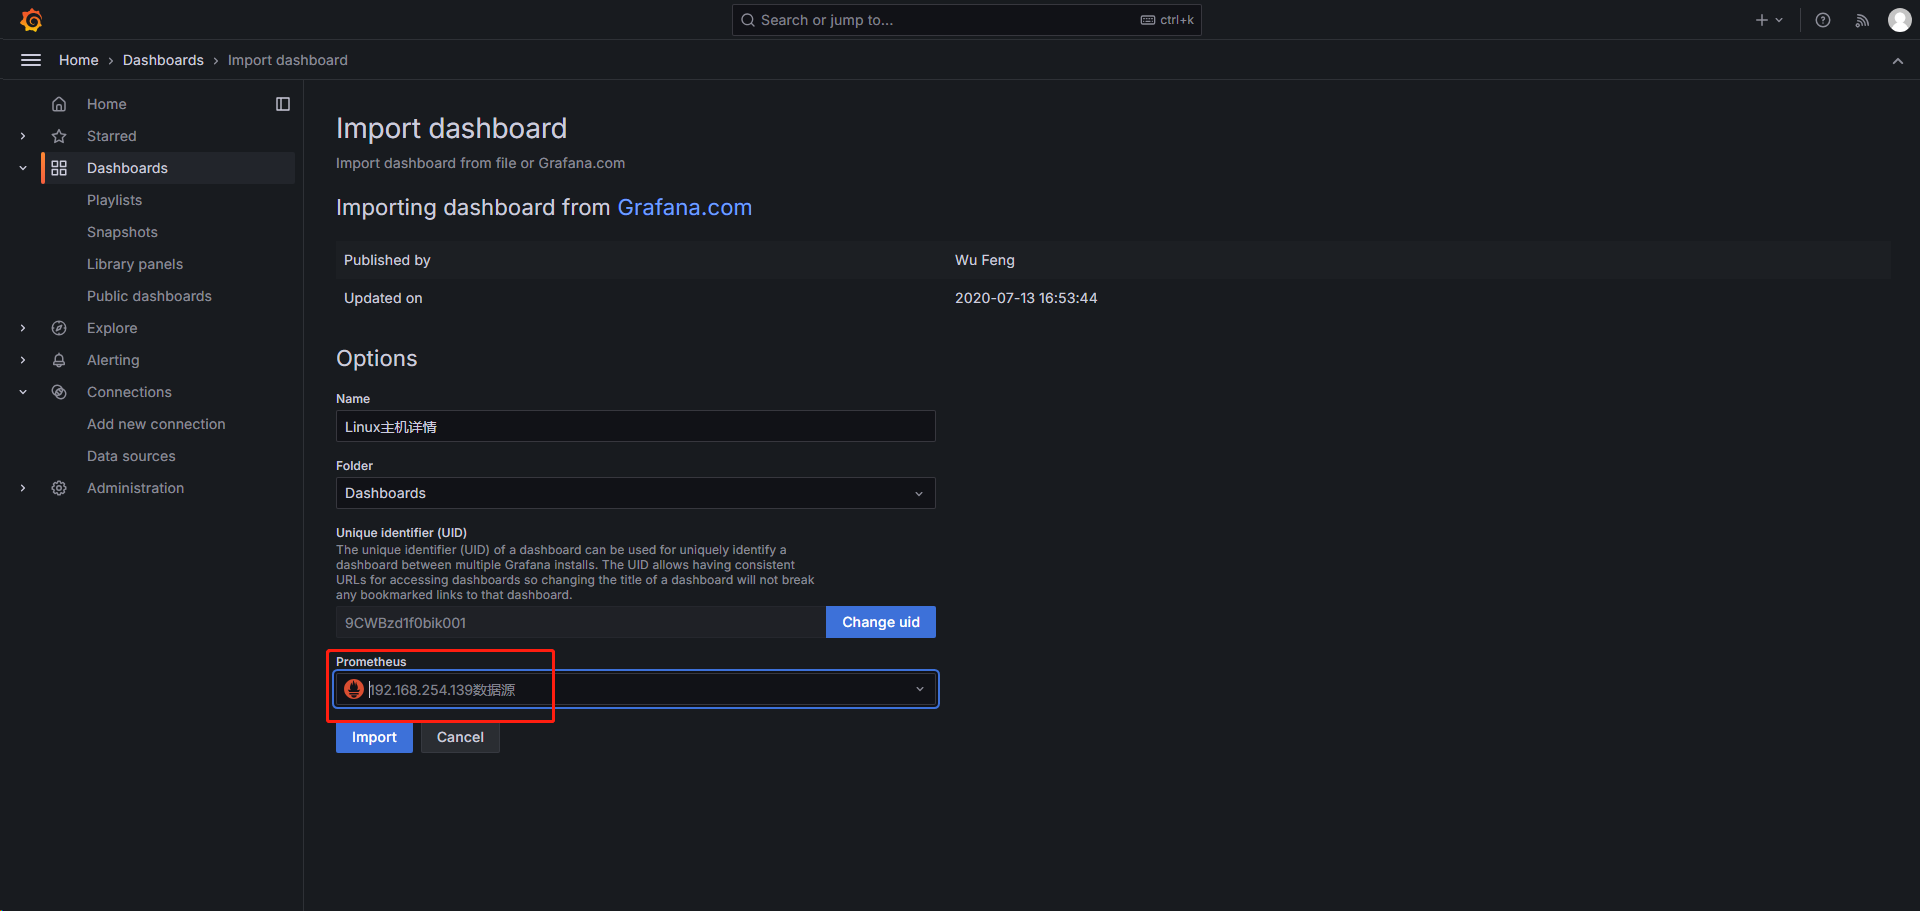
选择刚刚配置好的数据源,点击 Import 导入仪表盘。

image

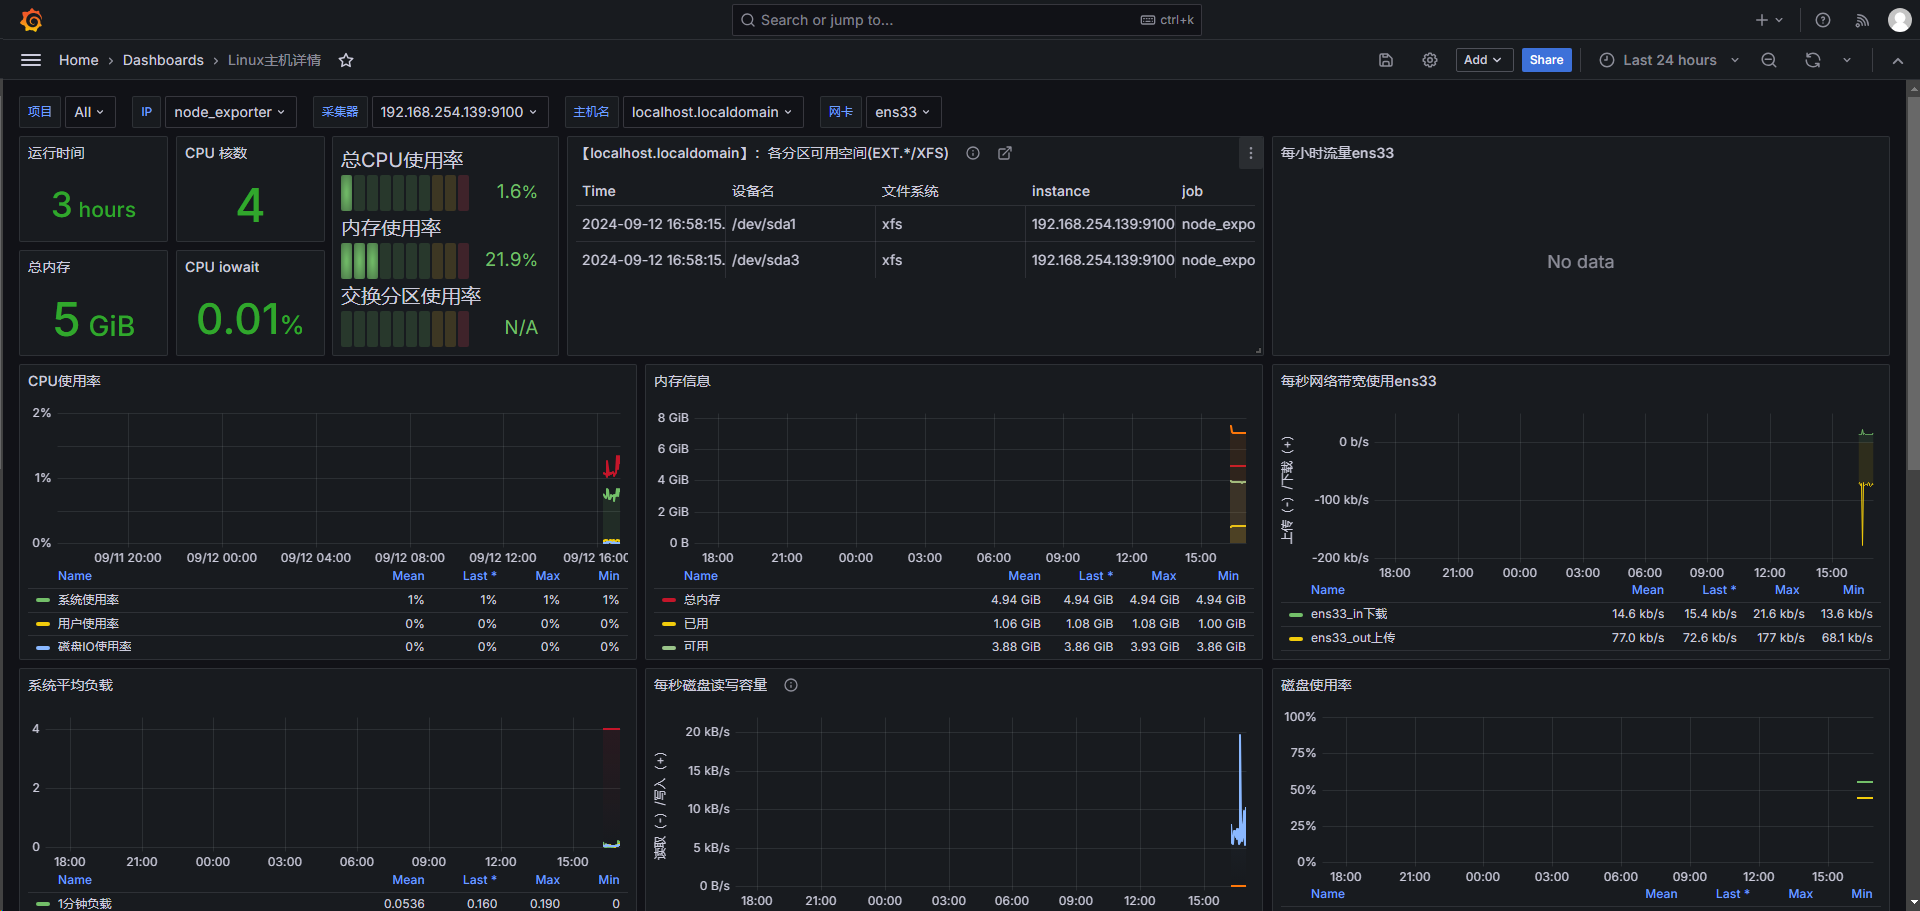
点击 Import 后,展示如下页面。
image

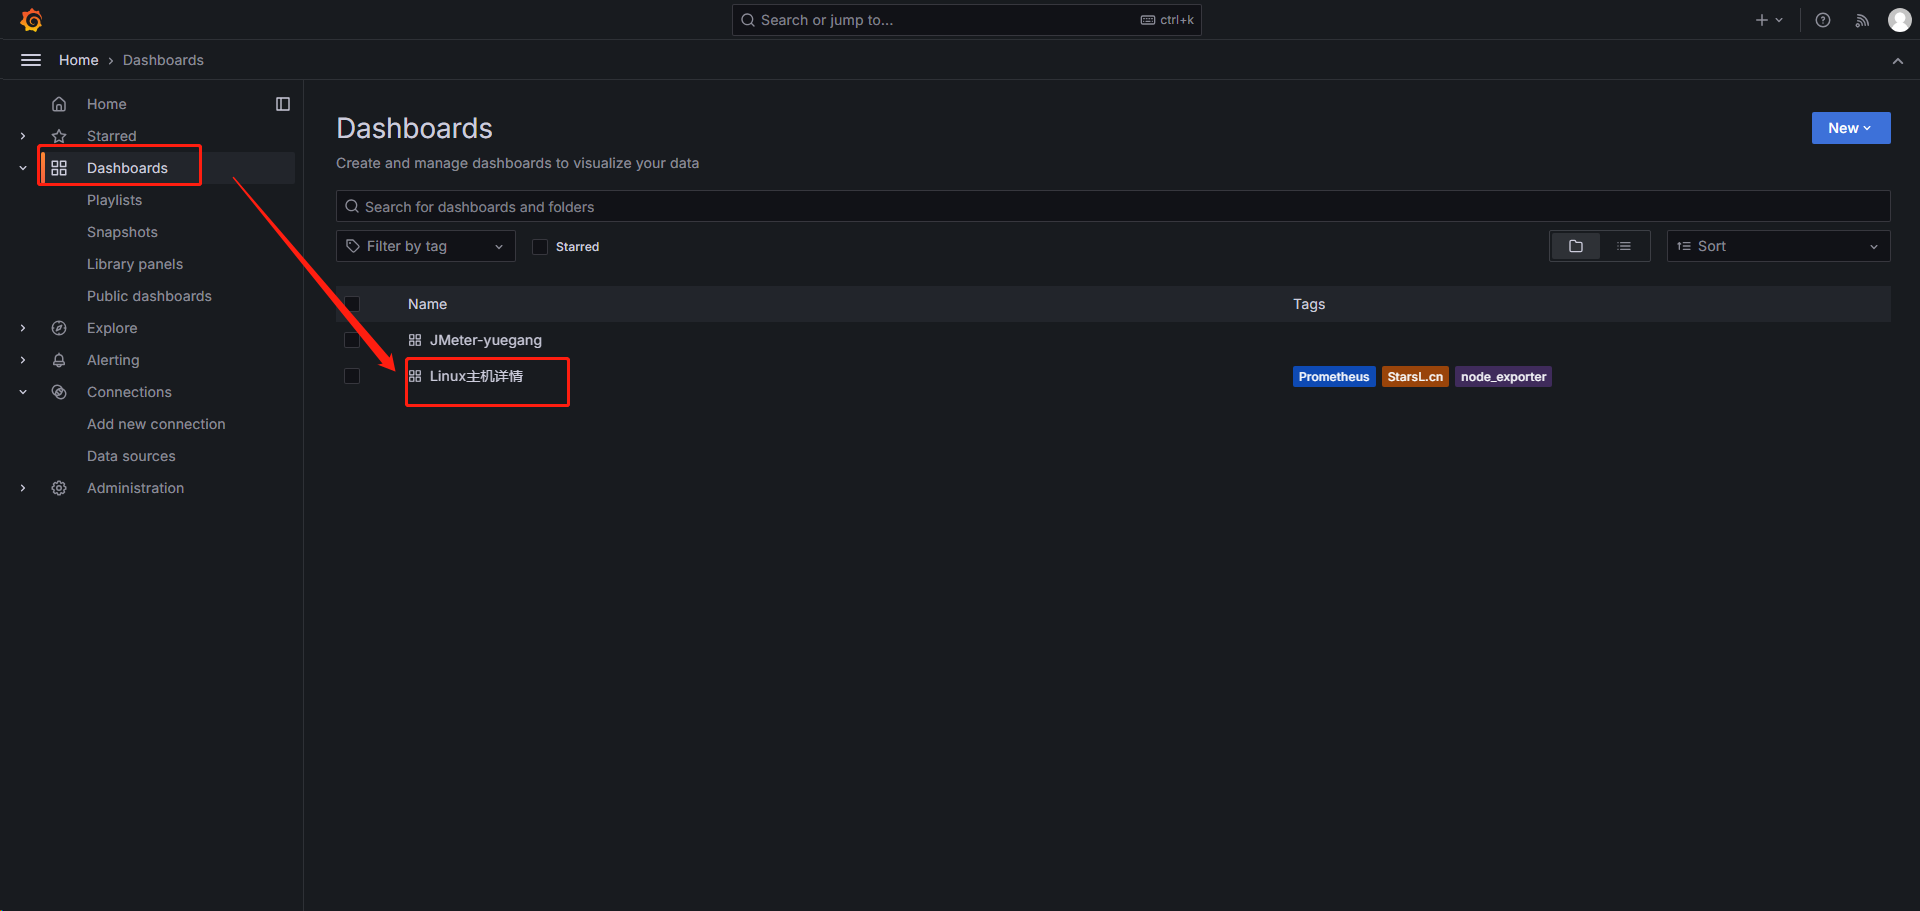
后续可以在 Dashboards 页面中点击查看该仪表盘。
image

三、平台应用与优势

  • 应用场景
    • 实时监控:通过Grafana的仪表板,可以实时监控应用的性能指标,及时发现潜在的性能问题。
    • 历史数据分析:利用Prometheus存储的历史数据,可以进行更深入的性能分析,找出性能瓶颈和趋势。
    • 性能调优:基于监控和分析结果,对应用进行性能调优,提升用户体验。
  • 优势
    • 开源免费:Node_exporter、Prometheus和Grafana都是开源软件,可以免费使用,降低了成本。
    • 灵活可扩展:平台支持自定义测试脚本和查询语句,可以根据实际需求进行灵活配置和扩展。
    • 可视化效果好:Grafana提供了丰富的图表和可视化选项,能够直观地展示性能测试数据。

注:安装方法不唯一,且各个教程安装版本也不相同