






For the last two years, we’ve been working on making PlanetScale Insights the best built-in MySQL database monitoring tool. Today, we’re releasing a significant upgrade: Schema recommendations.
With schema recommendations, you will automatically receive recommendations to improve database performance, reduce memory and storage, and improve your schema based on production database traffic.
Schema recommendations uses query-level telemetry to generate tailored recommendations in the form of DDL statements that can be applied directly to a database branch and then deployed to production.
How to use schema recommendations
To find the schema recommendations for your database, go to the “Insights” tab in your PlanetScale database and click “View recommendations.” You will see the current open recommendations for your database.
Also, if you are subscribed to your database’s weekly database report, you will get an email with your first recommendations.
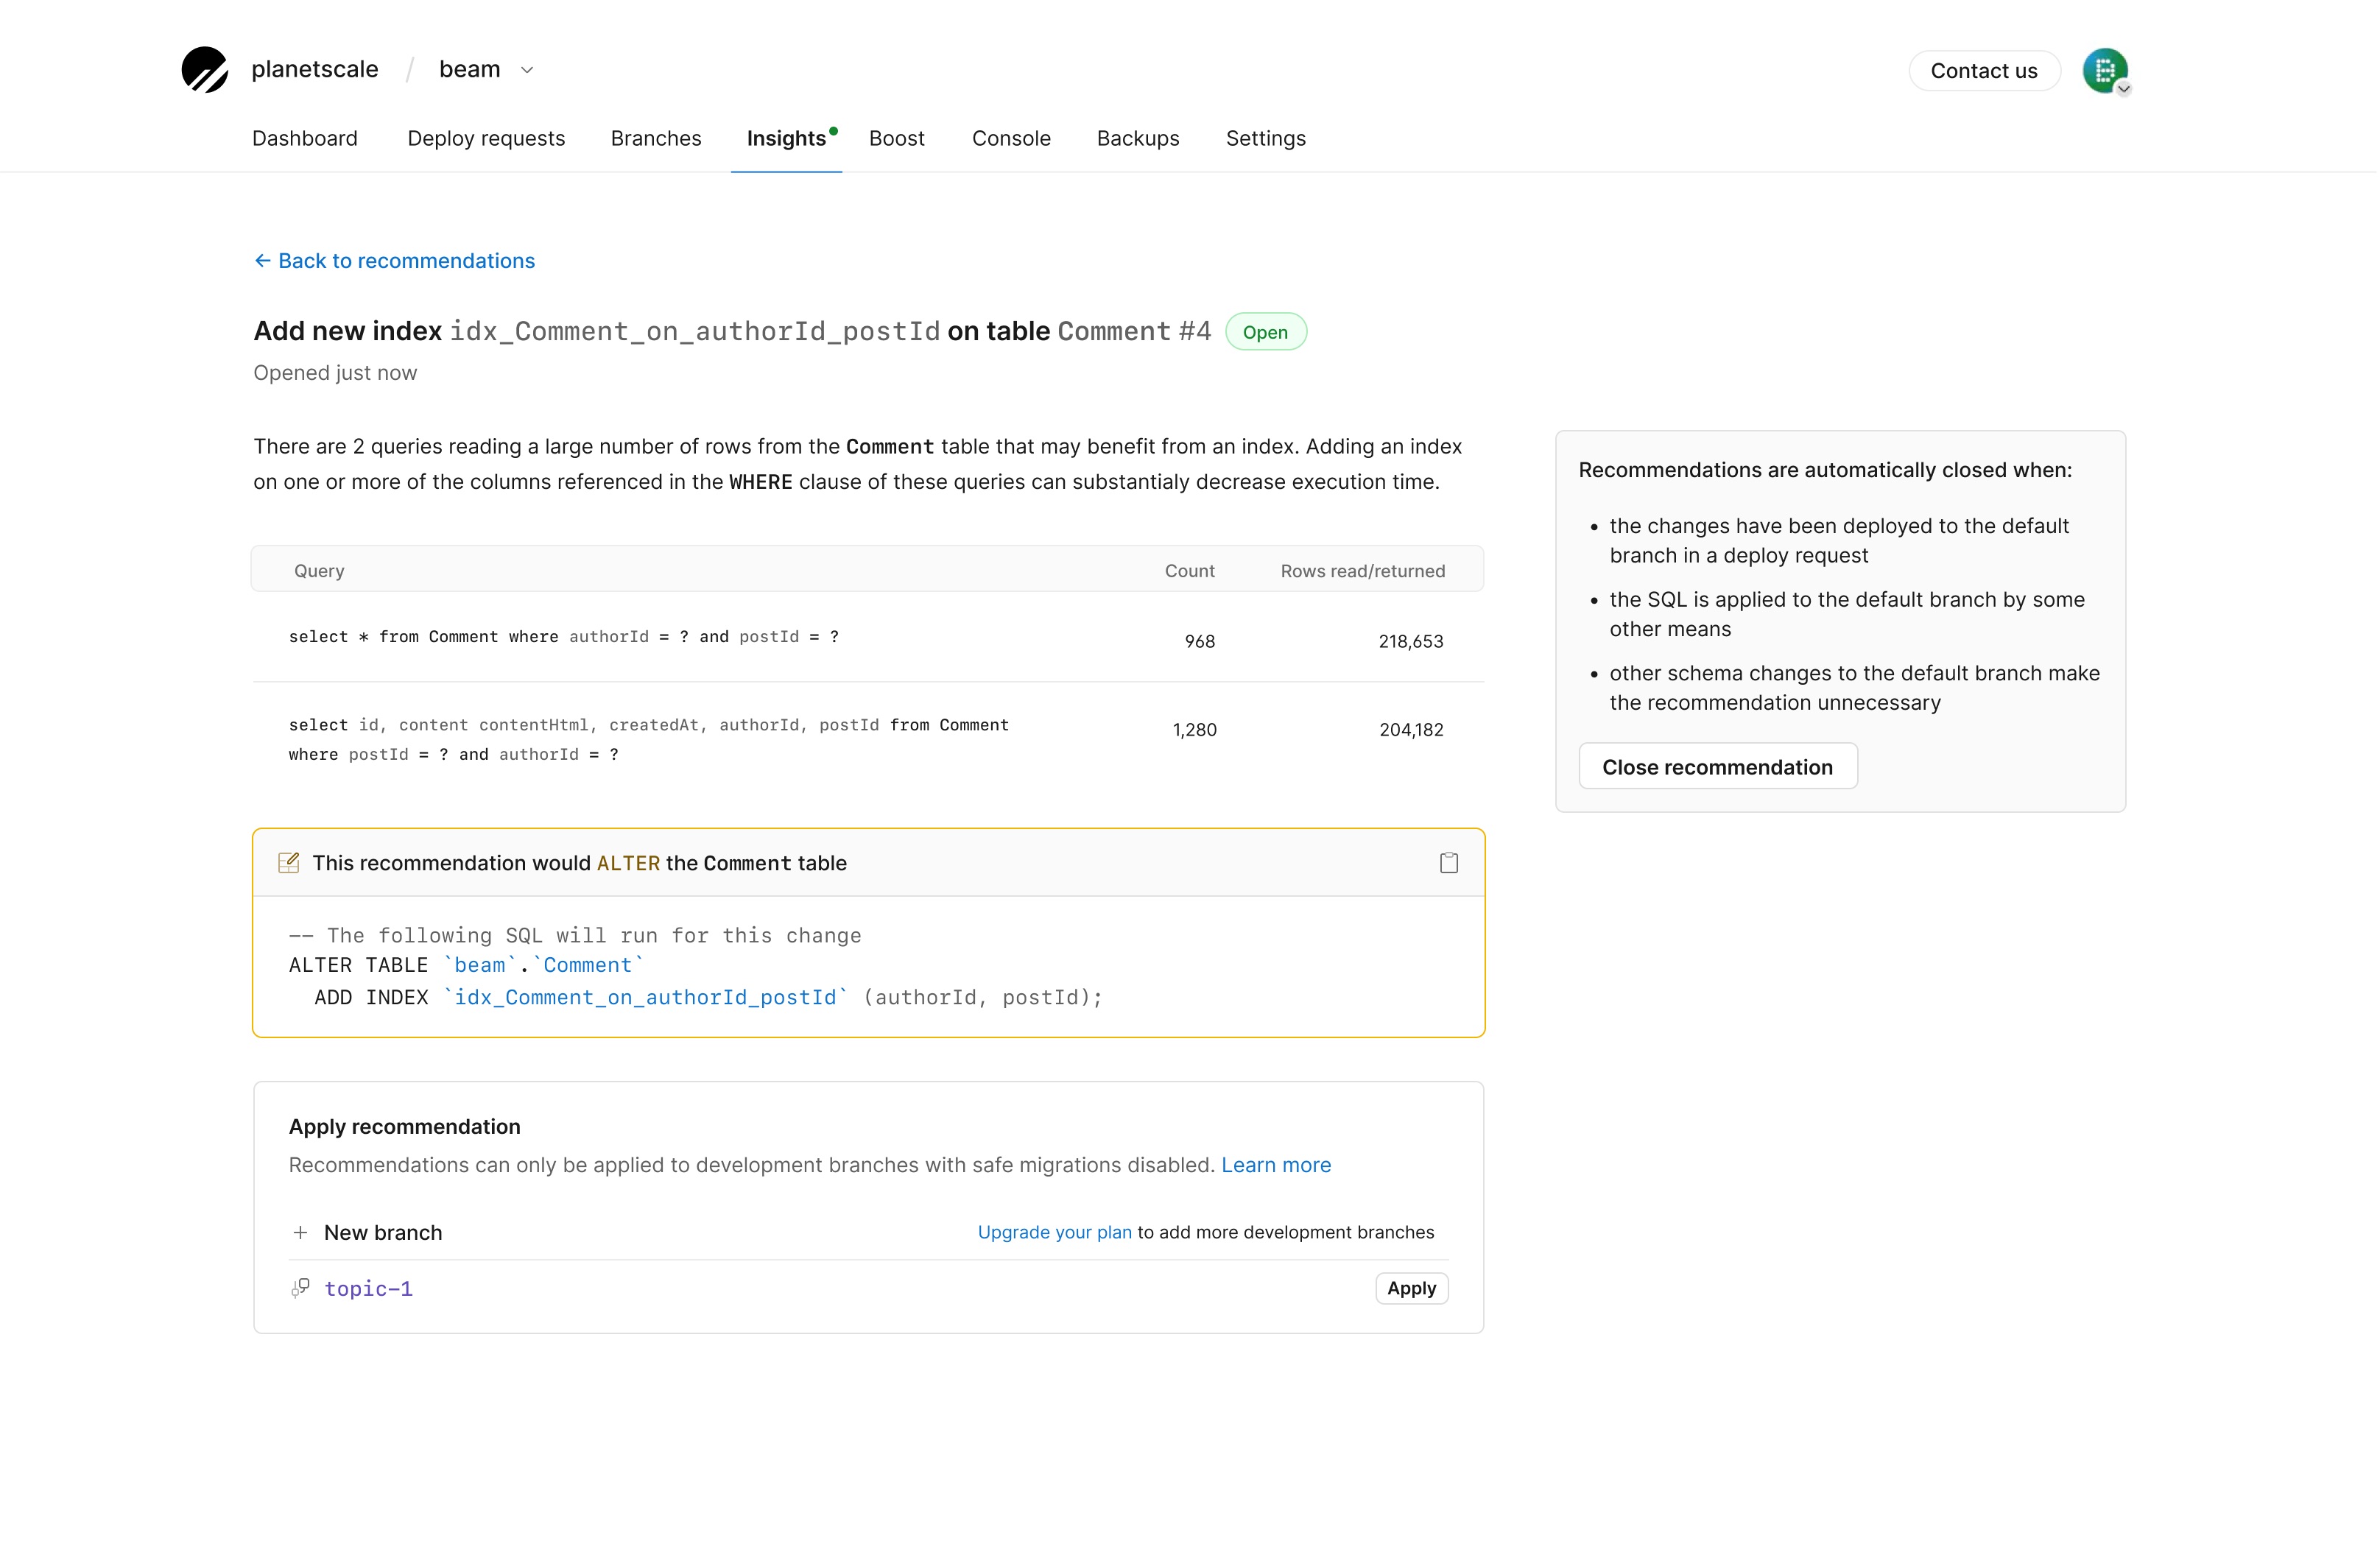
Each recommendation will have the following:
- An explanation of the recommended changes, including some of the benefits of the recommended change (E.g., reduced memory and storage, decreased execution time, prevent ID exhaustion)
- The schema or query that it will affect
- The exact DDL that will apply the recommendation
- The option to apply the recommended change to a branch for testing and a safe migration
You should evaluate each recommendation based on your specific use case. Read the schema recommendations documentation for more information on each recommendation.
Once you better understand the recommendation, you can apply the recommendation by either:
- Applying it directly through a database branch with a few clicks
- Making the schema change directly in your application or ORM code
Learn more about applying recommendations in the documentation.
How PlanetScale detects schema recommendations in your database
We’ve built a system that we internally refer to as the “Schema Advisor.” It can make schema recommendations and understand when a schema change closes an existing open recommendation.
Each time a production branch’s schema changes within PlanetScale, an event is emitted to Kafka. This triggers a background job to examine the schema for potential recommendations.
We can determine from the schema alone for some recommendations, such as finding duplicate indexes. We also use the databases’ recent query performance and statistics for other recommendations, such as index recommendations.
We first identify potential slow query candidates for index suggestions using Insights query data. We then use Vitess’s query parser and semantic analysis utilities to extract potential indexable columns for the query.
When adding indexes, column order is critically important. To get that right, we patched our fork of MySQL to create another variant of the ANALYZE TABLE ... UPDATE HISTOGRAM command that allows us to extract the cardinalities of each column without impacting the database’s statistics table.
With all this information combined, we can make recommendations on how to improve a database’s schema.
Supported schema recommendations
Today, we are launching with four different schema recommendations, but we will add more over time.
- Adding indexes for inefficient queries
- Removing redundant indexes
- Preventing primary key ID exhaustion
- Dropping unused tables
Adding indexes for inefficient queries
Indexes are crucial for relational database performance. With no indexes or suboptimal indexes, MySQL may have to scan a large number of rows to satisfy queries that only match a few records. This results in slow queries and poor database performance. The right index can reduce query execution time from hours to milliseconds. You can read more about how database indexes work in this blog post.
To find missing indexes, Insights scans your query performance data daily to identify queries over the past 24 hours for frequently issued queries with a high aggregate ratio of rows read compared to rows returned. It will then parse the query to extract indexable columns, estimate each column’s cardinality (number of unique values) to determine optimal column order and suggest a suitable index.
Removing redundant indexes
While indexes can drastically improve query performance, having unnecessary indexes slows down writes and consumes additional storage and memory.
Insights scans your schema every time it is changed to find redundant indexes. We suggest removing two types of indexes:
- Exact duplicate indexes - an index that has the same columns in the same order
- Left prefix duplicate indexes - an index that has the same columns in the same order as the prefix of another index
Redundant indexes are remarkably common. Our initial set of recommendations found that 33% of PlanetScale databases have redundant indexes that they may benefit from removing.
Preventing primary key ID exhaustion
As new rows are inserted, it’s possible for auto-incremented primary keys to exceed the maximum allowable value for the underlying column type. When the column reaches the maximum value, subsequent inserts into the table will fail, which can cause an outage for your application. This has been at the root of numerous high-profile outages throughout the years. With monitoring, it is very preventable.
Insights scans all of the AUTO INCREMENT primary keys in your database schema and checks the current AUTO INCREMENT value daily to identify where you might be approaching primary key ID exhaustion. If Insights detects that one of the columns is above 60% of the maximum allowable type, it will recommend changing the underlying column to a larger type.
Additionally, Insights scans queries to parse joins and correlated subqueries to find foreign keys and suggests increasing the column size for those columns.
Dropping unused tables
Dropping unused tables can help clean up data that is no longer needed and reduce storage. If the table is large, it can also decrease backup and restore time.
Insights scans your query performance data daily to identify if any tables are more than four weeks old and haven’t been queried in the last four weeks.
Example: Adding a new index
Let’s walk through an example of applying a new index recommendation to a database. To start, we’ll create a simple posts table:
CREATE TABLE `posts` (
  `id` bigint unsigned NOT NULL AUTO_INCREMENT,
  `title` varchar(255),
  `text` text,
  PRIMARY KEY (`id`)
)
After the table is in production, two different queries start querying against it: The first inserts rows to the posts table in a loop and the second query performs a lookup on the posts.title in a loop:
select posts.id from posts where posts.title = ?
As we add more rows to the posts table, a pattern emerges:
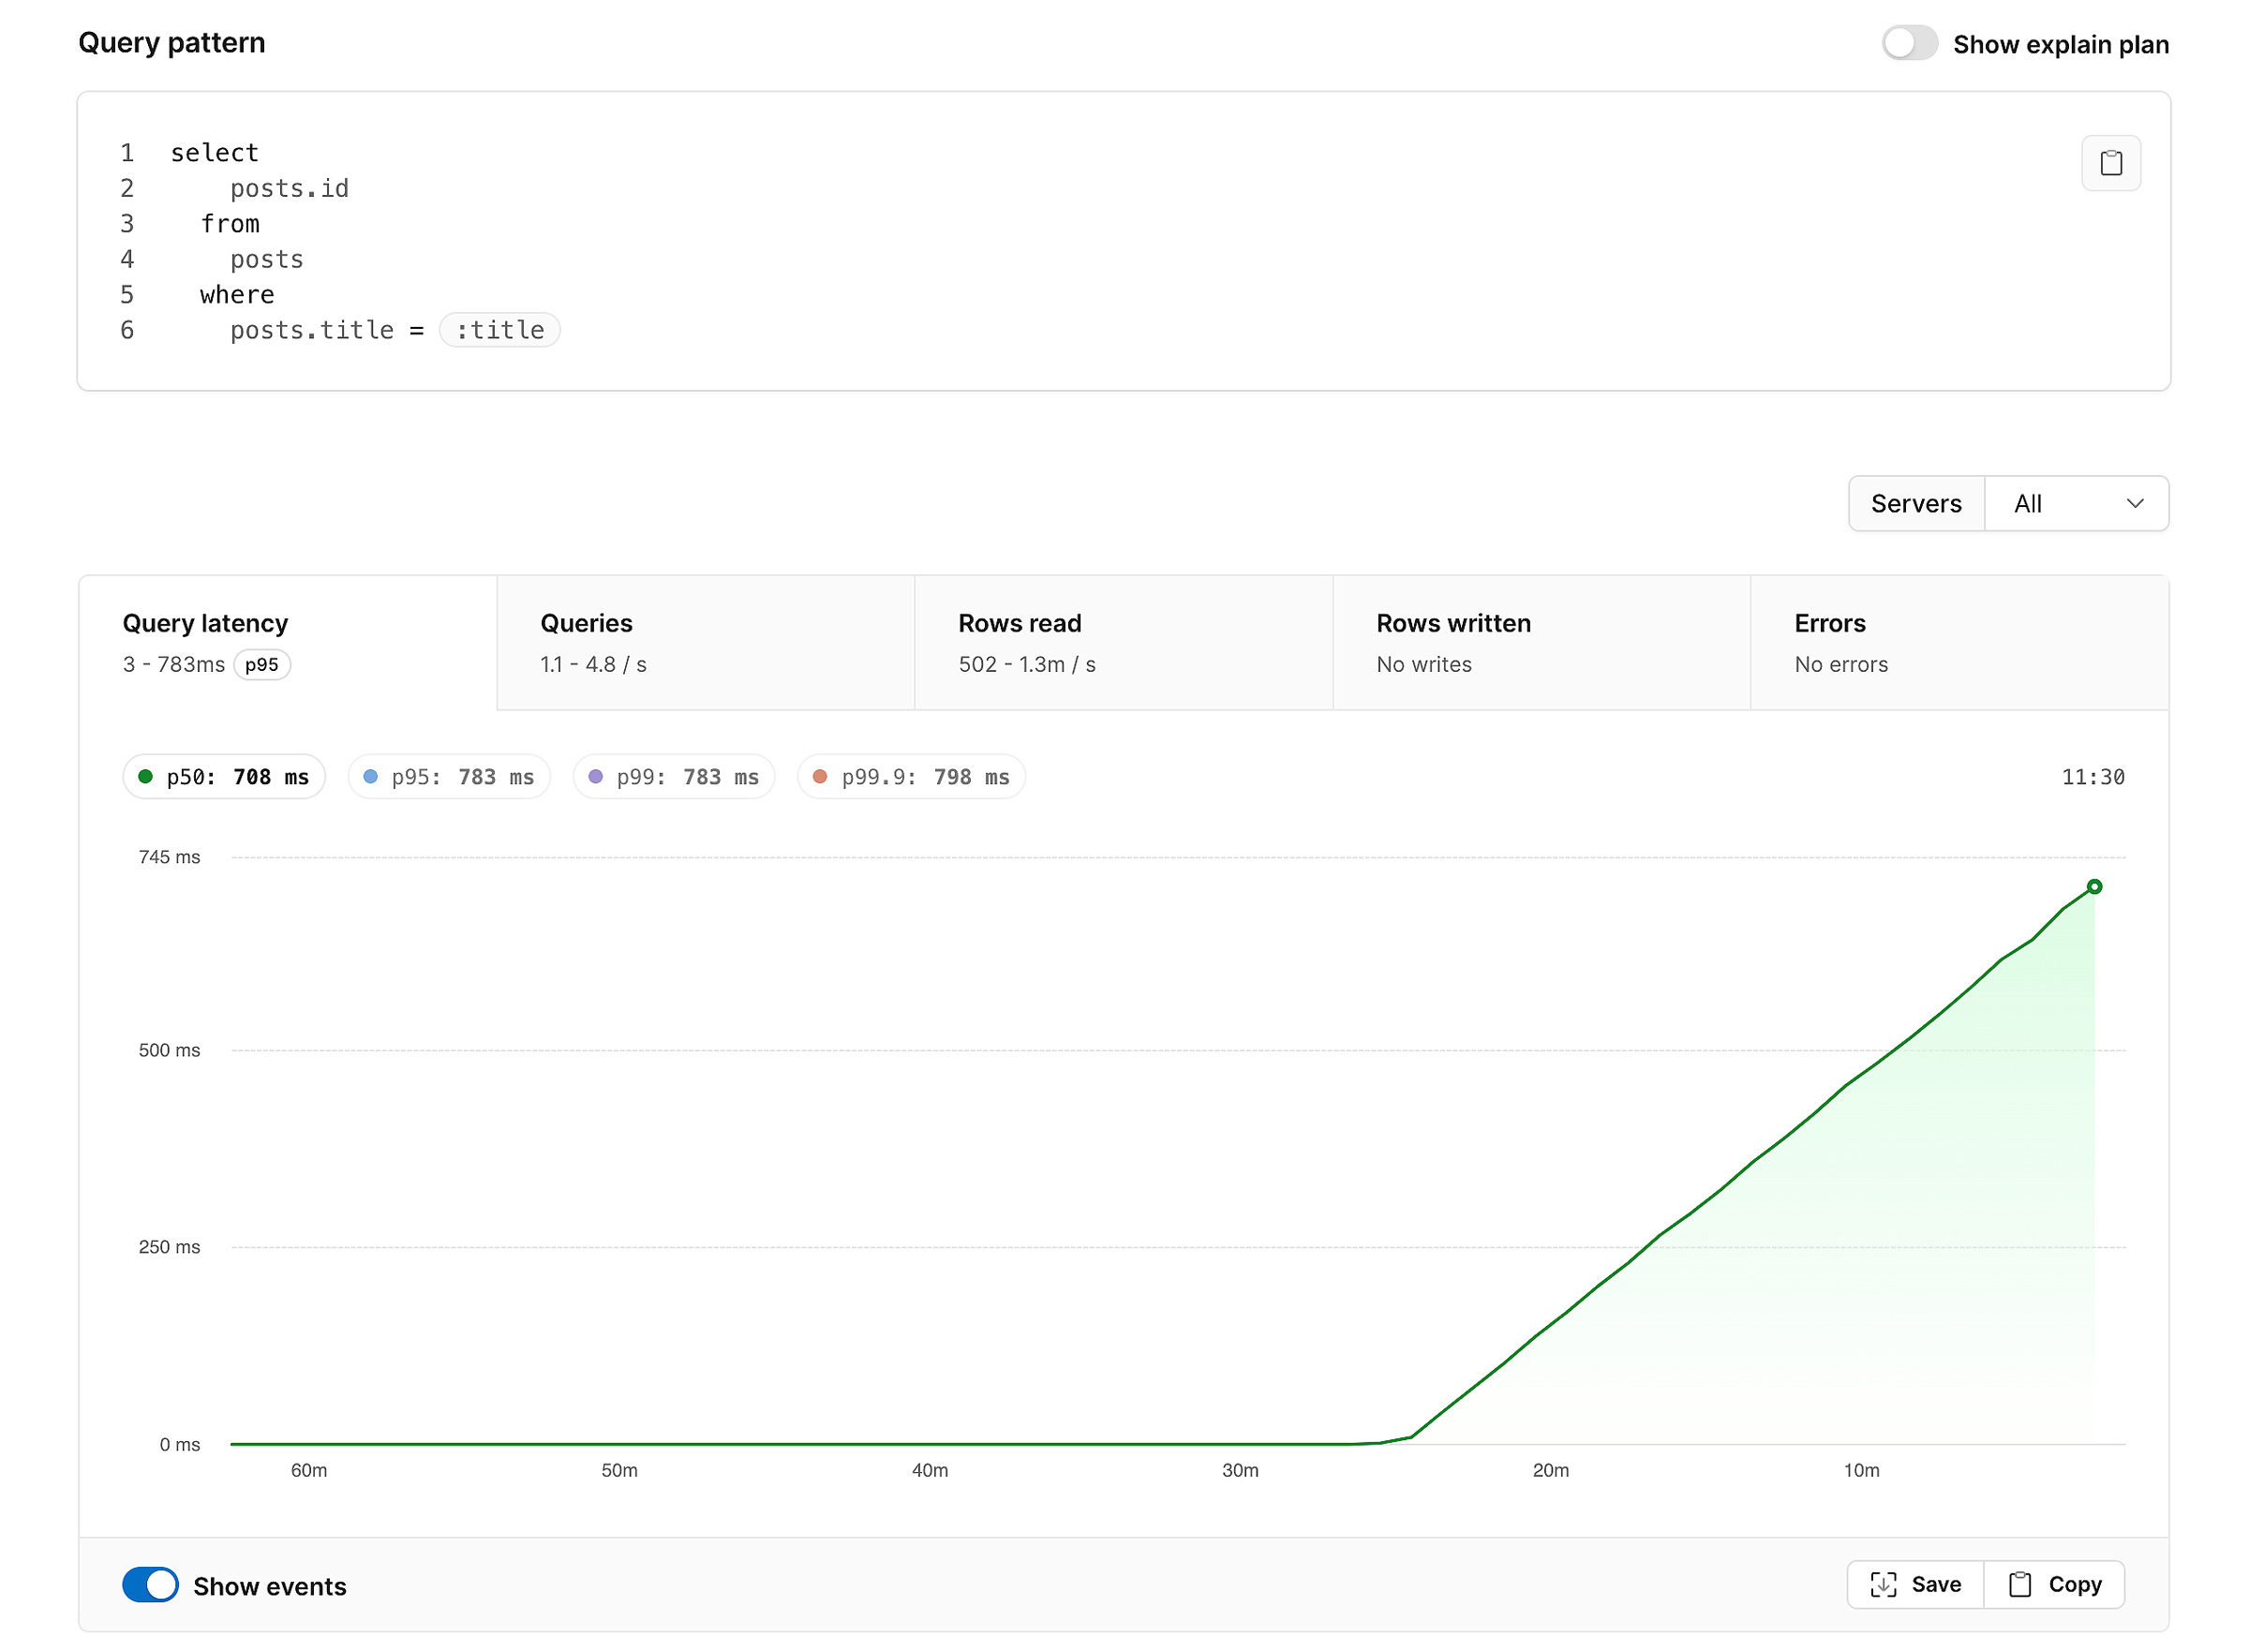
As we insert more rows into the posts table, the p50 time for a posts.title increases linearly. At this point, our queries are taking nearly a second, which is not good.
Luckily, our add an index recommendation runs once daily and can identify that this query pattern could benefit from an index. In the recommendation, we see a list of the queries that can use the new index, as well as a description of the DDL that will create the new index:
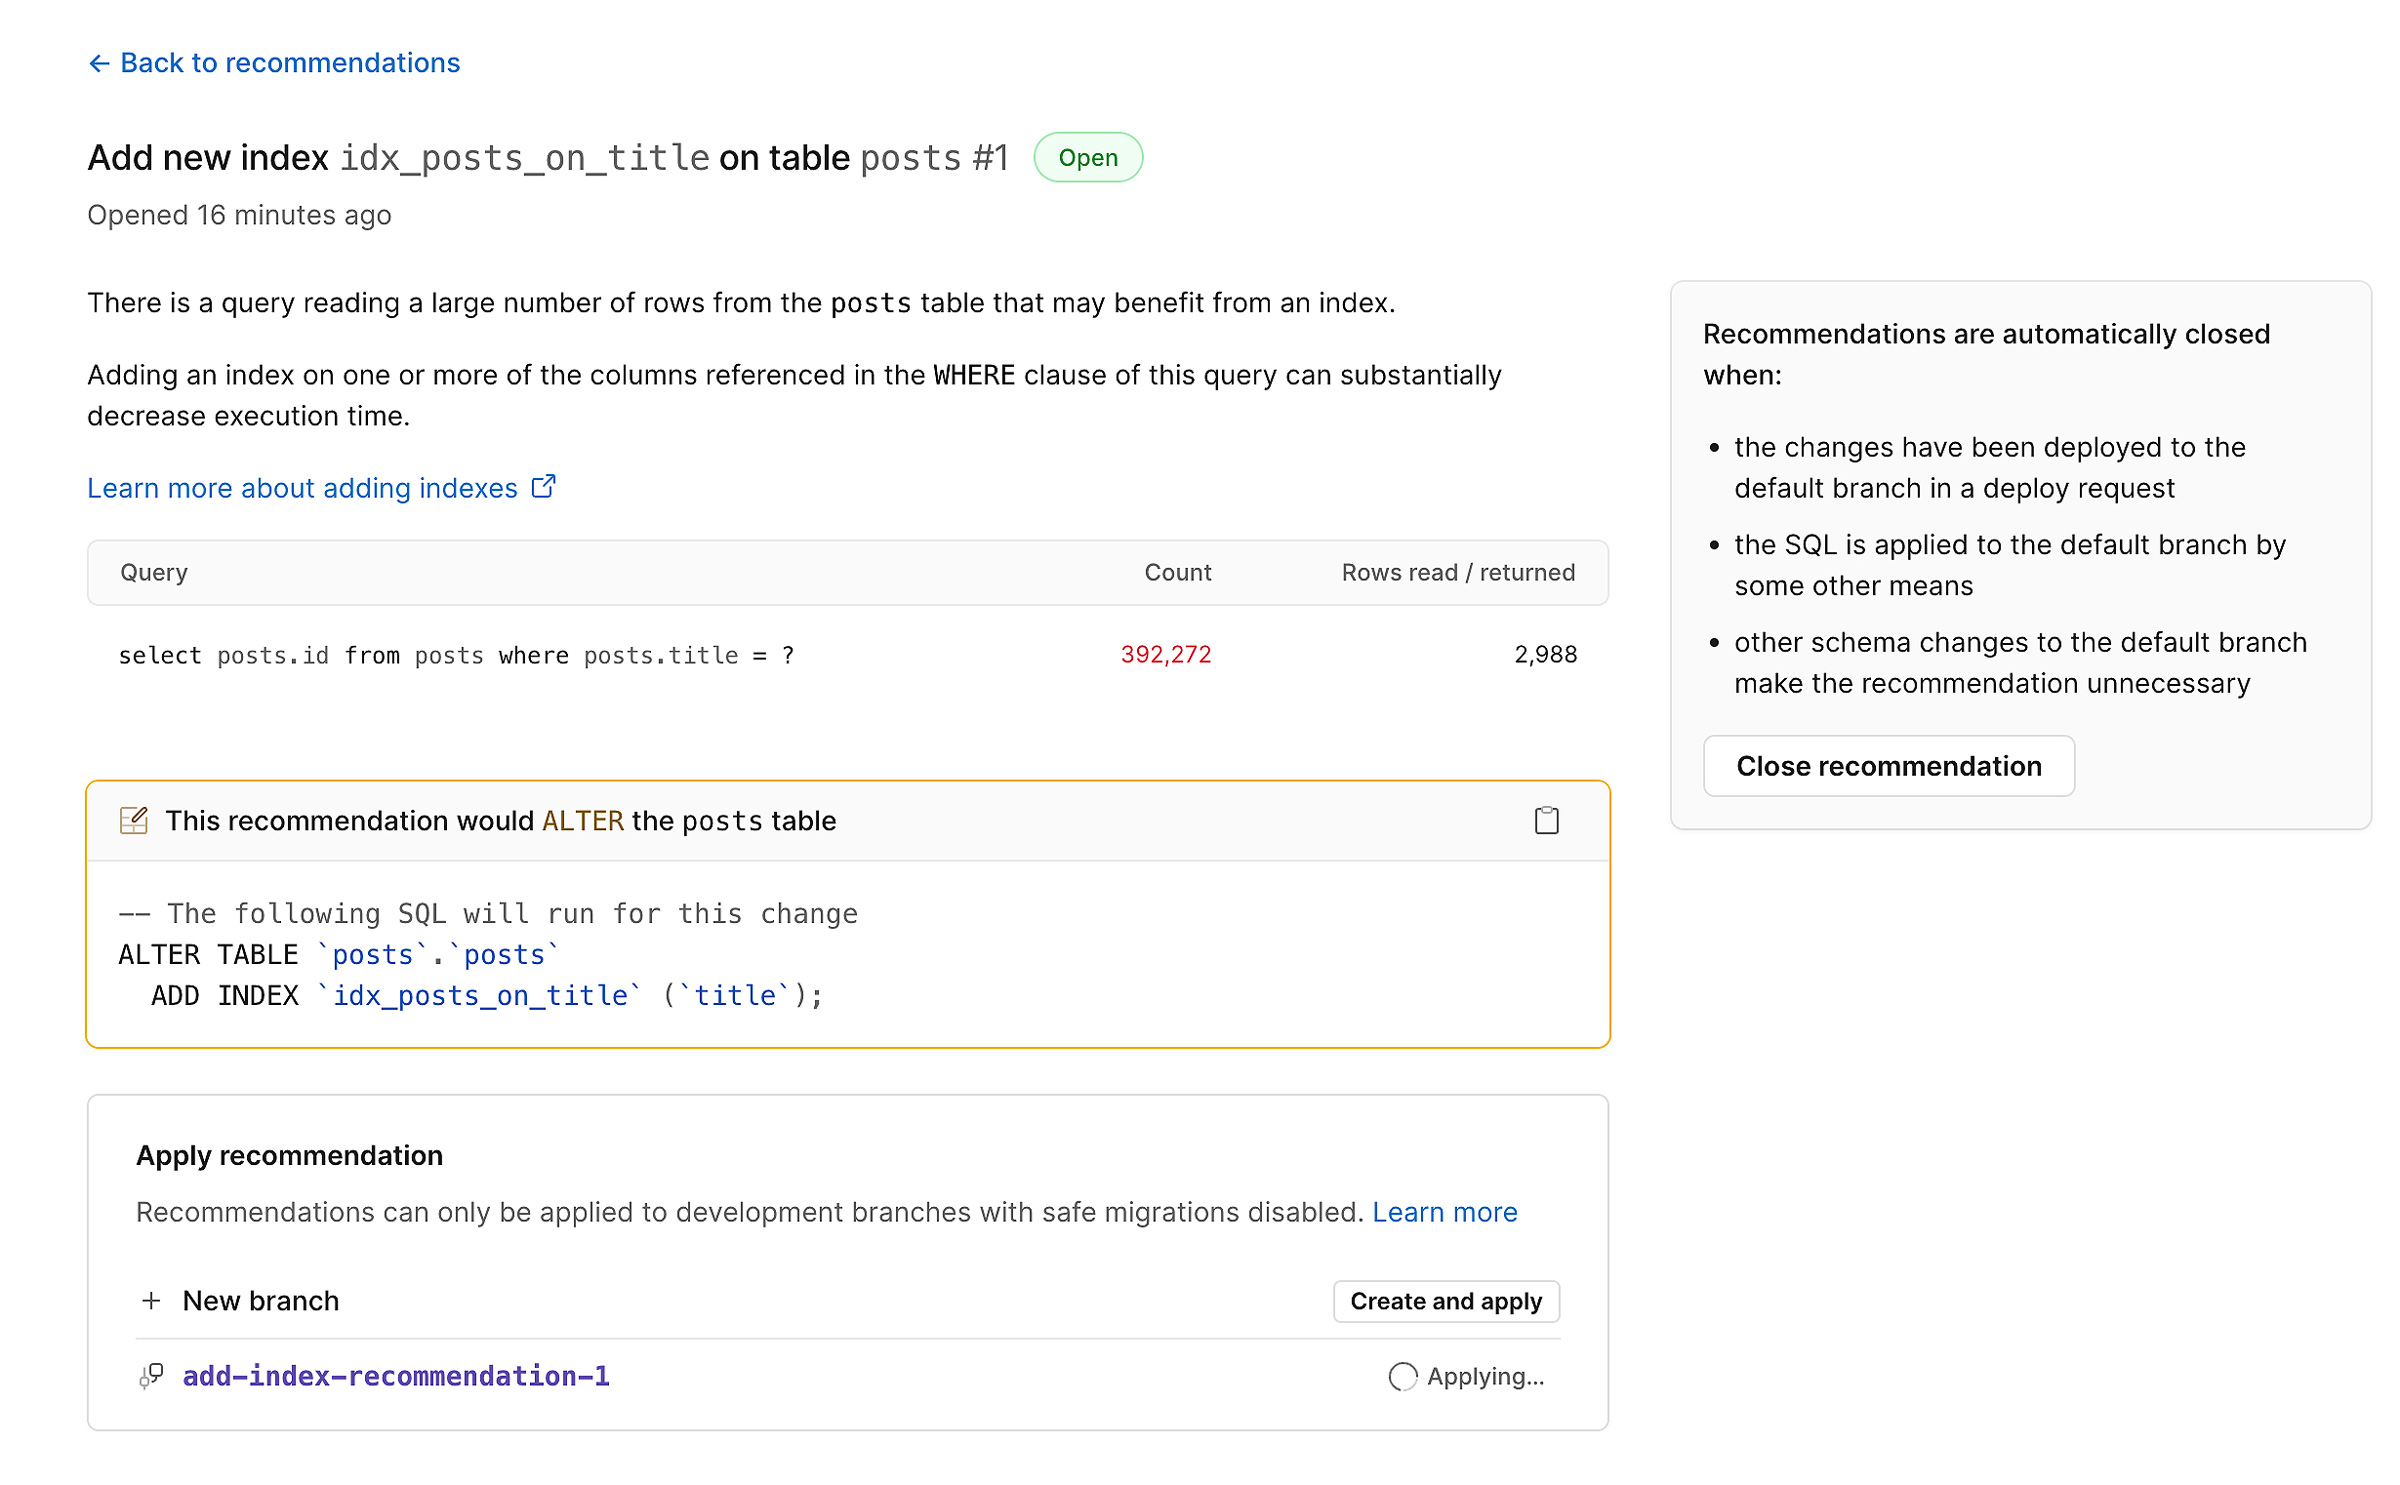
We can use the “Create and apply” option to create a database branch in PlanetScale and apply the recommended DDL. Then, once we have tested everything on the branch with our existing queries, we deploy it to production. With the change in production, we can now return to our initial query to see the impact of adding the new index:
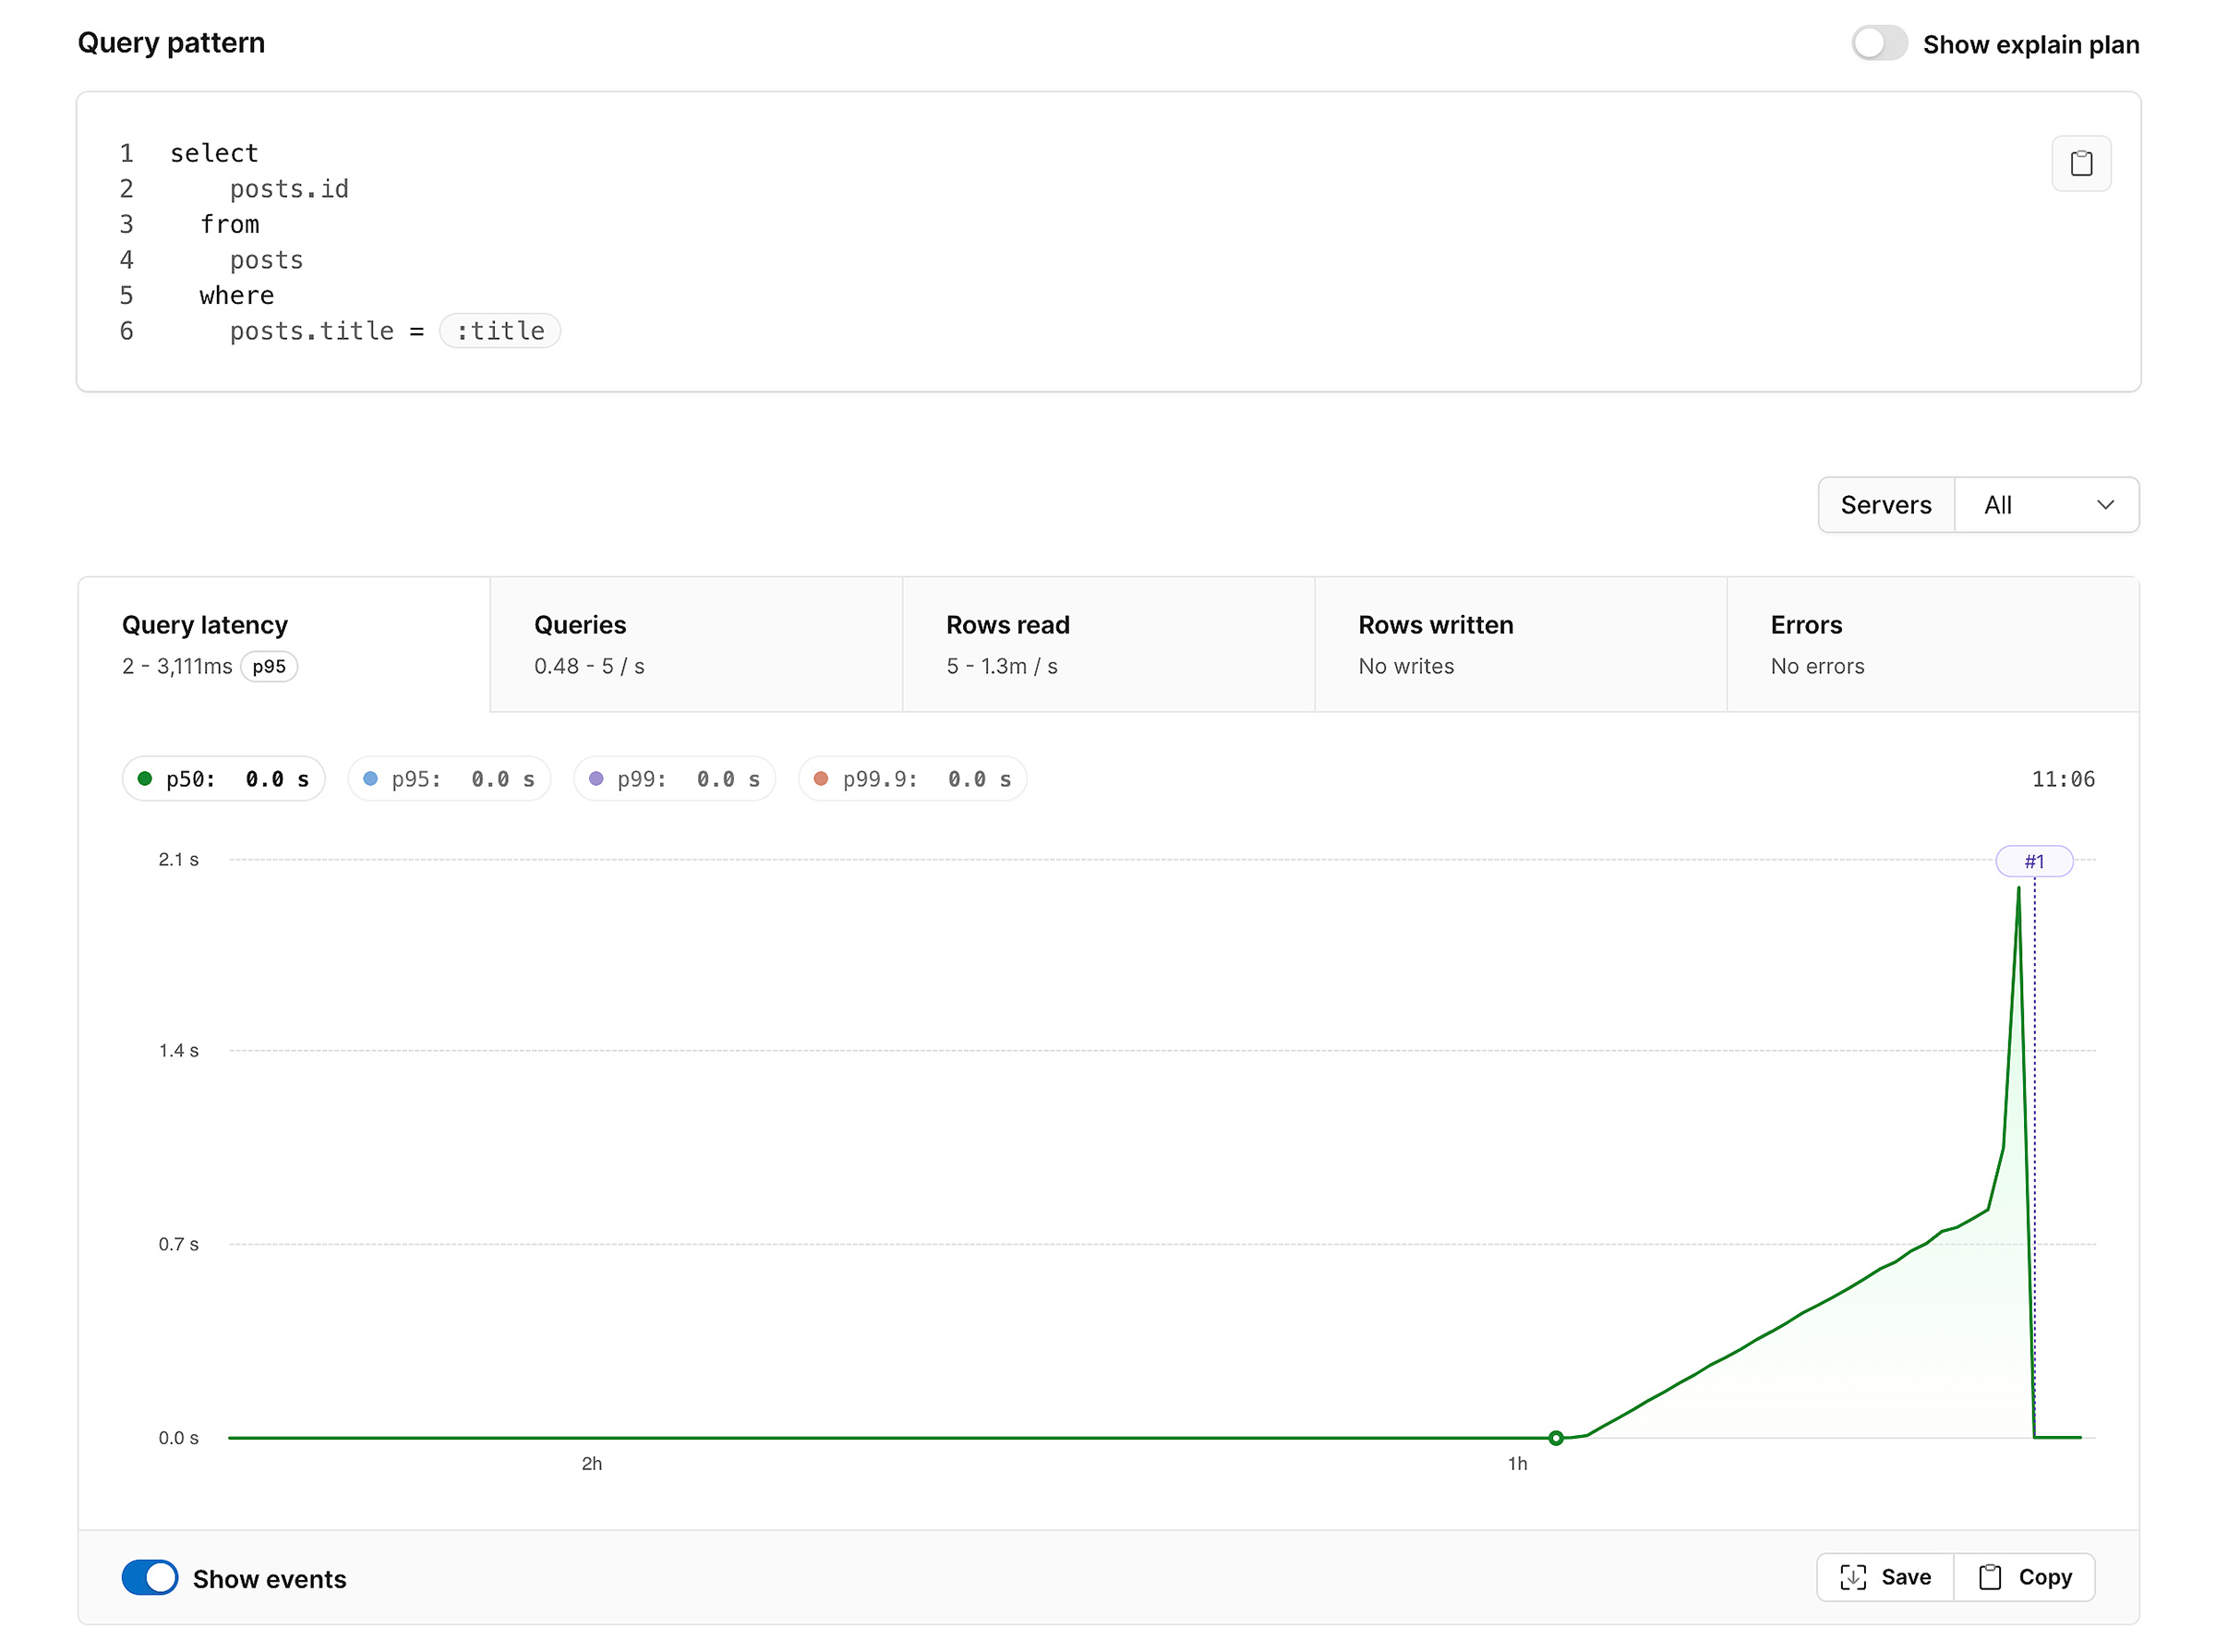
As expected, the p50 query time dropped drastically after the recommendation was deployed to production due to adding the recommended index.
For more information on schema recommendations inside of PlanetScale Insights, read the schema recommendation documentation.