













Postgres 18 released a few weeks ago, and there's plenty of hype around the improvements it's bringing. Most notably, Postgres 18 introduces the io_method configuration option, allowing users more control over how disk I/O is handled.
Setting this to sync results in the same behavior as 17 and earlier versions. With this, all I/O happens via synchronous requests.
18 introduces two alternatives: worker and io_uring. worker (the new default) causes Postgres to use dedicated background worker processes to handle all I/O operations. io_uring is the change many are excited about for performance reasons, as it uses the Linux io_uring interface to allow all disk reads to happen asynchronously. The hope is that this can lead to significantly better I/O performance.
We conducted detailed benchmarks to compare the performance on Postgres 17 and 18. Let's see if these improvements are all they're hyped up to be.
Benchmark configurations
sysbench was used for executing the benchmarks. The io_uring improvements only apply to reads, so the focus here will be on the oltp_read_only benchmark. This includes both point selects and queries that do range scans and aggregations controlled by the --range_size argument. Though it would be interesting to also benchmark write and read/write combo performance as well, sticking to read-only helps focus this discussion. We set the data size to be TABLES=100 and SCALE=13000000 which produces a ~300 GB database (100 tables with 13 million rows each).
The benchmarks were conducted on four different EC2 instance configurations:
| Instance | vCPUs | RAM | Disk | Disk type | IOPS | Throughput |
|---|---|---|---|---|---|---|
| r7i.2xlarge | 8 | 64 GB | 700 GB | gp3 | 3,000 | 125 MB/s |
| r7i.2xlarge | 8 | 64 GB | 700 GB | gp3 | 10,000 | 500 MB/s |
| r7i.2xlarge | 8 | 64 GB | 700 GB | io2 | 16,000 | - |
| i7i.2xlarge | 8 | 64 GB | 1,875 GB | NVMe | 300,000 | - |
All these instances run on the same (or extremely similar) Intel CPUs. We include the i7i instance to show what Postgres is capable of with fast, local NVMe drives. This is what we use for PlanetScale Metal and have seen amazing performance results for Postgres 17. Many other cloud providers only provide a form of network-attached storage, whereas we provide both options.
Each server is warmed with 10 minutes of query load prior to benchmarking.
On each one of these configurations, we ran the sysbench oltp_read_only benchmark with the following configurations for 5 minutes each:
- Single connection and
--range_size= 100 - 10 connections and
--range_size= 100 - 50 connections and
--range_size= 100 - Single connection and
--range_size= 10,000 - 10 connections and
--range_size= 10,000 - 50 connections and
--range_size= 10,000
This leads to a total of 24 unique 5-minute benchmark runs. These 24 configurations were run four times each! Once on Postgres 17 and once on each of Postgres 18 with io_method=worker, io_method=io_uring and io_method=sync. This makes a total of 96 benchmark combinations. Go ahead, tell me I'm crazy!
This is an extremely I/O-intensive workload. The data size (300 GB) far exceeds RAM size (64 GB), so there will be significant disk accesses for the queries being executed here.
Single connection
Though a single connection is an unrealistic production workload, it offers a baseline for how the different I/O settings affect straight-line performance. Let's assess the QPS we can achieve here.
Below is the average QPS for all single-connection runs where the --range_size value is set to the default of 100. This means that the full read workload is composed of a combination of point-select queries, and queries that do scans / aggregations of 100-row sequences.
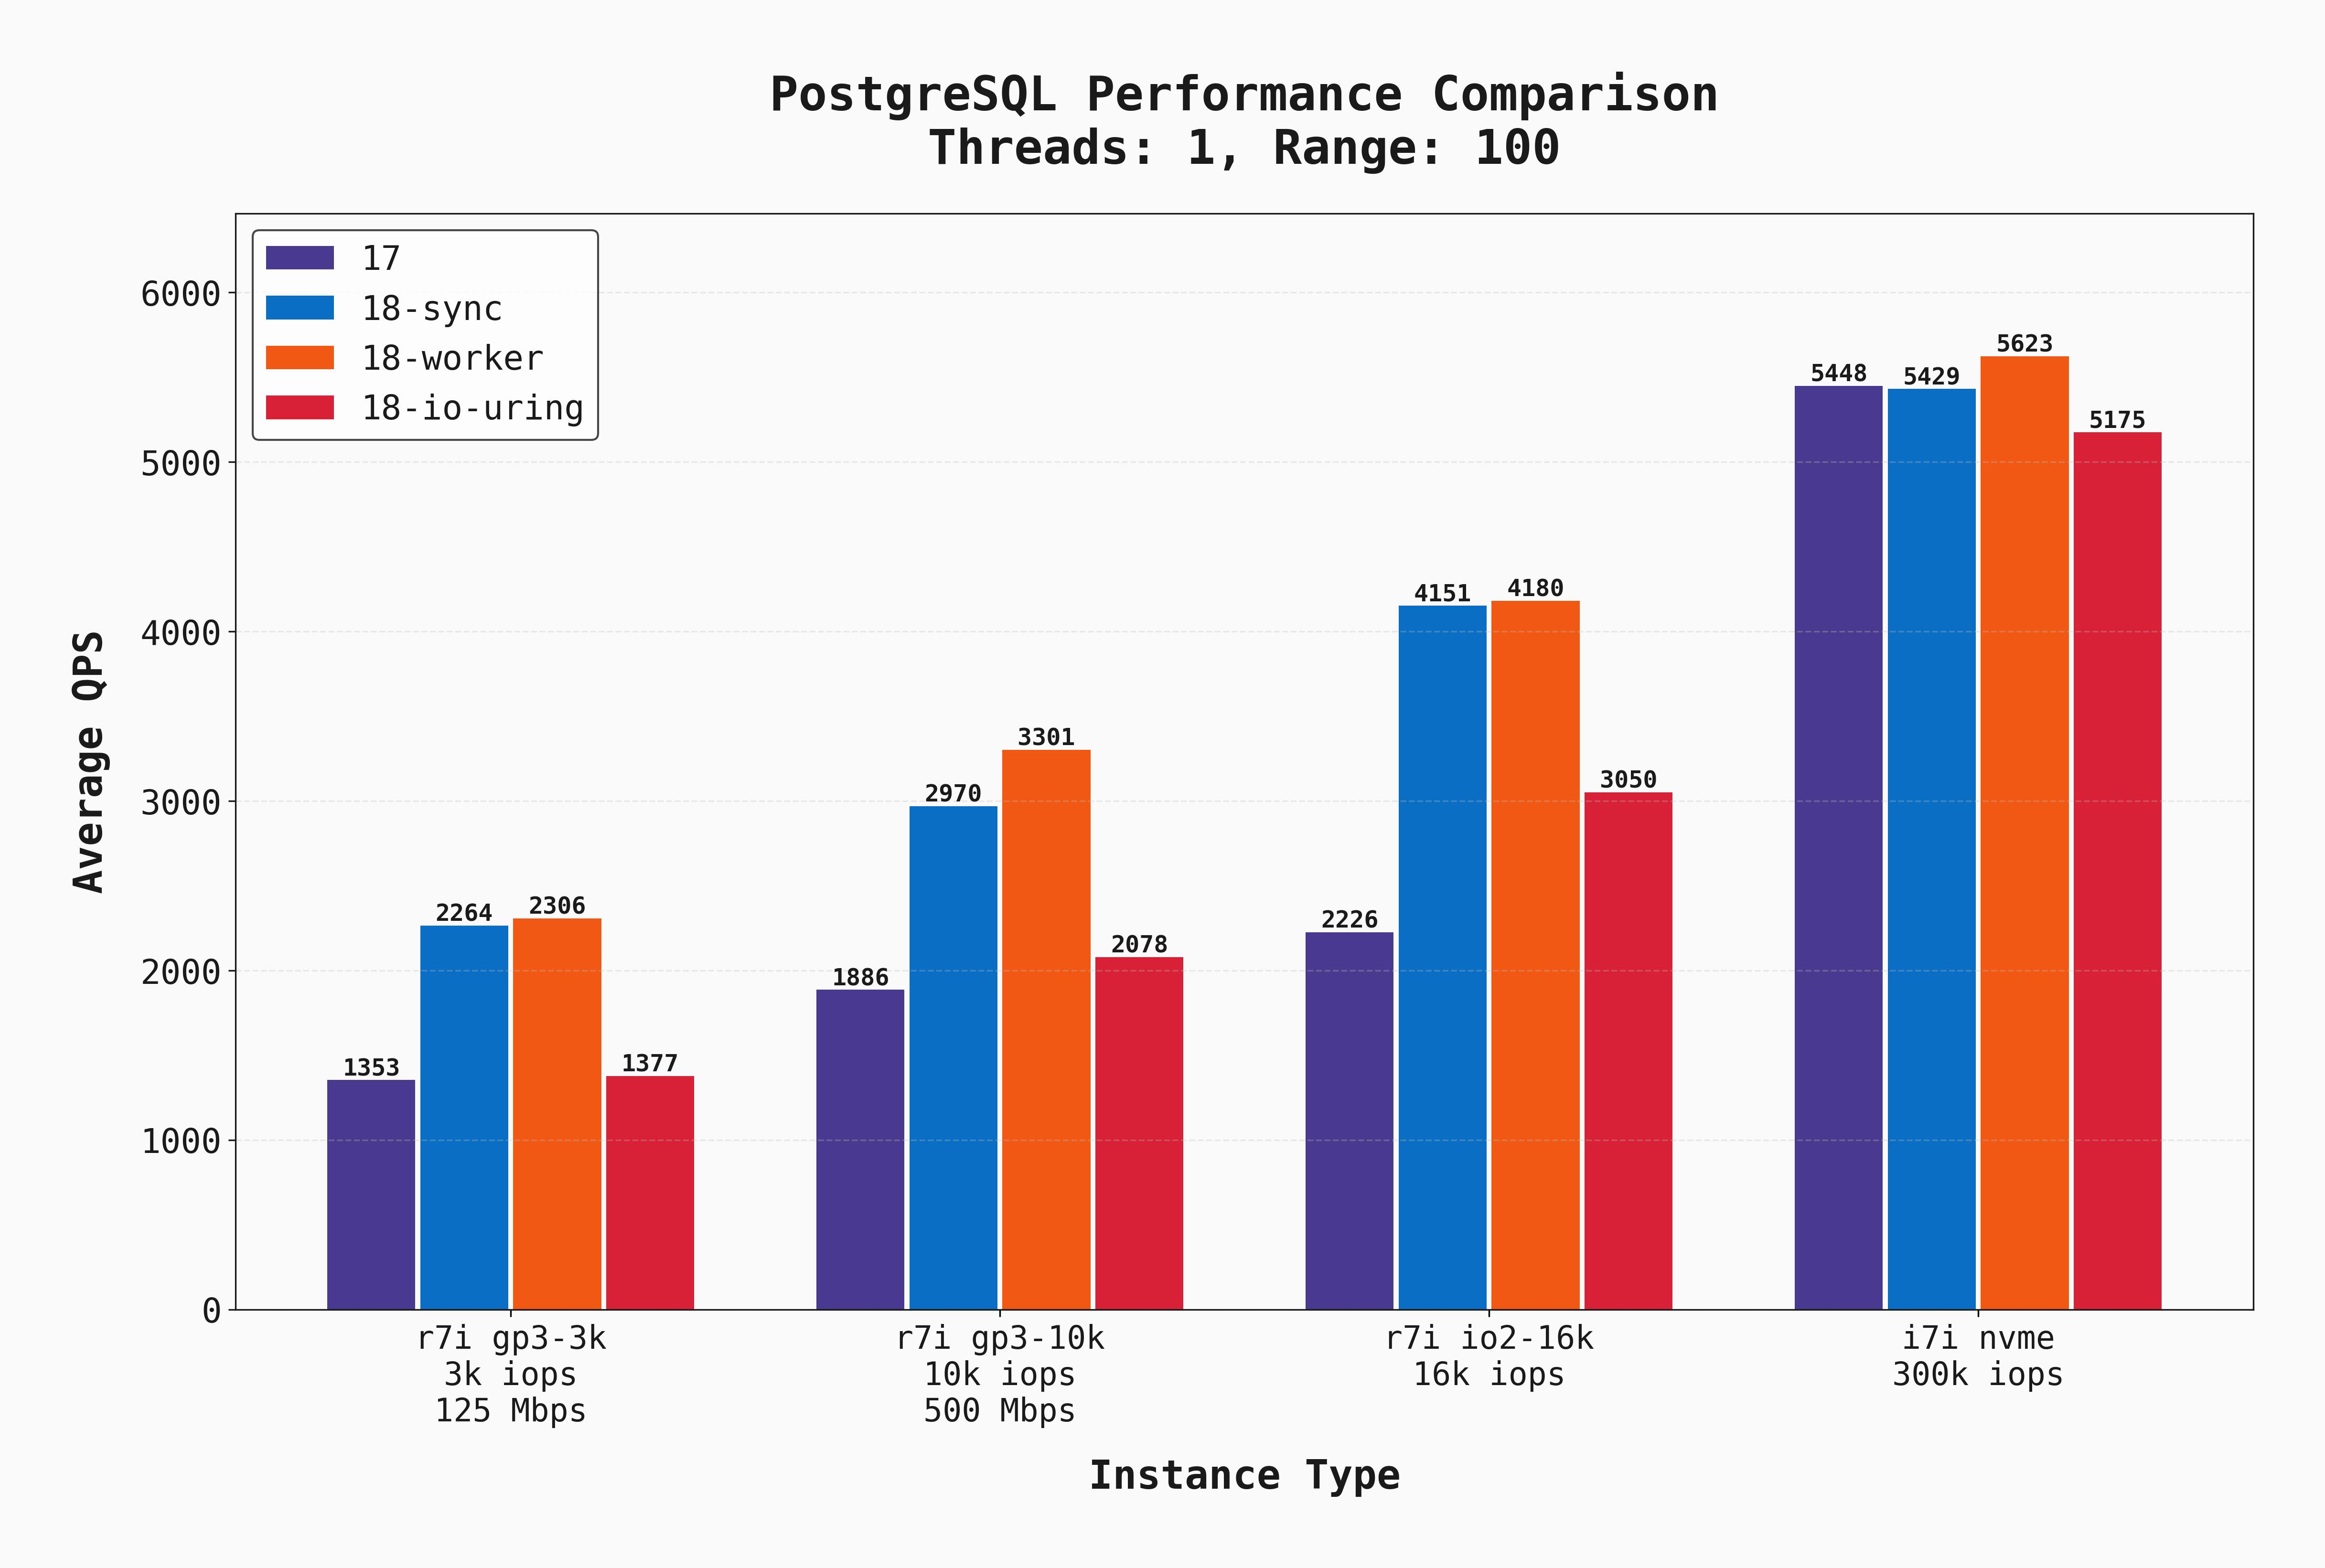
A few things are clear:
- On network-attached storage (gp3, io2) Postgres 18 in
syncandworkermodes perform noticeably better than 17 and 18 withio_uring. I'll admit, this surprised me! My expectation was thatio_uringwould perform as well as if not better than all these options. - The latency of gp3 and even io2 is clearly a factor in this difference. On an instance with a low-latency local NVME drive, all options are much more evenly matched.
- The latency / IOPS of gp3 and even the very expensive io2 drive are a limiting factor. Local disks outperform in all configurations.
- For straight-line performance with short-lived queries, Postgres 18 is much faster. Welcome improvements!
Here is the same test except with --range_size=10000. This means the workload has much larger scans / aggregates, which means more sequential I/O and lower QPS:
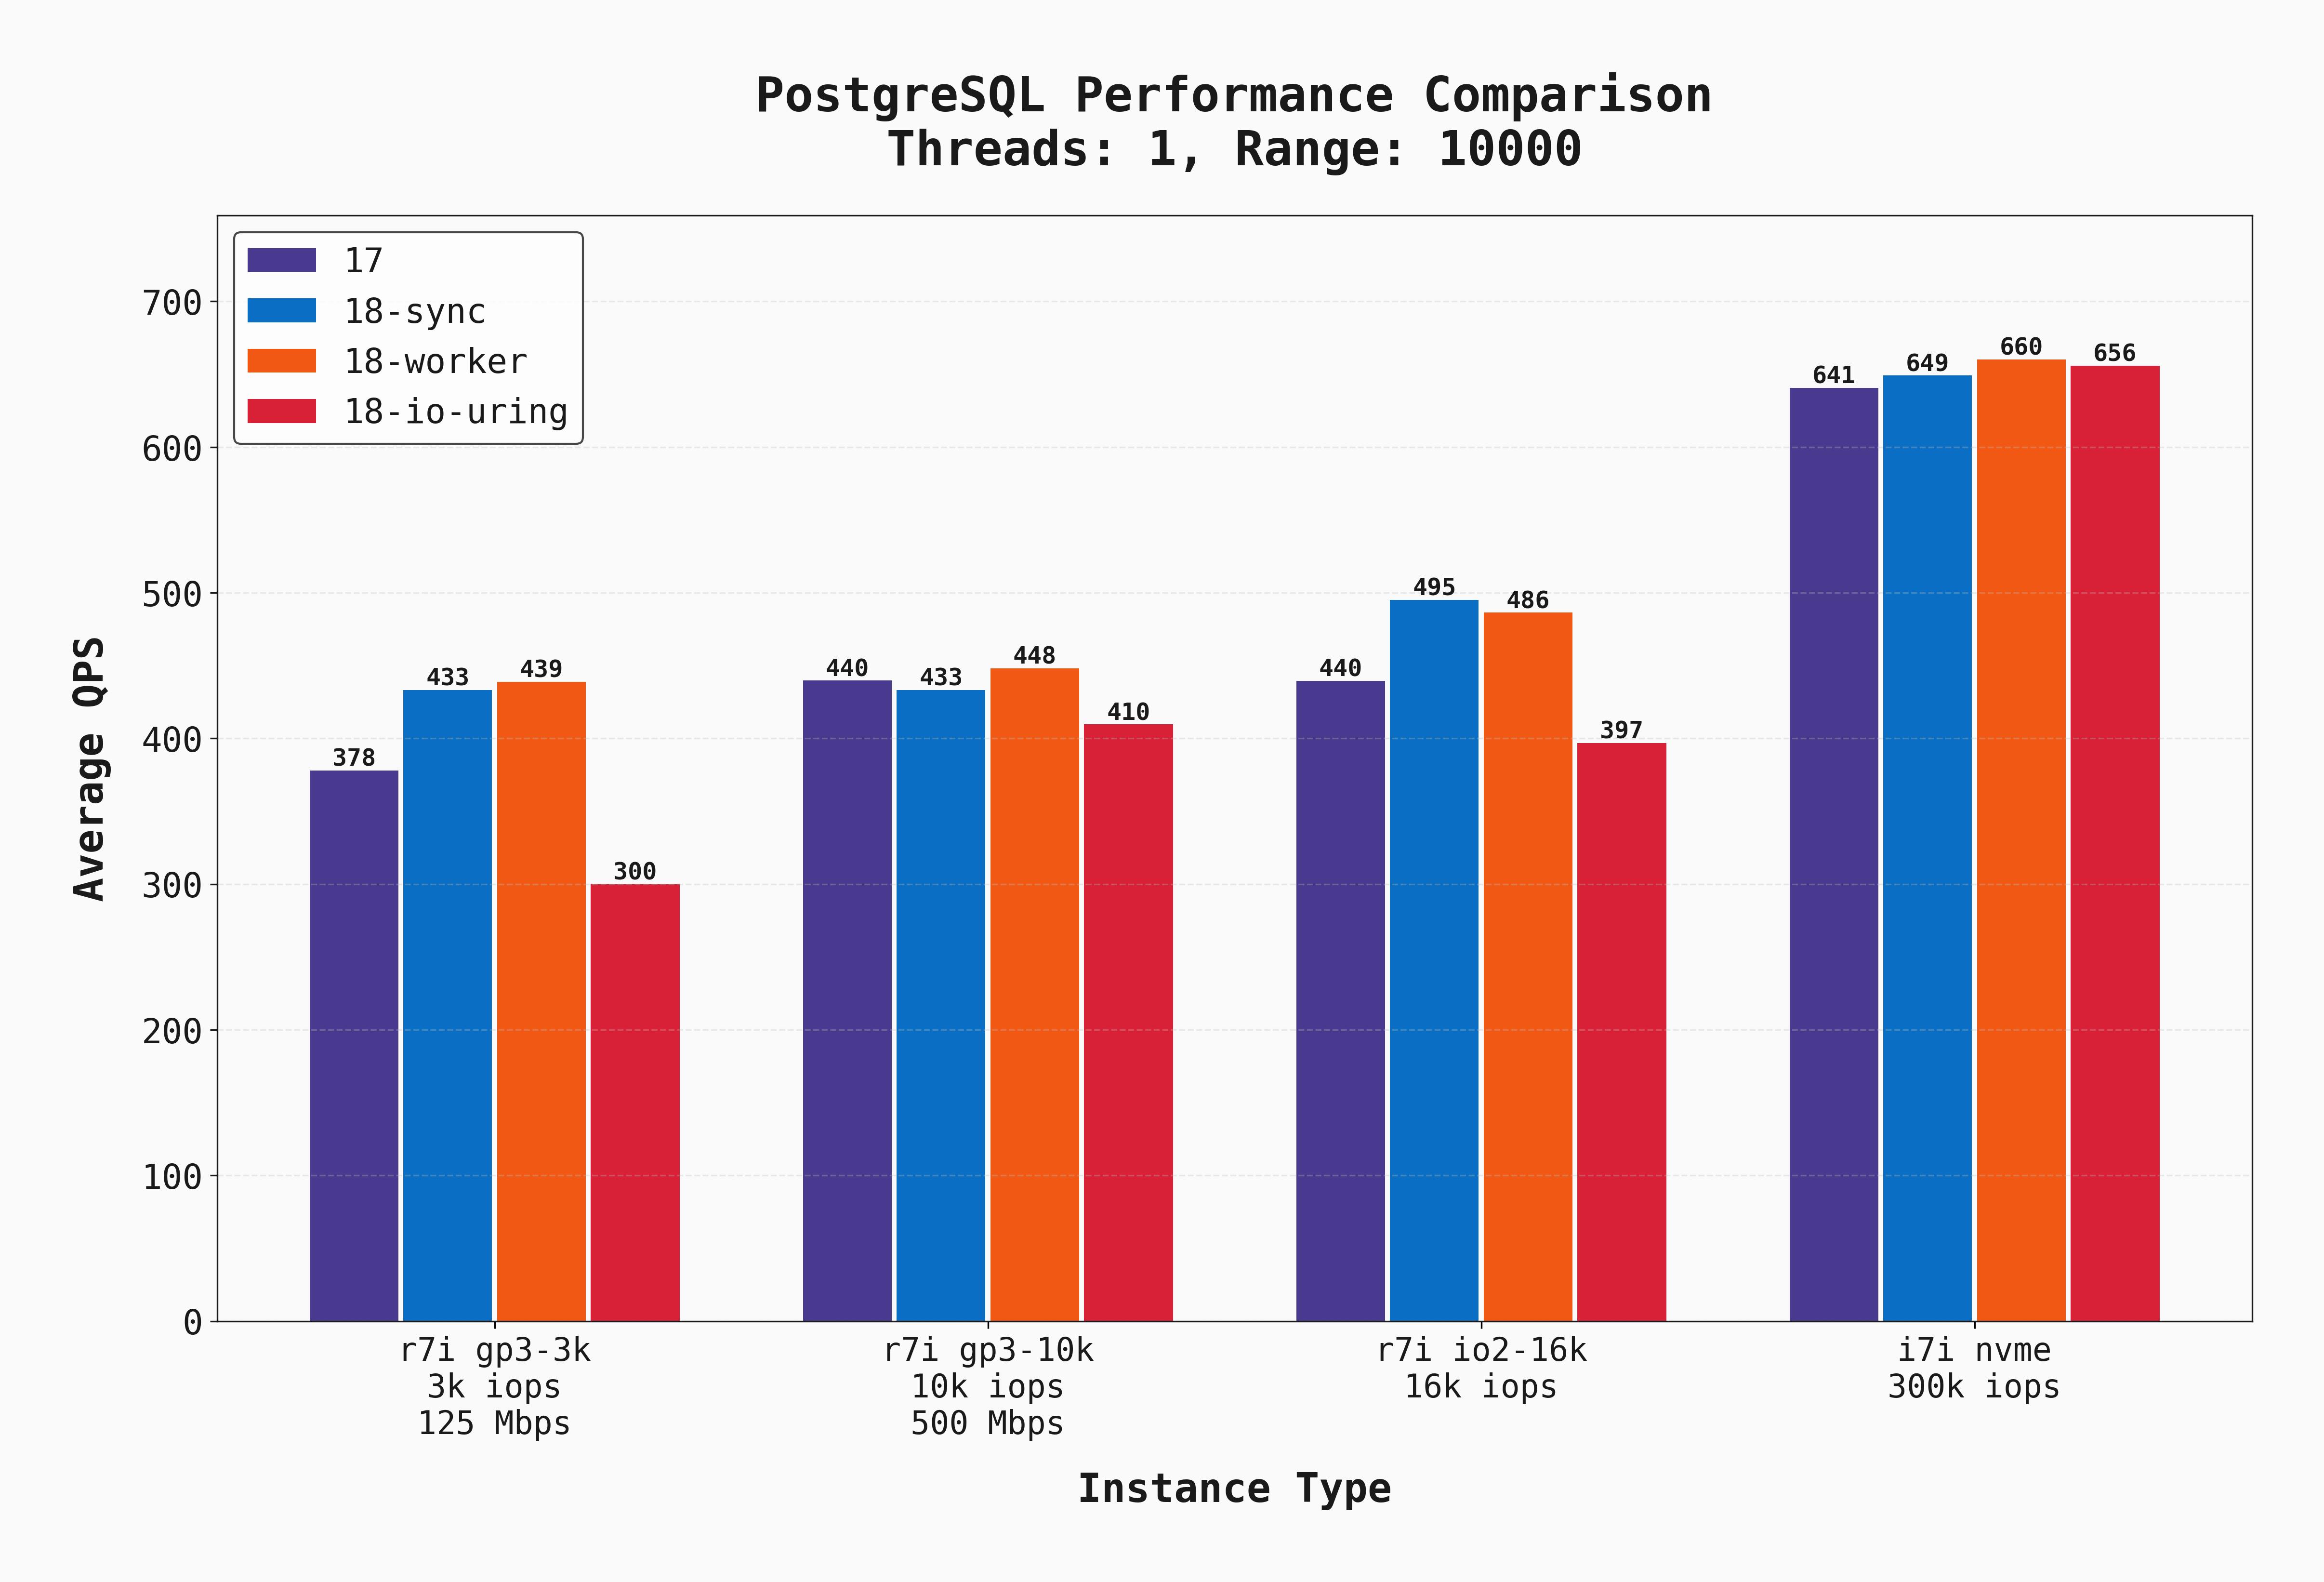
Local disks still clearly outperform, but the difference between the other three options is less stark. This is due to a combination of (a) more sequential I/O but more importantly (b) more CPU work (aggregating 10k rows is more CPU-intensive than aggregating 100 rows). Additionally, the delta between postgres 17 and 18 is much smaller.
Below is an interactive visual comparing the Postgres 17 results for all instance types with the best performer on Postgres 18, workers. Click on the thumbnails to add or remove lines from the graph and compare various combinations. This is based on a 10-second sample rate.
High concurrency
In real-world scenarios, we have many simultaneous connections and many reads happening at once. Let's look at how each of these servers handles the same benchmark but with much higher load across 50 connections.
Of course, oltp_read_only does not capture a realistic OLTP workload, especially since it does not include writes, but we use it as a proxy for workloads with high read demands. Below, we show the average QPS for all of the 50-connection oltp_read_only with --range_size=100.
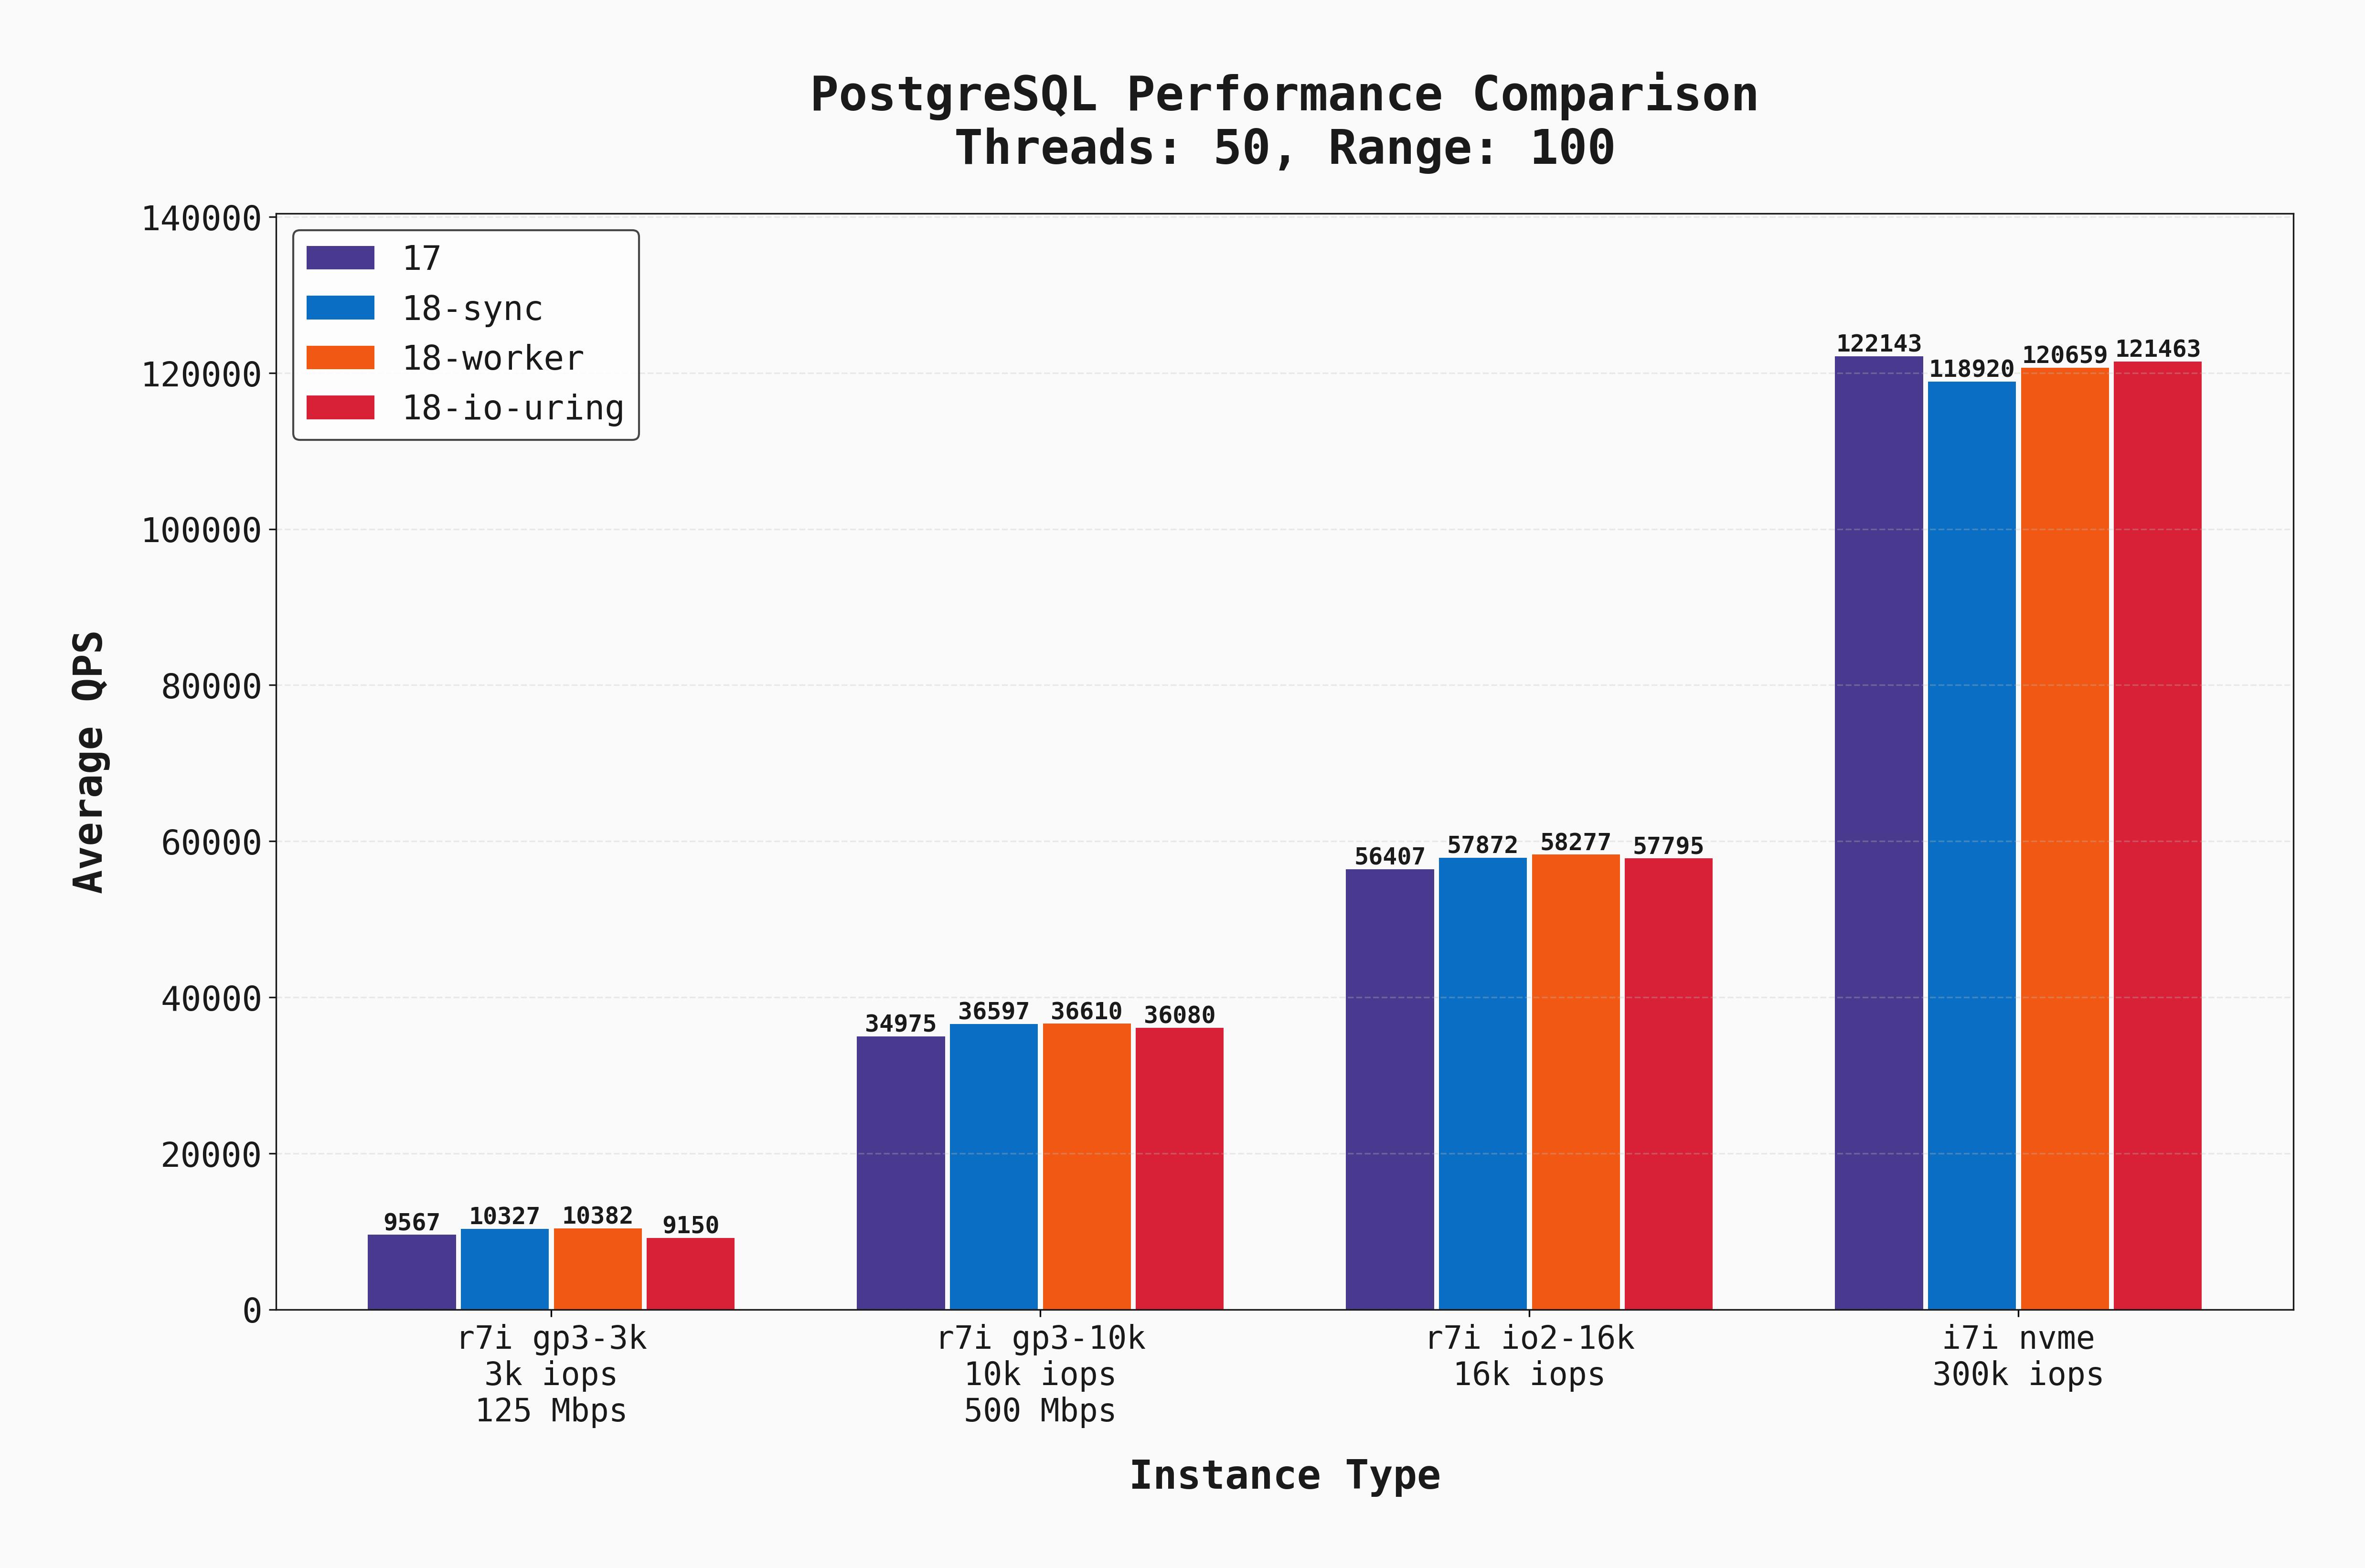
Now with a high level of parallelism and increased I/O demand, several additional things are clear:
- IOPS and throughput are clear bottlenecks for each of the EBS-backed instances. The different versions / I/O settings don't make a huge difference in such cases.
- As we increase the EBS capabilities, the QPS grows in lockstep, and the local-NVME instance outperforms them all.
- Postgres 18 with
syncandworkerhave the best performance on all the EBS-backed instances by a small margin.
Again, the same benchmark but with --range_size=10000.
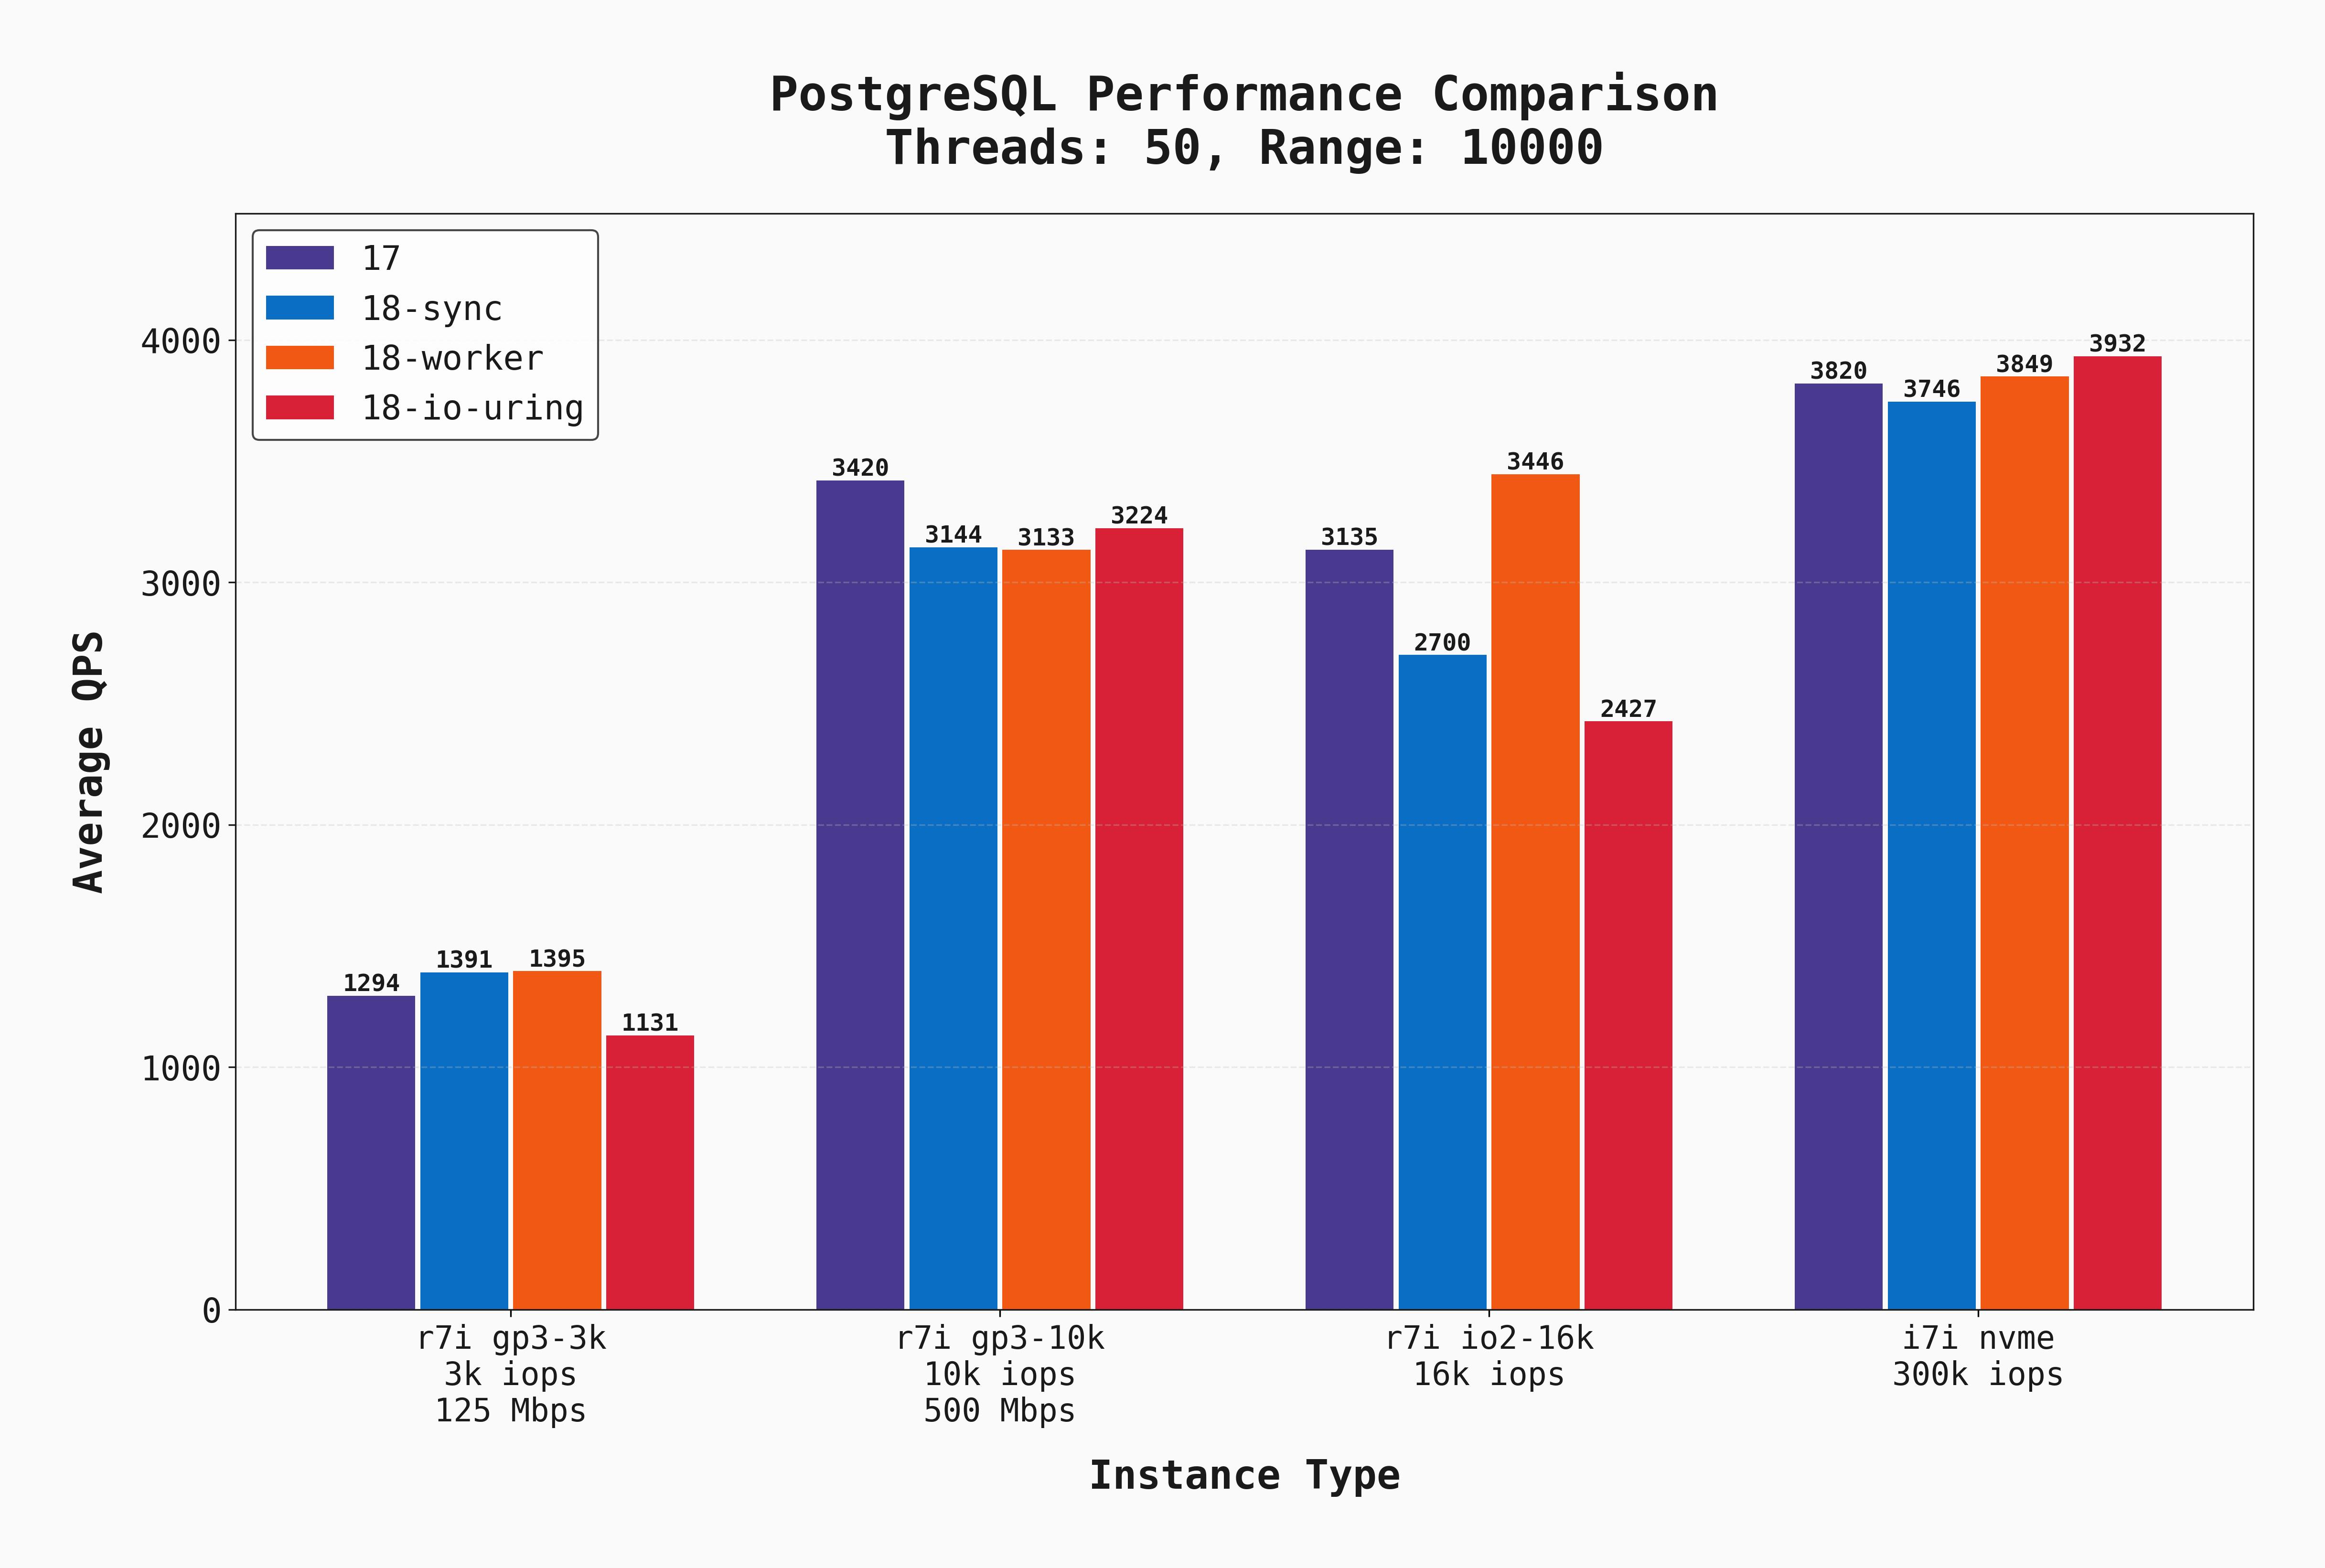
The gp3-10k and io2-16k instances get much closer to local-disk performance. However, this is because we have made the benchmark much more CPU-bound vs I/O-bound, so the low latency of local disks gives less of an advantage (though still the best!) But importantly, we finally have a scenario where io_uring wins! On the NVMe instance, it slightly outperforms the other options.
Below we again compare these results for Postgres 17 and Postgres 18, workers. Click on the thumbnails to add or remove lines from the graph and compare various combinations.
Moderate concurrency
These same benchmarks were also executed with 10 concurrent connections. The results are pretty similar so they will not all be shown, but I do want to point out this graph where --range_size=100:
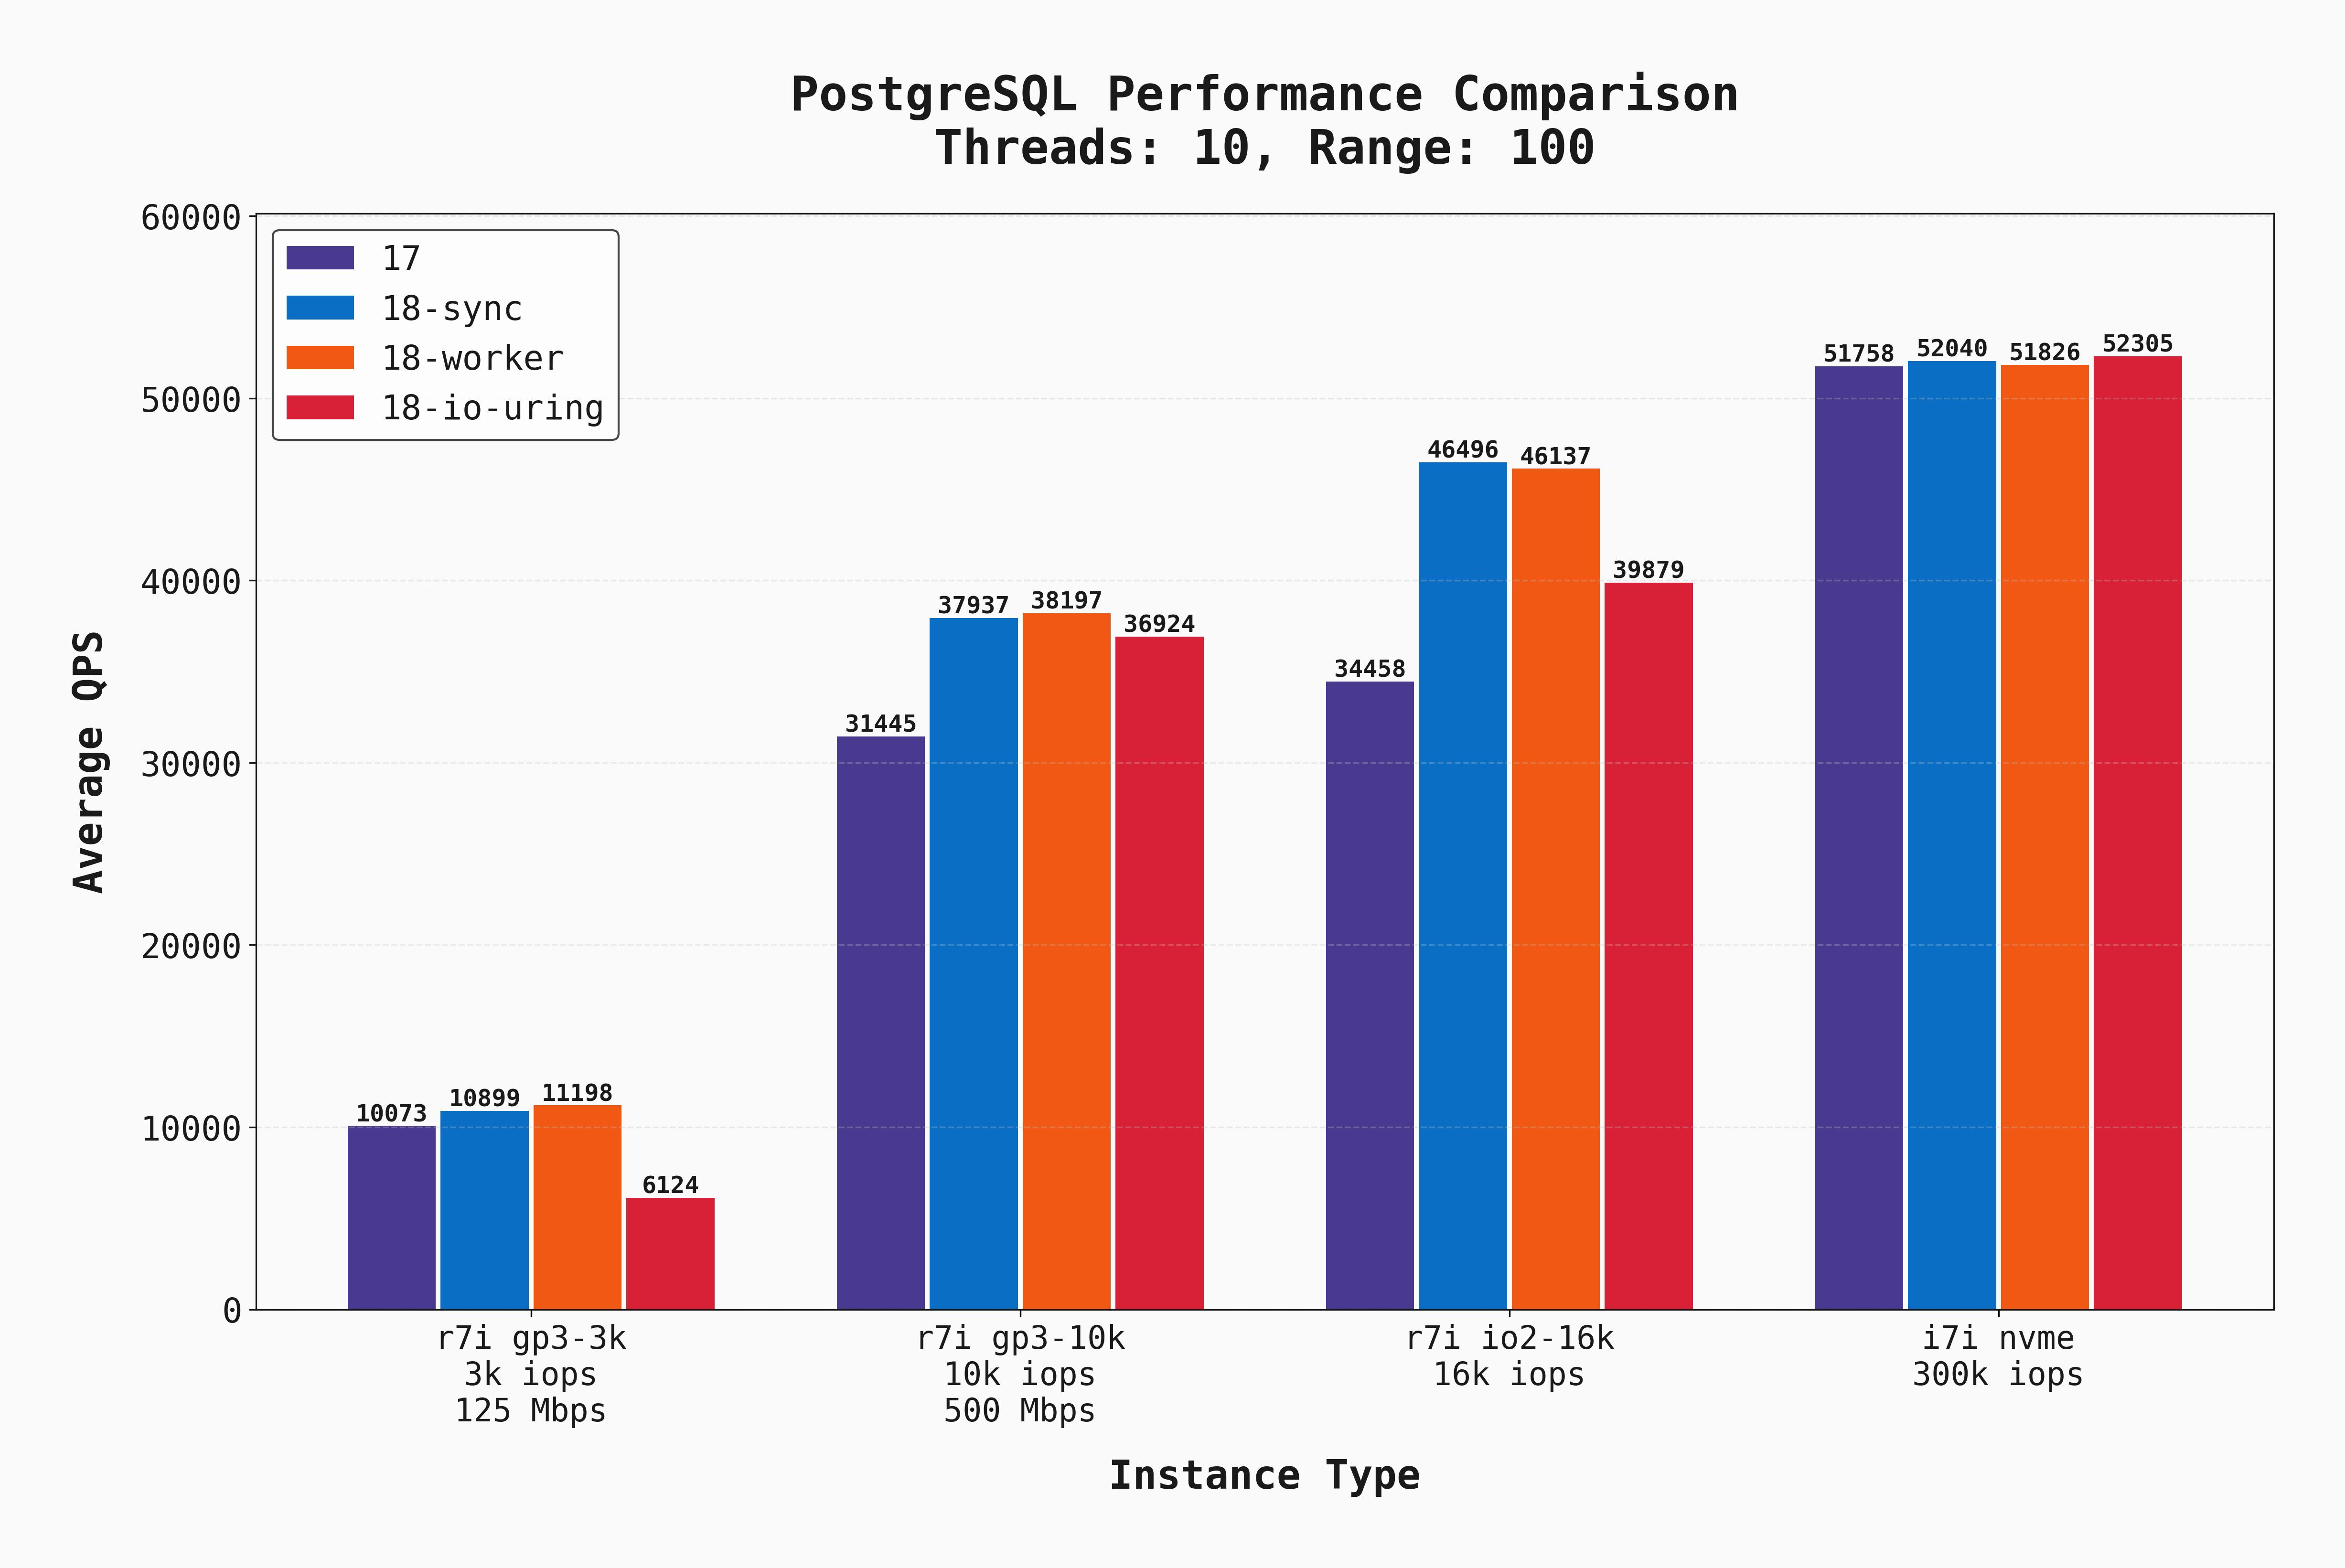
Look carefully at the first bar group (for gp3-3k). The io_uring setting performed significantly worse than the rest. But if you look at that same part of the graph when there were 50 connections, io_uring performs only slightly worse than the rest. To me, this indicates that io_uring performs well when there's lots of I/O concurrency, but in low-concurrency scenarios it isn't as beneficial.
Cost
Cost should always be a consideration when comparing infrastructure setups. Here are the on-demand costs of each server configuration in AWS:
r7iwith gp3 3k IOPS and 125 Mbps: $442.32/mor7iwith gp3 10k IOPS and 500 Mbps: $492.32/mor7iwith io2 16k IOPS: $1,513.82/moi7iwith local NVMe (no EBS): $551.15/mo
And keep in mind, the first three only have 700 GB of storage, whereas the i7i has a 1.8 TB volume! The server with a local NVMe disk is the clear price-performance winner.
Why isn't io_uring the winner?
Given my excitement over the new io_uring capabilities of Postgres 18, I was expecting it to win in many more scenarios. So what's going on here?
For one, this is a very specific type of workload. It is read only, and does a combination of point-selects, range scans, and range aggregations. io_uring surely has other workloads where it would shine. It's also possible that with different postgresql.conf tunings, we'd see improvements from io_uring.
While writing this, I stumbled across Tomas Vondra's excellent blog discussing the new io_method options, how to tune them, and the pros and cons of each. He makes several good points regarding why workers would outperform io_uring, and I recommend you read it. In short:
- Index scans don't (yet) use AIO.
- Though the I/O happens in the background with
io_uring, the checksums / memcpy can still be a bottleneck. workersallows better parallelism for I/O from the perspective of a single process.
So there are legitimate cases where io_uring won't always perform better! I'd love to see further benchmarks from others, spanning other workload types on configurations. You can find many of the configs used for these tests in the appendix.
Conclusions
Though narrow, this was a fun experiment to compare performance of Postgres versions and I/O settings. My key takeaways are:
- Postgres 18 brings nice I/O improvements and configuration flexibility. Great job to the maintainer team!
- Local disks are the clear winner. When you have low-latency I/O and immense IOPS, the rest matters less. This is why PlanetScale Metal makes for best-in-class database performance.
- Using
io_method=workerwas a good choice as the new default. It comes with a lot of the "asynchronous" benefits ofio_uringwithout relying on that specific kernel interface, and can be tuned by settingio_workers=X. - There's no one-size-fits-all best I/O configuration.
- Though they do benefit, the new
workersI/O configuration doesn't help network-attached storage scenarios as much as one might hope.
What else do you want to see benchmarked? Reach out to let us know.
Appendix: configuration
Here are a selection of the critical custom-tuned Postgres configs used for this benchmark:
shared_buffers = 16GB          # 25% of RAM
effective_cache_size = 48GB    # 75% of RAM
work_mem = 64MB
maintenance_work_mem = 2GB

wal_level = replica
max_wal_size = 16GB
min_wal_size = 2GB
wal_buffers = 16MB
checkpoint_completion_target = 0.9

random_page_cost = 1.1
effective_io_concurrency = 200
default_statistics_target = 100

max_worker_processes = 8
max_parallel_workers_per_gather = 4
max_parallel_workers = 8
max_parallel_maintenance_workers = 4

bgwriter_delay = 200ms
bgwriter_lru_maxpages = 100
bgwriter_lru_multiplier = 2.0

autovacuum = on
autovacuum_max_workers = 4
autovacuum_naptime = 10s
autovacuum_vacuum_scale_factor = 0.05
autovacuum_analyze_scale_factor = 0.025

logging_collector = on
...more log configs...

shared_preload_libraries = 'pg_stat_statements'
track_activity_query_size = 2048
track_io_timing = on

jit = on

# io_workers left at default = 3